Tropical Depression One-E forms in the East Pacific Ocean
![GOES-17 “Red” Visible (0.64 µm) and “Clean” Infrared Window (10.35 µm) images [click to play animation | MP4]](https://cimss.ssec.wisc.edu/satellite-blog/images/2020/04/200424_goes17_visible_infrared_East_Pacific_Invest90E_anim.gif)
GOES-17 “Red” Visible (0.64 µm) and “Clean” Infrared Window (10.35 µm) images [click to play animation | MP4]
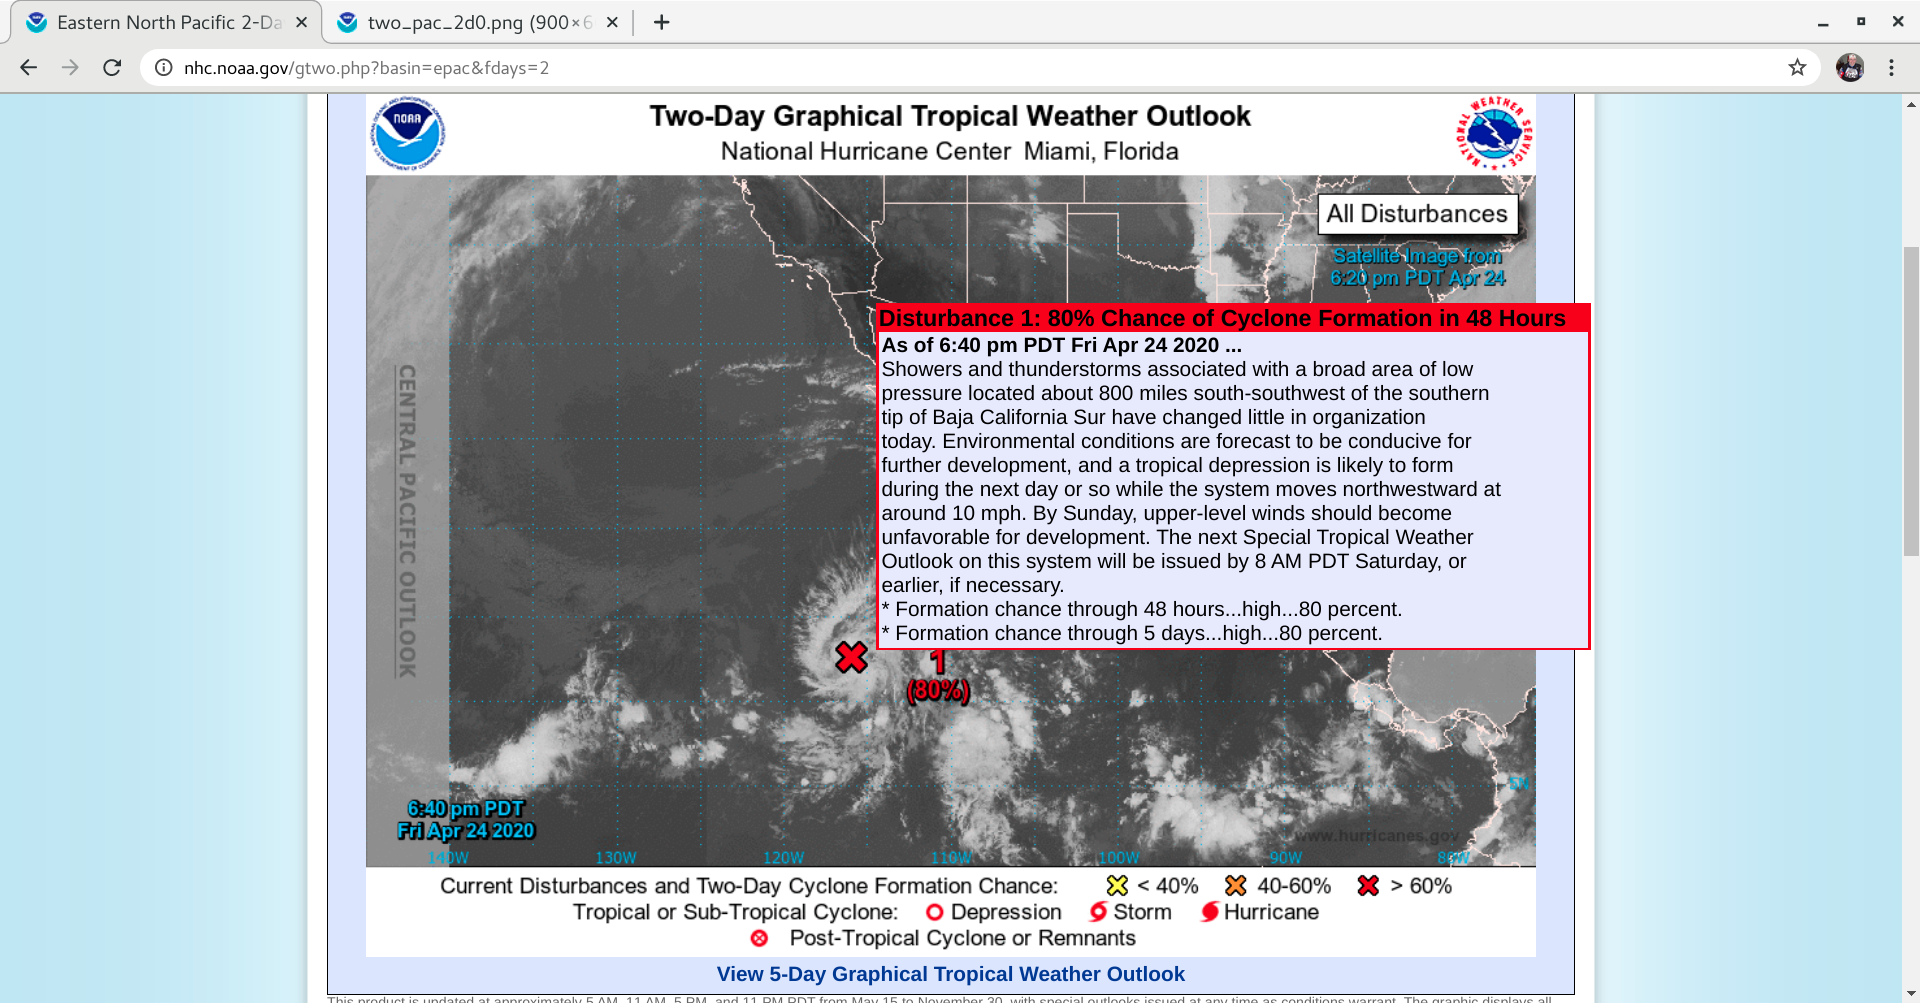
GOES-17 Visible images with a plot of Deep-Layer Wind Shear from the CIMSS Tropical Cyclones site (below) indicated that Invest 90E was embedded within an environment of low shear — the National Hurricane Center gave the feature an 80% chance of further developing into a tropical depression within 48 hours.
![GOES-17 “Red” Visible (0.64 µm) with a plot of Deep-Layer Wind Shear at 23 UTC images [click to enlarge]](https://cimss.ssec.wisc.edu/satellite-blog/images/2020/04/200424_23utc_goes17_visible_shear_Invest90E_anim.gif)
GOES-17 “Red” Visible (0.64 µm) images, with a plot of Deep-Layer Wind Shear at 23 UTC [click to enlarge]
![VIIRS True Color RGB and Infrared Window (11.45 µm) images from NOAA-20 and Suomi NPP [click to enlarge]](https://cimss.ssec.wisc.edu/satellite-blog/images/2020/04/200424_noaa20_suomiNPP_trueColorRGB_infraredWindow_East_Pacific_Invest90E_anim.gif)
VIIRS True Color RGB and Infrared Window (11.45 µm) images from NOAA-20 and Suomi NPP [click to enlarge]
===== 25 April Update =====
![GOES-17 “Clean” Infrared Window (10.35 µm) images [click to play animation | MP4]](https://cimss.ssec.wisc.edu/satellite-blog/images/2020/04/200425_goes17_infrared_Tropical_Depression_One_anim.gif)
GOES-17 “Clean” Infrared Window (10.35 µm) images [click to play animation | MP4]
![GOES-17 “Clean” Infrared Window (10.35 µm) images [click to play animation | MP4]](https://cimss.ssec.wisc.edu/satellite-blog/images/2020/04/200425_goes17_infrared_surfaceAnalysis_TD_One_anim.gif)
GOES-17 “Clean” Infrared Window (10.35 µm) images [click to play animation | MP4]
![MIMIC Total Precipitable Water product [click to enlarge]](https://cimss.ssec.wisc.edu/satellite-blog/images/2020/04/200424_200425_mimicTPW_East_Pacific_anim.gif)
MIMIC Total Precipitable Water product [click to enlarge]
![GOES-17 “Red” Visible (0.64 µm) images [click to play animation | MP4]](https://cimss.ssec.wisc.edu/satellite-blog/images/2020/04/200425_goes17_visible_Tropical_Depression_One_anim.gif)
GOES-17 “Red” Visible (0.64 µm) images [click to play animation | MP4]