Outbreak of severe thunderstorms across the Deep South
![GOES-16 "Red" Visible (0.64 µm) images [click to play animation | MP4]](https://cimss.ssec.wisc.edu/satellite-blog/images/2020/04/200412_goes16_visible_awips_Deep_South_anim.gif)
GOES-16 “Red” Visible (0.64 µm) images [click to play animation | MP4]

GOES-16 “Clean” Infrared Window (10.35 µm) images [click to play animation | MP4]
![GOES-16 "Red" Visible (0.64 µm ), "Clean" Infrared Window (10.35 µm), and Visible/Infrared Sandwich RGB images [click to play animation | MP4]](https://cimss.ssec.wisc.edu/satellite-blog/images/2020/04/200412_goes16_visible_infrared_sandwichRGB_MS_anim.gif)
GOES-16 “Red” Visible (0.64 µm ), “Clean” Infrared Window (10.35 µm) and Visible/Infrared Sandwich RGB images [click to play animation | MP4]
![GOES-16 "Red" Visible (0.64 µm) images, with time-matched SPC Storm Reports plotted in red [click to play animation | MP4]](https://cimss.ssec.wisc.edu/satellite-blog/images/2020/04/200412_goes16_visible_Deep_South_anim.gif)
GOES-16 “Red” Visible (0.64 µm) images, with time-matched SPC Storm Reports plotted in red [click to play animation | MP4]
![GOES-16 "Clean" Infrared Window (10.35 µm) images, with time-matched SPC Storm Reports plotted in cyan [click to play animation | MP4]](https://cimss.ssec.wisc.edu/satellite-blog/images/2020/04/200412_goes16_infrared_Deep_South_anim.gif)
GOES-16 “Clean” Infrared Window (10.35 µm) images, with time-matched SPC Storm Reports plotted in cyan [click to play animation | MP4]
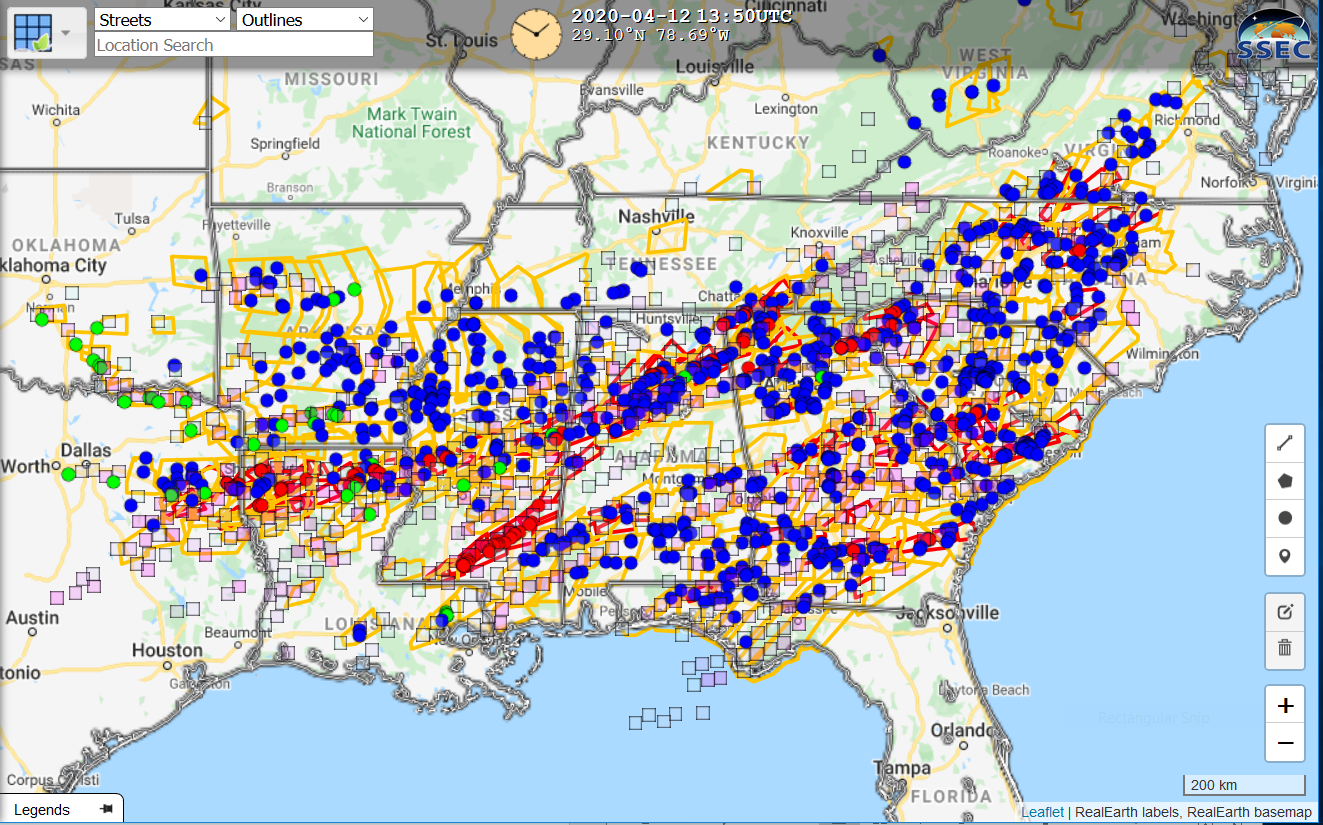
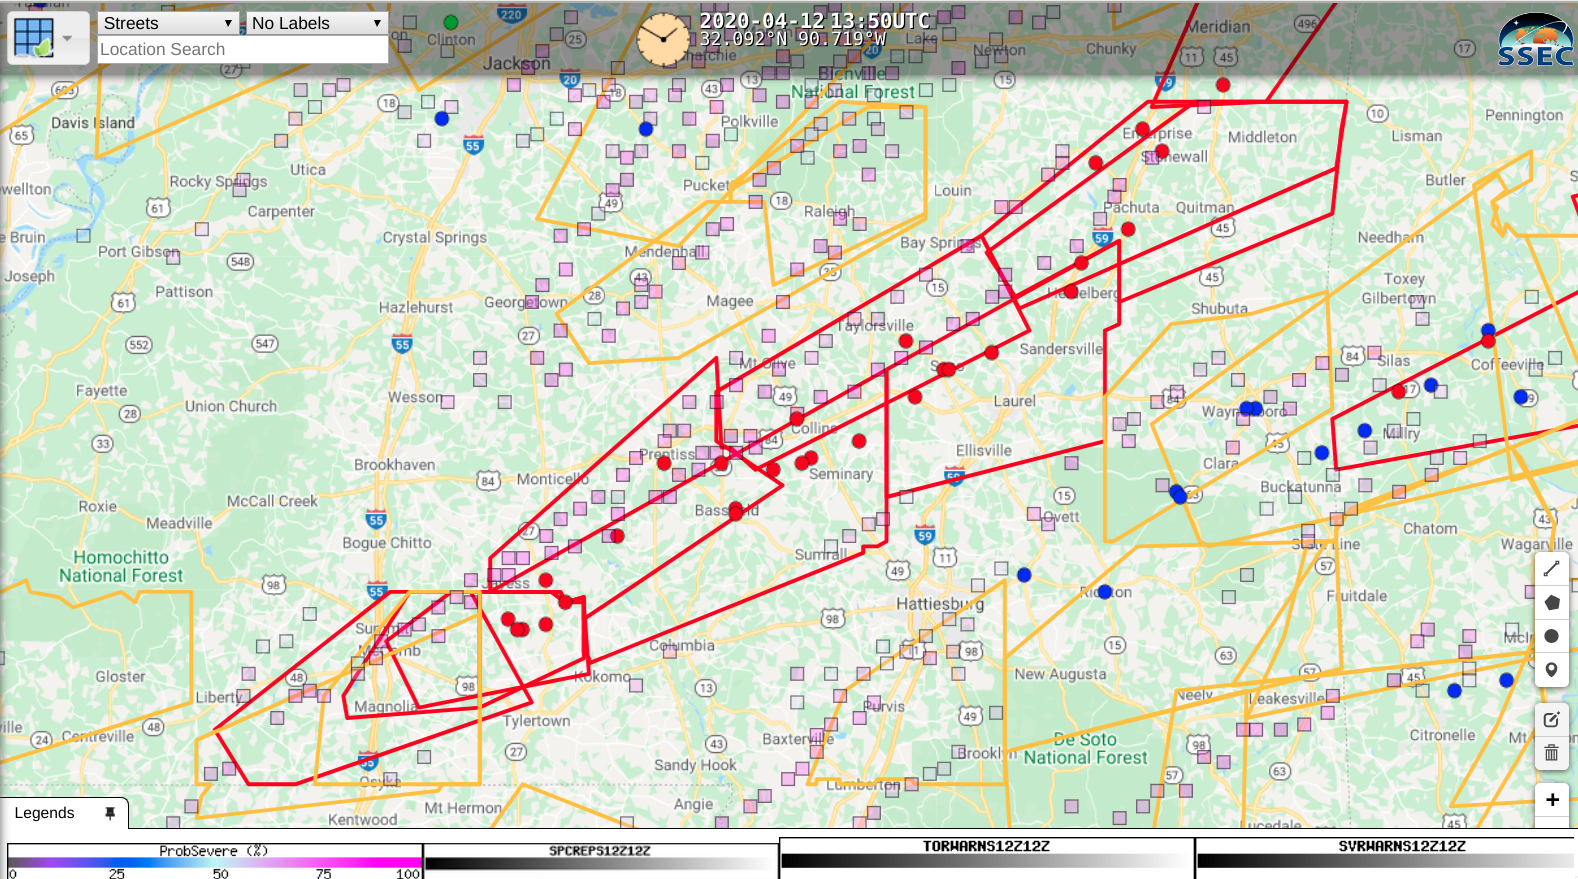
Severe weather reports from 12 April 2020 (Green: Hail; Blue: Wind; Red: Tornado), NWS Warning Polygons and ProbSevere locations (plotted as boxes when ProbSevere exceeded 50% (Click to enlarge)
===== 14 April Update =====
GOES-16 “Red” Visible (0.64 µm) and Normalized Difference Vegetation Index images [click to enlarge]
In a toggle between Aqua MODIS NDVI and Land Surface Temperature (LST) images (below), LST values were 5-10ºF warmer — low 80s F, darker shades of red — within the tornado damage path, compared to areas adjacent to the path.
![Aqua MODIS Normalized Difference Vegetation Index and Land Surface Temperature images [click to enlarge]](https://cimss.ssec.wisc.edu/satellite-blog/images/2020/04/200414_1926utc_aqua_modis_normalizedDifferenceVegetationIndex_landSurfaceTemperature_MS_tornado_damage_paths_anim.gif)
Aqua MODIS Normalized Difference Vegetation Index and Land Surface Temperature images [click to enlarge]
![Aqua MODIS True Color RGB images from 26 March and 14 April [click to enlarge]](https://cimss.ssec.wisc.edu/satellite-blog/images/2020/04/200326_200414_aqua_modis_trueColorRGB_MS_tornado_damage_path_v2_anim.gif)
Aqua MODIS True Color RGB images from 26 March and 14 April [click to enlarge]

True- and False-Color imagery from the afternoon NOAA-20 overpass on 14 April 2020 (Click to enlarge)
NOAA-20 True Color RGB imagery of the Mississippi EF-4 tornado damage path that had a maximum with of 2 miles is shown below, using RealEarth.
![NOAA-20 VIIRS True Color RGB image, including county outlines and map labels [click to enlarge]](https://cimss.ssec.wisc.edu/satellite-blog/images/2020/04/200414_1850utc_noaa20_viirs_trueColorRGB_MS_EF4_tornado_damage_path_anim.gif)
NOAA-20 VIIRS True Color RGB image, including county outlines and map labels [click to enlarge]
A StoryMap of this event in South Carolina, created by the NWS in Columbia SC, is here.