Satellite signatures of a “sting jet”
![GOES-16 Lower-level (7.3 µm) images, with hourly plots of buoy and ship reports [click to play MP4 animation]](https://cimss.ssec.wisc.edu/satellite-blog/wp-content/uploads/sites/5/2018/01/G16_WATER_VAPOR_B10_STING_JET_04JAN2018_EXP_960x1280_B10_2018004_080220_0001PANEL_00073.GIF)
GOES-16 Lower-level (7.3 µm) images, with hourly plots of buoy and ship reports [click to play MP4 animation]
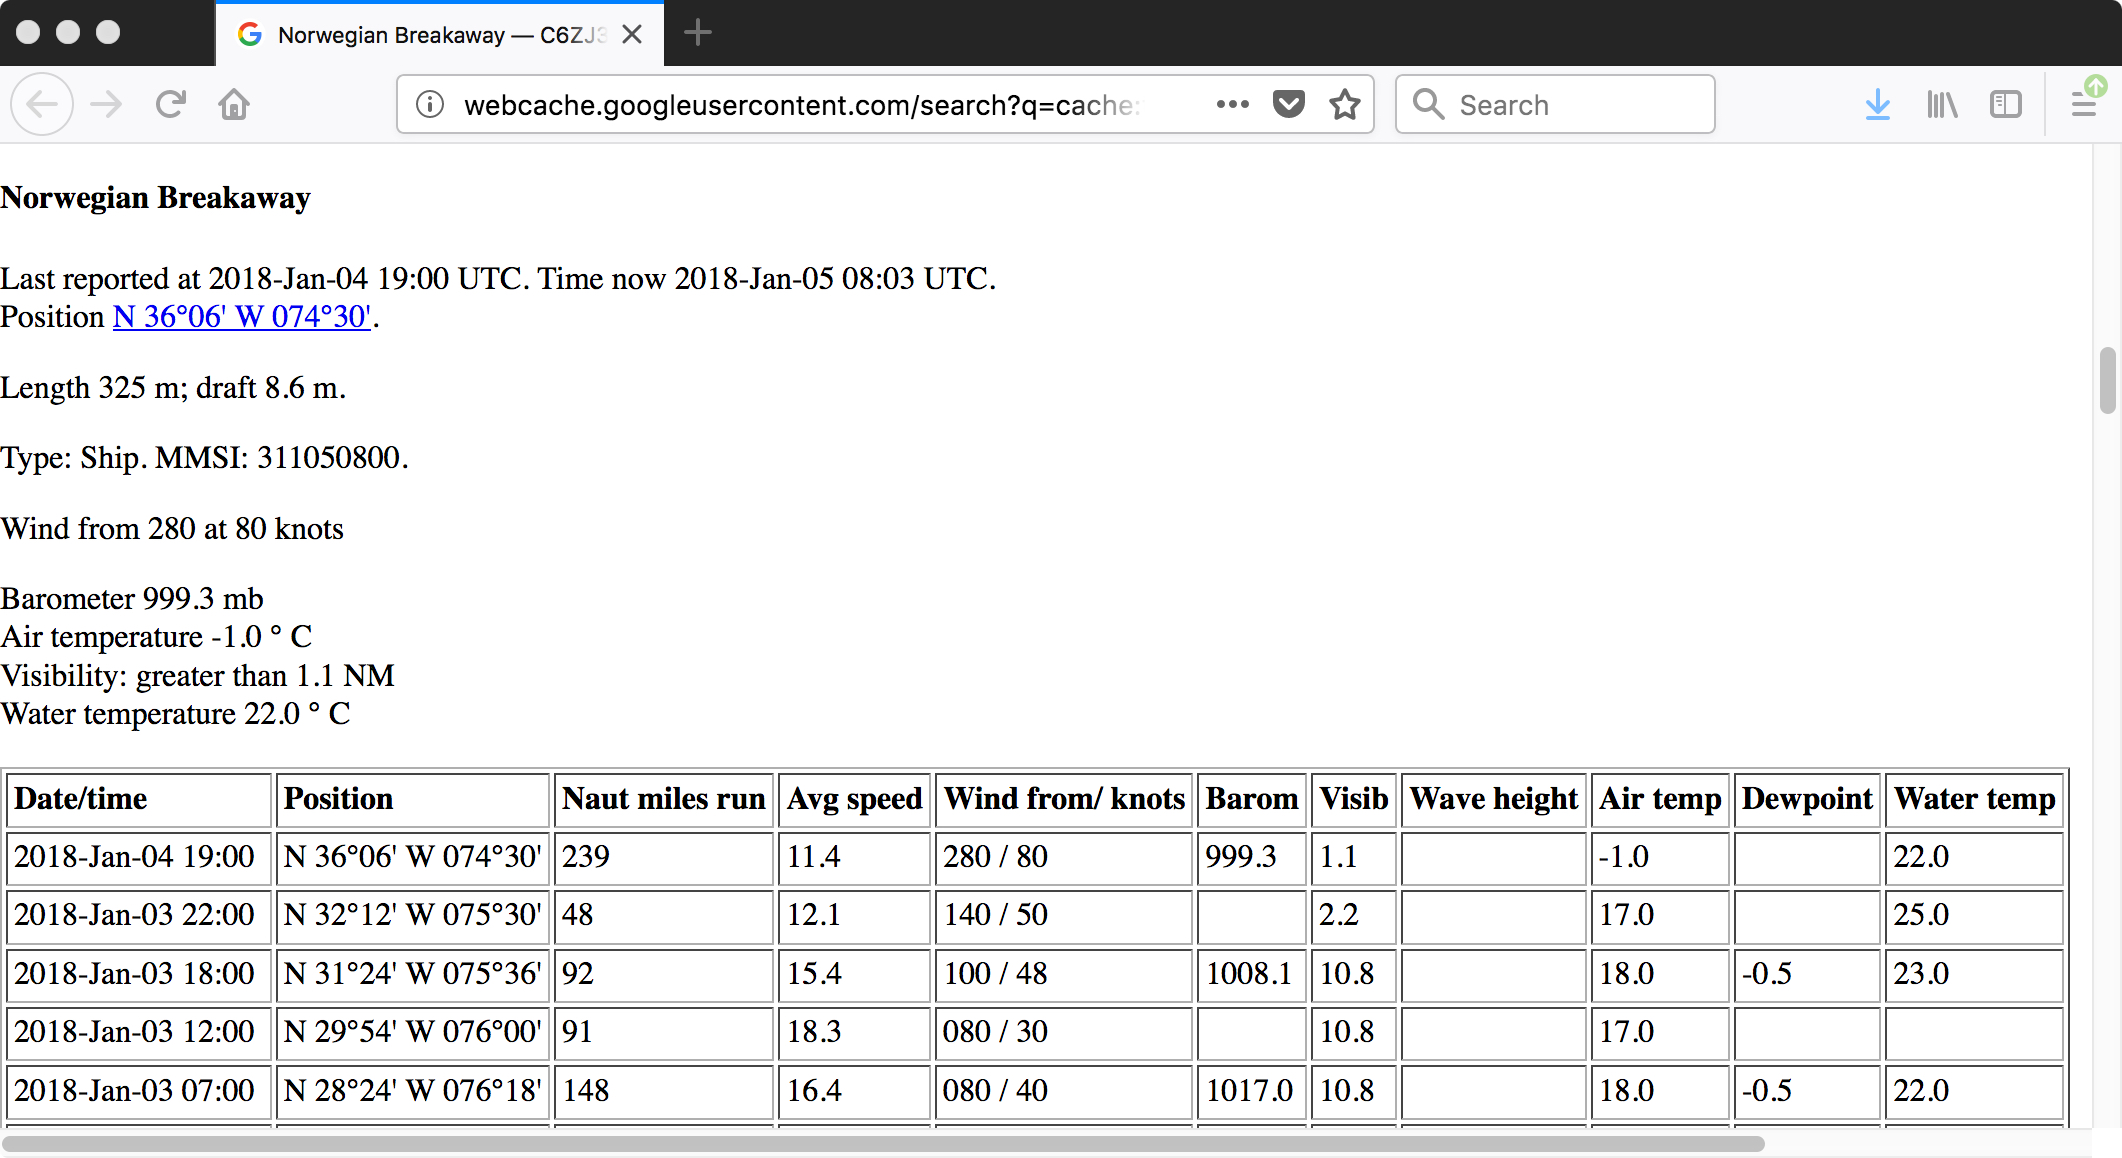
The passenger cruise ship Norwegian Breakaway was en route to New York City from the Bahamas when it experienced very strong winds and rough seas early in the morning on 04 January (media story) — it appears as though the ship may have been in the general vicinity of this sting jet feature (ship data), where intense winds were descending to the surface from higher levels of the atmosphere:
Interpolating https://t.co/nNODxB61uj suggests in that vicinity/time. This is NAM nest 06z initialization, near time of https://t.co/NG2ytIaztM. In any event, sailed directly into core of what models correctly predicted to be one of most extreme #bombogenesis rates on record. pic.twitter.com/rcQK7IP2Qv
— Stu Ostro (@StuOstro) January 7, 2018
A comparison of GOES-16 (GOES-East) and GOES-13 Water Vapor images (below) demonstrated how the GOES-16 improvement in spatial resolution (2 km at satellite sub-point, vs 4 km for GOES-13) and more frequent imaging (routinely every 5 minutes over the CONUS domain, vs 15-30 minutes for GOES-13) helped to better follow the evolution of the sting jet feature. The 2 known locations of the Norwegian Breakaway around the time period of the image animation are plotted in red.
Water Vapor images from GOES-16 (6.9 µm, left) and GOES-13 (6.5 µm, right), with the 2 known locations of the Norwegian Breakaway plotted in red [click to play MP4 animation]
![GOES-16 Mid-level (6.9 µm) images, with hourly plots of buoy and ship reports [click to play MP4 animation]](https://cimss.ssec.wisc.edu/satellite-blog/wp-content/uploads/sites/5/2018/01/G16_WATER_VAPOR_B9_STING_JET_04JAN2018_EXP_960x1280_B9_2018004_080220_0001PANEL_00073.GIF)
GOES-16 Mid-level (6.9 µm) images, with hourly plots of buoy and ship reports [click to play MP4 animation]
![GOES-16 Upper-level (6.2 µm) images, with hourly plots of buoy and ship reports [click to play MP4 animation]](https://cimss.ssec.wisc.edu/satellite-blog/wp-content/uploads/sites/5/2018/01/G16_WATER_VAPOR_B8_STING_JET_04JAN2018_EXP_960x1280_B8_2018004_080220_0001PANEL_00073.GIF)
GOES-16 Upper-level (6.2 µm) images, with hourly plots of buoy and ship reports [click to play MP4 animation]
![Suomi NPP VIIRS Day/Night Band (0.7 µm) image [click to enlarge]](https://cimss.ssec.wisc.edu/satellite-blog/wp-content/uploads/sites/5/2018/01/180104_0614utc_viirs_dnb_sting_jet_zoom.jpg)
Suomi NPP VIIRS Day/Night Band (0.7 µm) image [click to enlarge]
![Aqua MODIS Infrared Window (11.0 µm) image [click to enlarge]](https://cimss.ssec.wisc.edu/satellite-blog/wp-content/uploads/sites/5/2018/01/180104_0725utc_aqua_modis_infrared_window_band31.jpg)
Aqua MODIS Infrared Window (11.0 µm) image [click to enlarge]