Tropical Depression 2 becomes Tropical Storm Barry in the far southwestern Gulf of Mexico
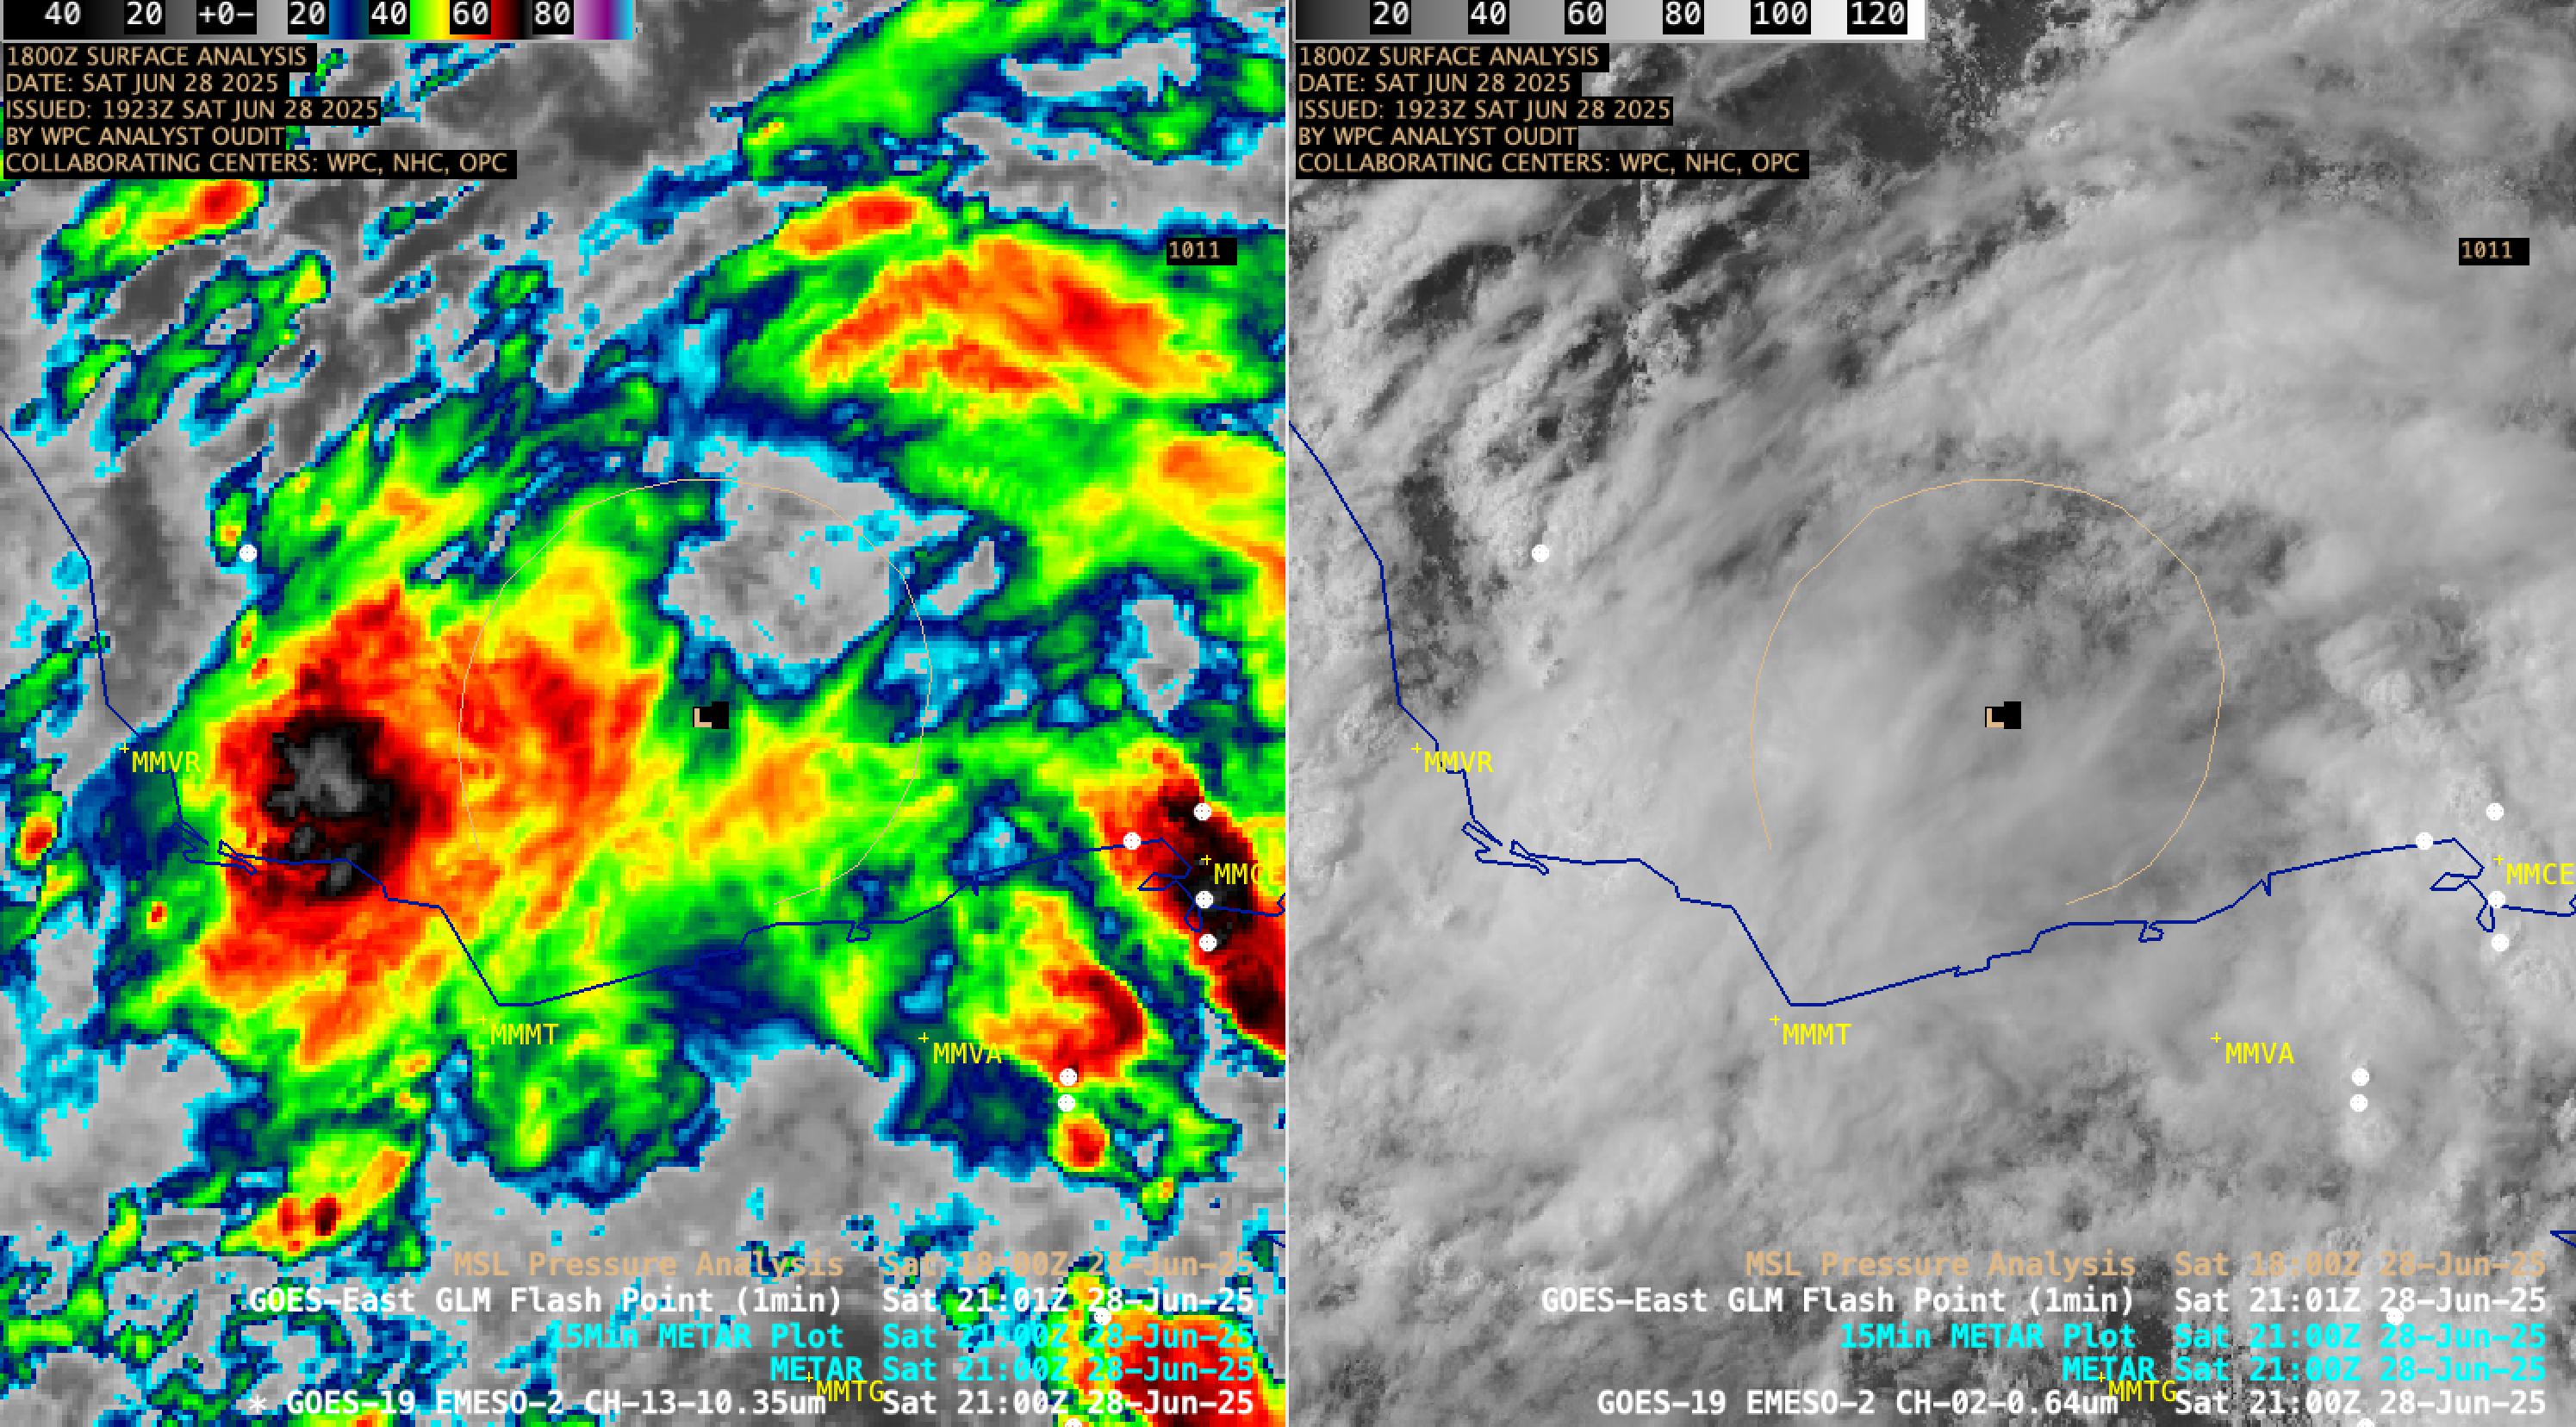
1-minute GOES-19 Infrared (left) and Visible (right) images with an overlay of GLM Flash Points, from 1601 UTC on 28 June to 0045 UTC on 29 June [click to play MP4 animation]
A GOES-19 Visible image at 1619 UTC with an overlay of Metop-C ASCAT winds (below) depicted a surface circulation, with wind speeds in the 20-25 knot range within the southeast quadrant.
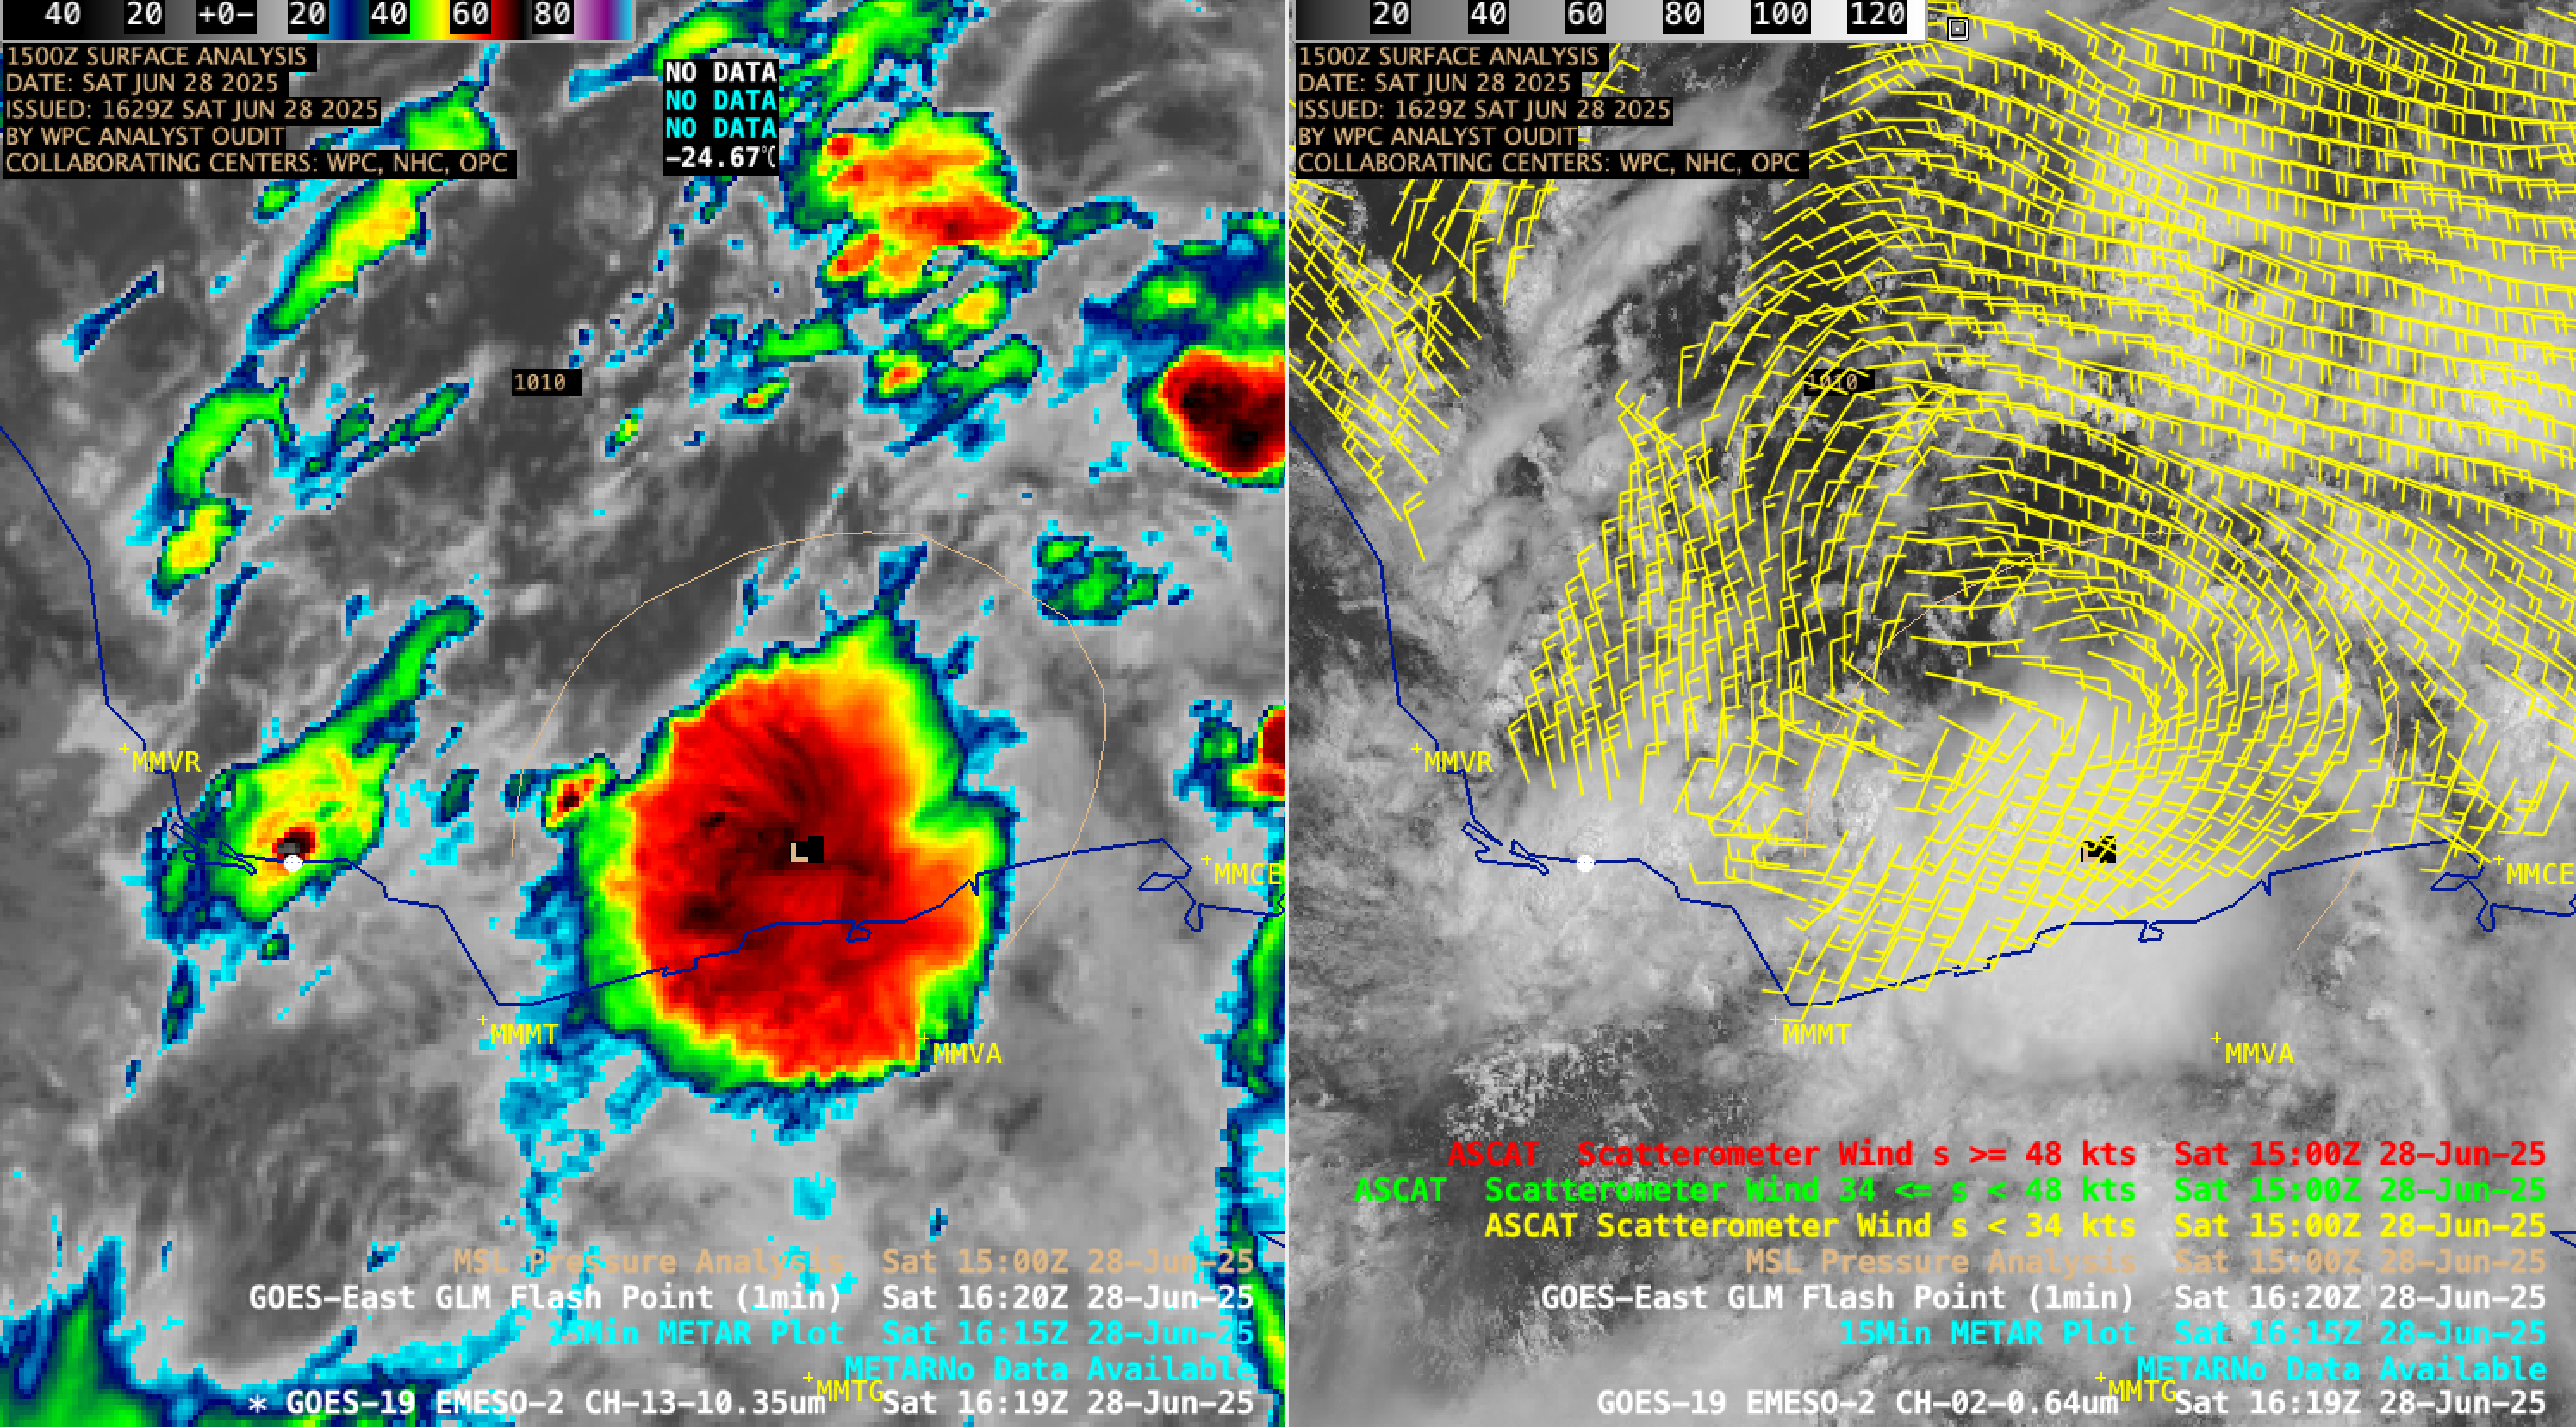
GOES-19 Infrared and Visible images at 1619 UTC on 28 June, with an an overlay of Metop-C ASCAT scatterometer winds on the Visible image [click to enlarge]
GOES-19 Infrared images with an overlay of contours and streamlines of deep-layer wind shear at 0100 UTC on 29 June
===== 29 June Update =====
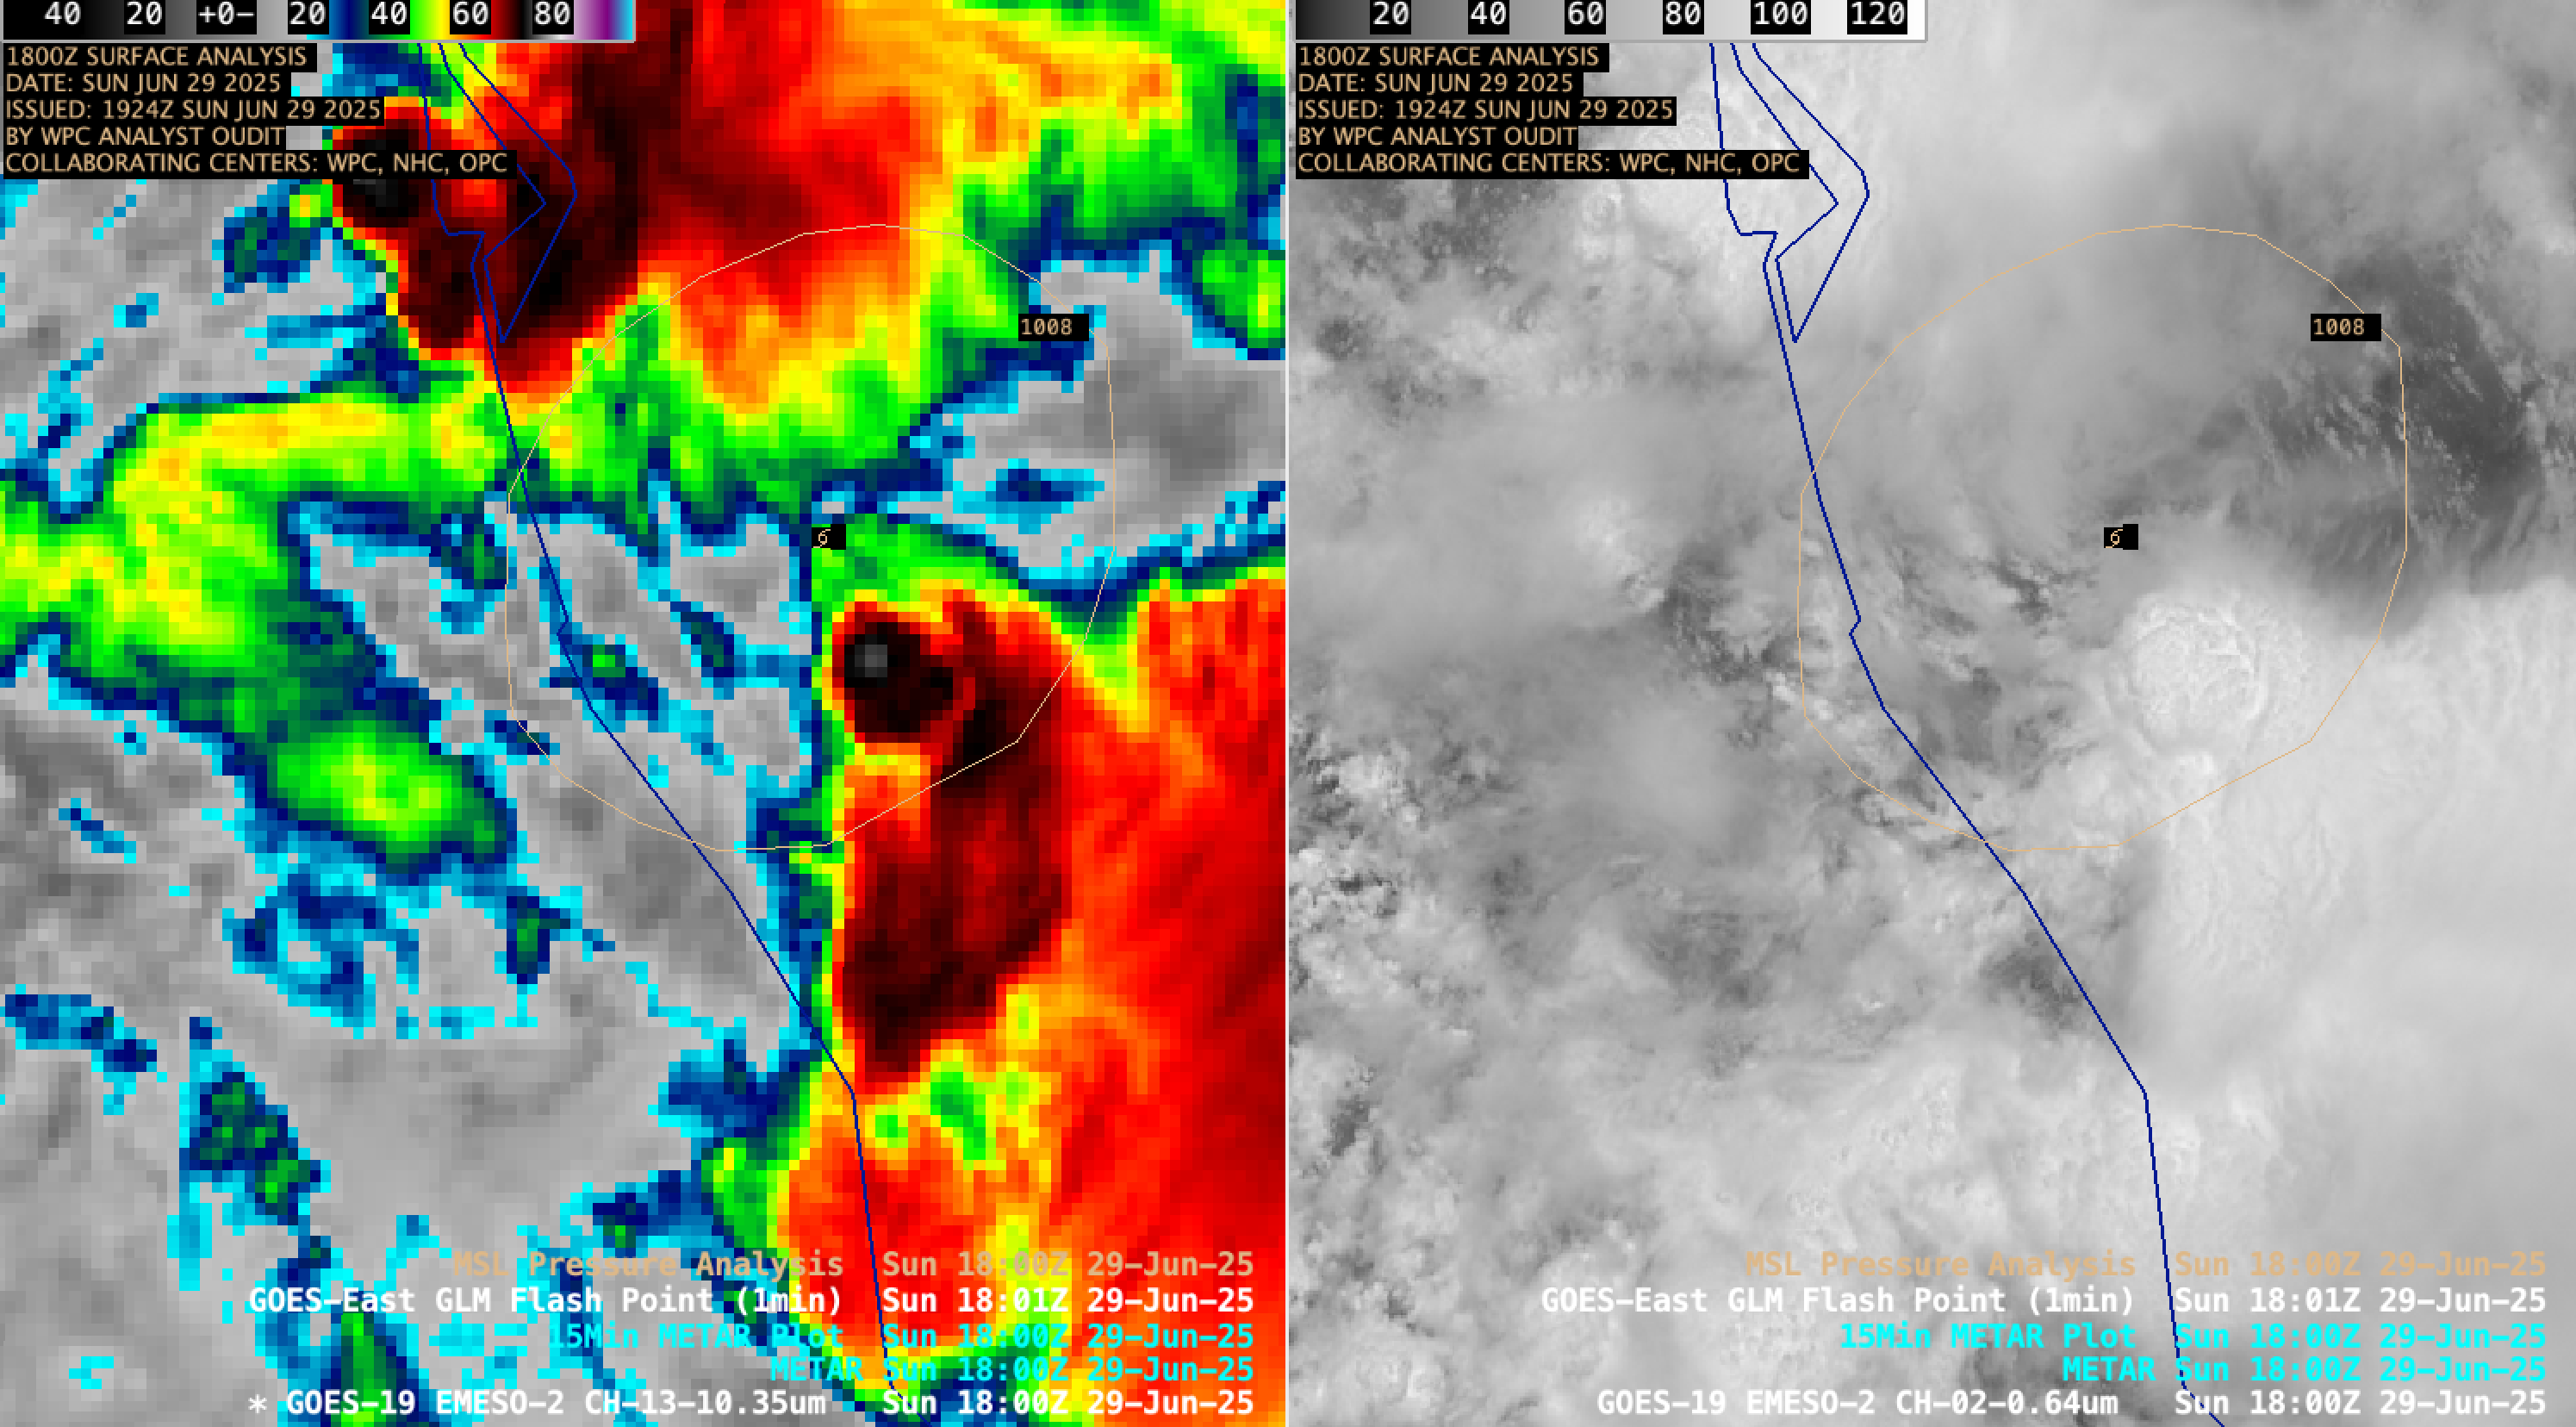
1-minute GOES-19 Infrared and Visible images with an overlay of GLM Flash Points, from 1341-1900 UTC on 29 June [click to play MP4 animation]
A DMSP-17 SSMIS Microwave image at 1301 UTC (below) showed no evidence of a closed eye structure, with only signatures of convection immediately south and east of the storm center.
DMSP-17 SSMIS Microwave (85 GHz) image at 1301 UTC on 29 June
As was the case during the previous day, TS Barry was still in an unfavorable environment characterized by high values of deep-layer wind shear (below).
GOES-19 Infrared images with an overlay of contours and streamlines of deep-layer wind shear at 1500 UTC on 29 June
On the other hand, the MIMIC Total Precipitable Water product (below) showed abundant moisture in the vicinity of TS Barry, which helped to sustain the development of deep convection near the storm center.
MIMIC Total Precipitable Water product at 1500 UTC on 29 June, with an overly of the position of TS Barry at 1200 UTC
It is interesting to note that TD2 passed over a small patch of slightly warmer Sea Surface Temperature not long before intensifying to become TS Barry (below) — although it’s not clear what role (if any) this played in system intensification.
Sea Surface Temperature at 2233 UTC on 28 June, with an overlay of the position of TS Barry at 1200 UTC on 29 June
Wind Shear, Sea Surface Temperature, MIMIC TPW and DMSP Microwave images were sourced from the CIMSS Tropical Cyclones site.