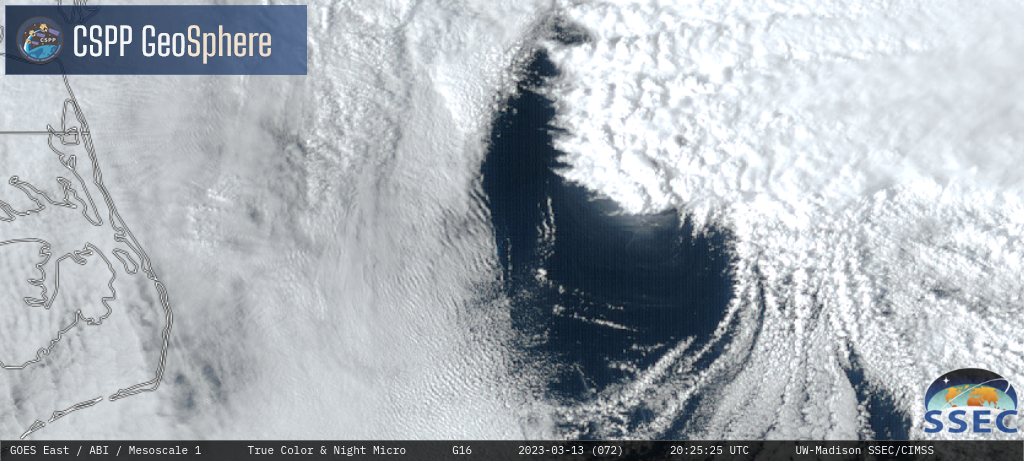
When clear skies are present (at night!), the Nighttime Microphysics RGB provides little information about the overlying atmosphere. You might see nice Sea Surface Temperature gradients, as in the image below from the CSPP Geosphere site; the North Wall of the Gulf Stream is readily apparent to the east of North Carolina and Virginia.
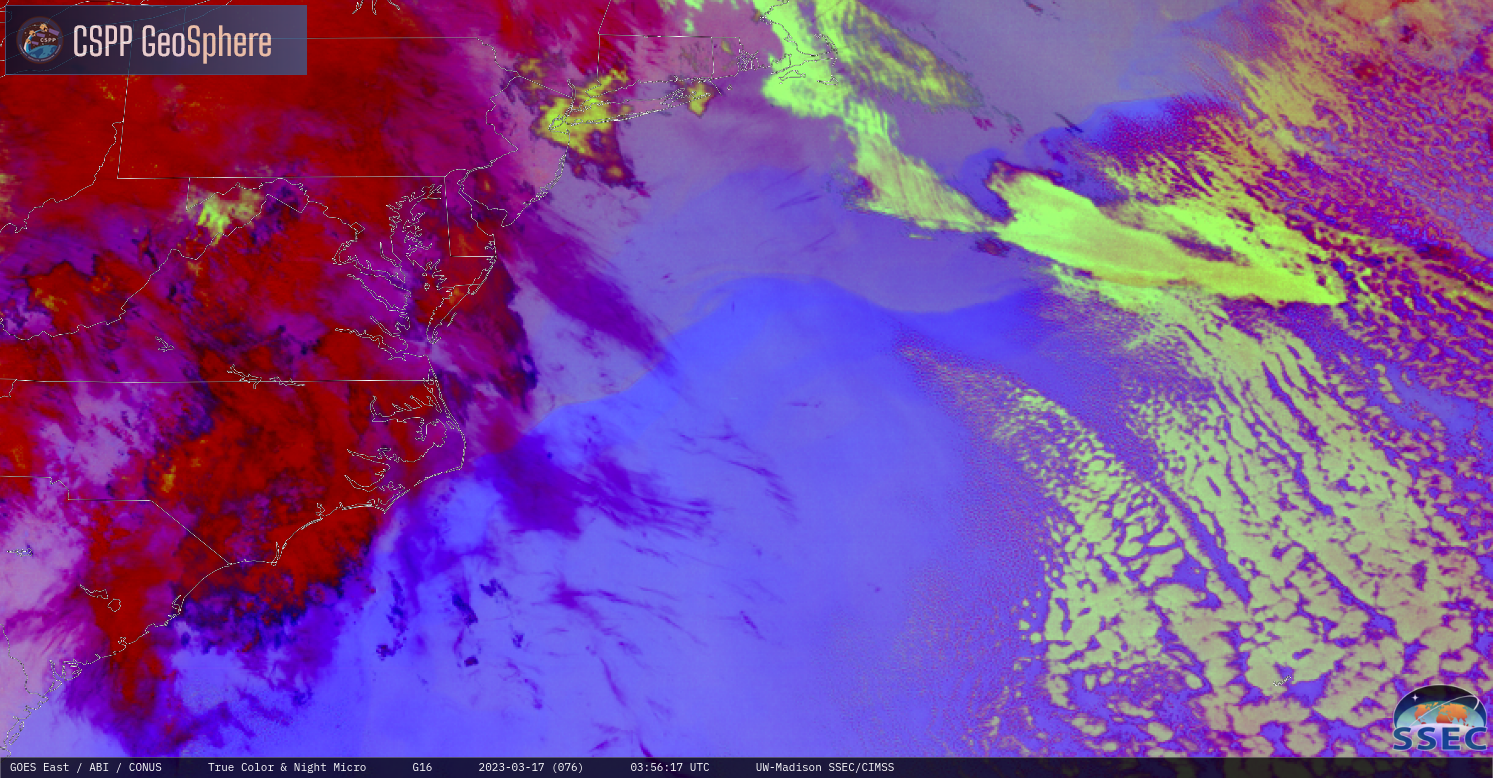
Can you identify gradients in moisture, or in stability, in the still image above? How about in the animation below from the CONUS (PACUS) sector of GOES-18? This is a big challenge, as knowledge of moisture and stability is important for situational awareness. GOES-R Level 2 products can be added to the animation to better define the thermodynamics of the atmosphere.
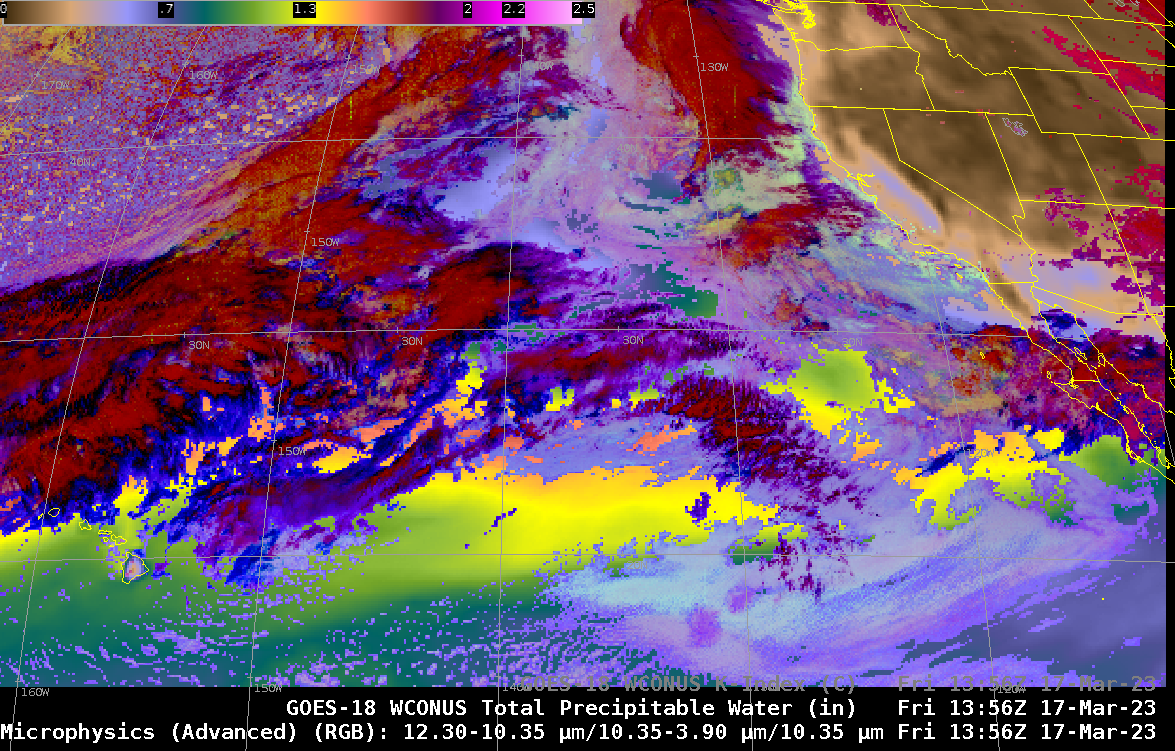
Add (clear sky only) Total Precipitable Water (or K Index), two level 2 derived products, underneath the RGB above, as in the animations below. Despite cloudiness, the longitudinally-constrained ribbon of relatively moist air (about 1.5″ in its center versus 1.2-1.3 to the north and south) approaching the central Mexican coast is apparent. Instability, however, shows a wider distribution. In both cases, the satellite is giving more information than can be inferred from just the RGB. It does take practice, however, to separate the colors of the RGB from the colors of the color enhancements used in the TPW or K Index fields.
The Level 2 Moisture distribution, above, is consistent with microwave estimates of moisture from the MIMIC Total Precipitable Water site, below.
View only this post Read Less


