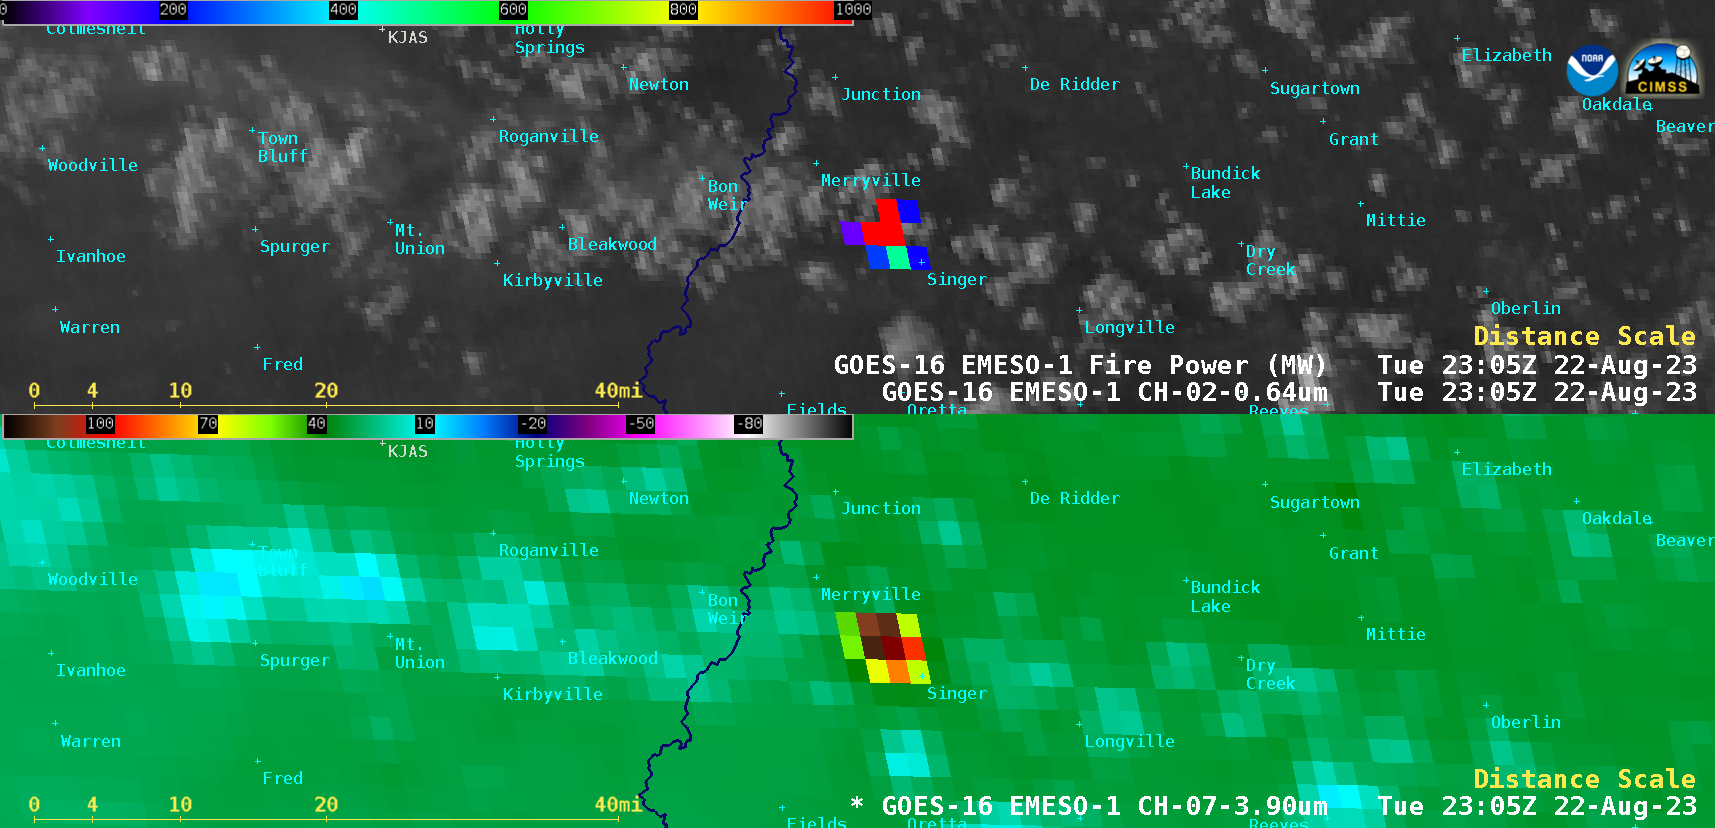
1-minute Mesoscale Domain Sector GOES-16 (GOES-East) “Red” Visible (0.64 µm) + Fire Power derived product (a component of the GOES Fire Detection and Characterization Algorithm FDCA) and Shortwave Infrared (3.9 µm) images (above) showed the thermal signature associated with the Tiger Island Fire in far western Louisiana on 22 August 2023. A combination of mandatory and voluntary evacuations were... Read More

GOES-16 “Red” Visible (0.64 µm) images with an overlay of the Fire Power derived product (top) and Shortwave Infrared (3.9 µm) images (bottom) [click to play animated GIF | MP4]
1-minute
Mesoscale Domain Sector GOES-16
(GOES-East) “Red” Visible (
0.64 µm) + Fire Power derived product (a component of the GOES Fire Detection and Characterization Algorithm
FDCA) and Shortwave Infrared (
3.9 µm) images
(above) showed the thermal signature associated with the Tiger Island Fire in far western Louisiana on
22 August 2023. A combination of mandatory and voluntary evacuations were issued for parts of the Singer and Merryville areas in Beauregard Parish.
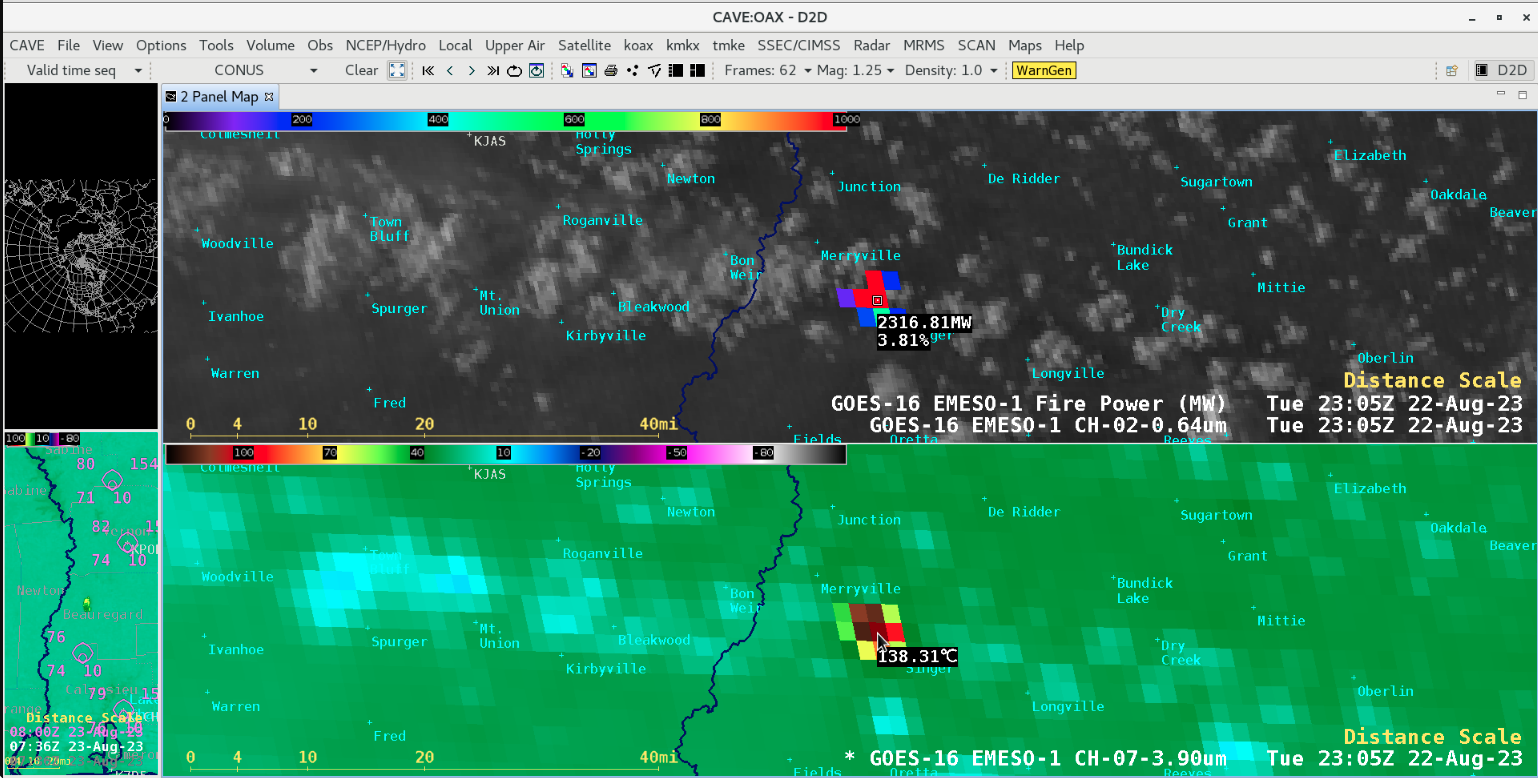
A cursor sample of GOES-16 Visible + Fire Power and Shortwave Infrared images at 2306 UTC (below) revealed that the Tiger Island Fire exhibited a maximum 3.9 µm infrared brightness temperature of 138.71ºC — which is the saturation temperature of the GOES-16 ABI Band 7 detectors) at 2306 UTC — and Fire Power values exceeded 2300 MW at times.
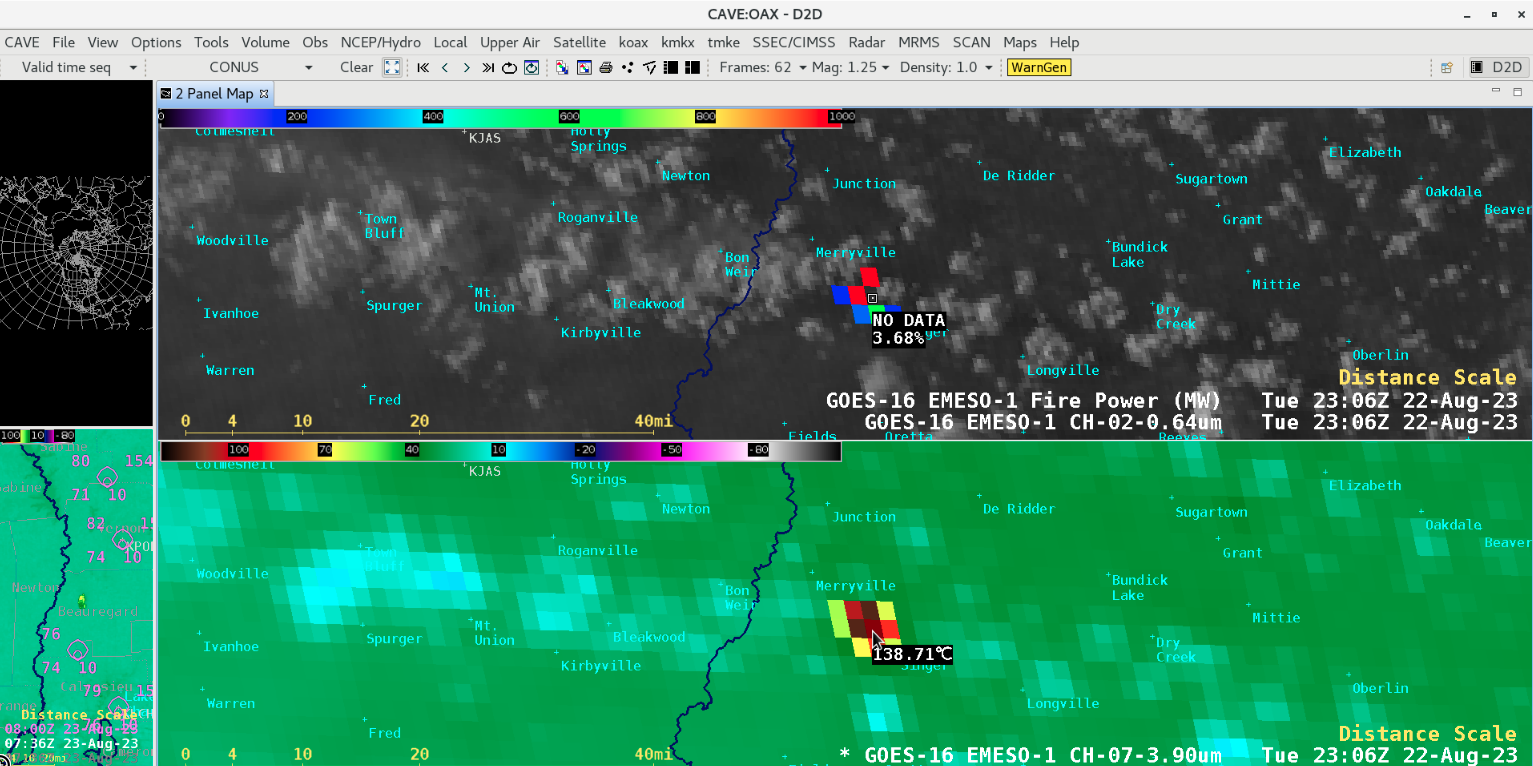
Cursor sampling of GOES-16 “Red” Visible (0.64 µm) image with an overlay of the Fire Power derived product (top) and Shortwave Infrared (3.9 µm) image (bottom) at 2306 UTC [click to enlarge]
A toggle between NOAA-20 (mis-labelled as NPP) Day/Night Band (0.7 µm) and Shortwave Infrared (3.74 µm) images valid at 0746 UTC on 23 August
(below) showed the thermal signature and nighttime glow of the wildfire.
NOAA-20 Day/Night Band (0.7 µm) and Shortwave Infrared (3.74 µm) images, valid at 0746 UTC on 23 August [click to enlarge]
GOES-14 was temporarily brought out of storage for its annual instrument testing and evaluation — which allowed a “old vs. new” comparison of this wildfire, using 15-minute GOES-14 and 1-minute GOES-16 Shortwave Infrared images
(below). The images are displayed in the native projection of each satellite.
Shortwave Infrared (3.9 µm) images from GOES-14 (left) and GOES-16 (right) [click to play animated GIF | MP4]
View only this post
Read Less


