")
First official GOES-15 10.7 µm longwave IR image (click image to enlarge)
The first official GOES-15 full disk InfraRed (IR) images became available at 17:30 UTC on 26 April 2010. The GOES-15 Imager 10.7 µm longwave IR image is shown above – similar images are available for the 0.65 µm visible channel, the 3.9 µm shortwave IR, the 6.5 µm water vapor channel, and the 13.3 µm CO2 channel.
GOES-15 was launched on 04 March 2010, with the first visible images from the Imager instrument available on 06 April and from the first visible images from the Sounder instrument on 08 April. GOES-15 will have a Post Launch Test beginning in August 2010.

GOES-15 multi-panel display of the Imager visible and IR channels
A multi-panel display showing all 5 of the GOES-15 Imager channels is shown above. For comparison purposes, a similar multi-panel display of all five of the GOES-13 Imager channels is shown below.

GOES-13 multi-panel display of the Imager visible and IR channels
===================================================

GOES-13 and GOES-15 10.7 µm longwave IR images
Some close-up comparisons of GOES-13 and GOES-15 IR images show similar results from the two satellites. The image above uses GOES-13 and GOES-15 10.7 µm longwave IR channel data to display a cluster of strong convection over the far eastern Gulf of Mexico, between Florida and Cuba — the coldest 10.7 µm IR brightness temperatures seen were 196.2 K (-77.0º C) on GOES-13, vs 194.9 K (-78.3º C) on GOES-15.
The image below is a comparison of the 13.3 µm CO2 channels. Note that the Field of View (FOV) of the 13.3 µm CO2 channel has improved from 8 km on GOES-13 to 4 km on GOES-15 — as a result, the edges of cloud features now appear much smoother on the GOES-15 13.3 µm image.

GOES-13 and GOES-15 13.3 µm CO2 channel images
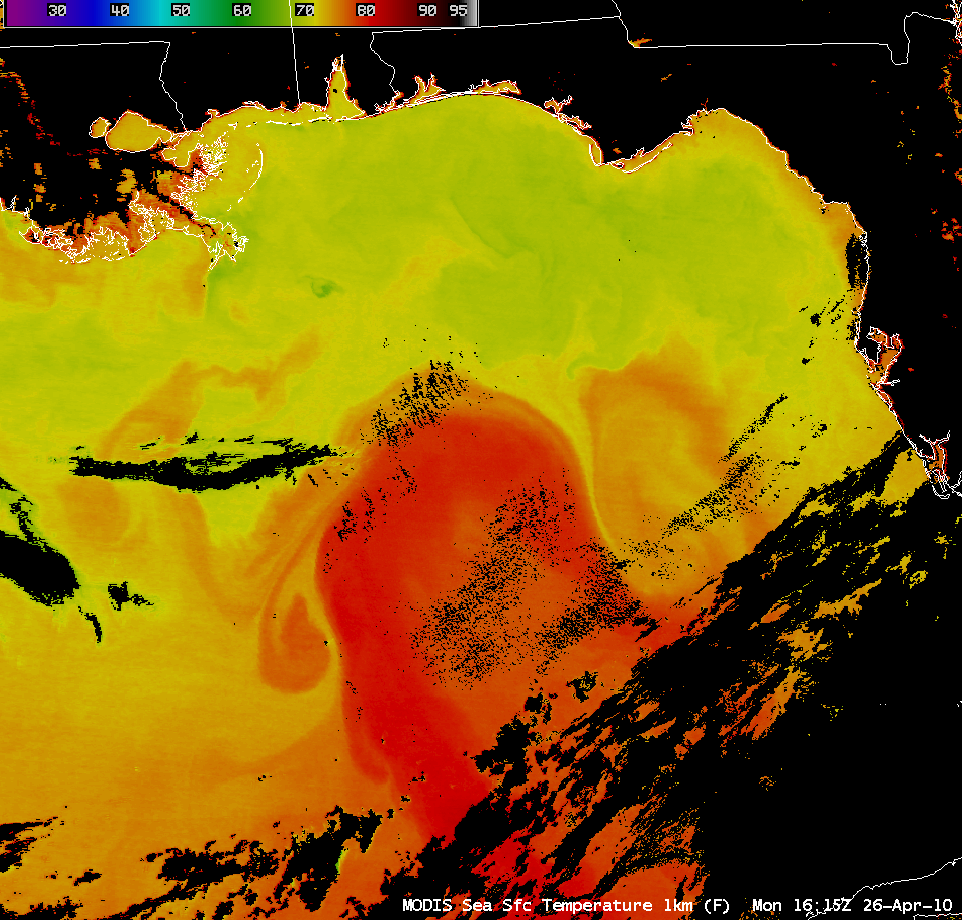
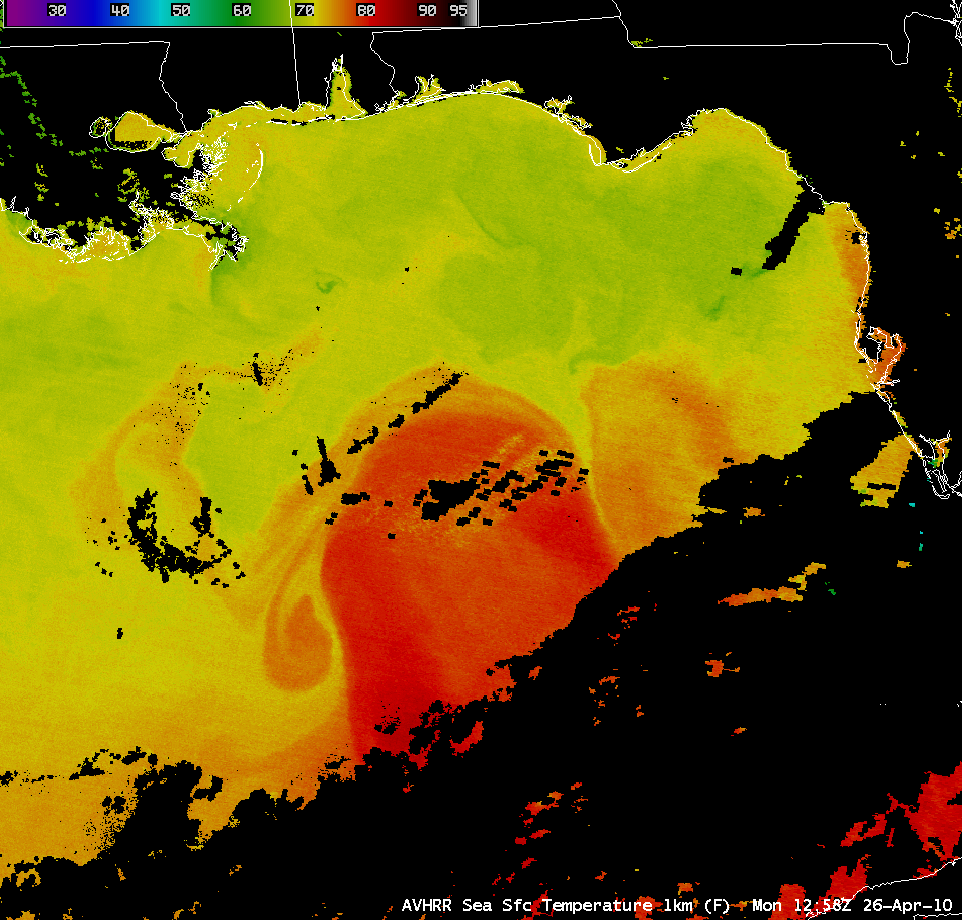
Looking farther to the west, the image below shows the Gulf of Mexico Loop Current, using the 3.9 µm shortwave IR channel data from GOES-13 and GOES-15. AWIPS images of the Sea Surface Temperature (SST) products from MODIS and AVHRR indicated that the SST values were as warm as 80º F within the Loop Current, surrounded by waters with SST values in the 70-75º F range.

GOES-13 and GOES-15 3.9 µm shortwave IR images
===================================================

GOES-13 and GOES-15 6.5 µm water vapor images
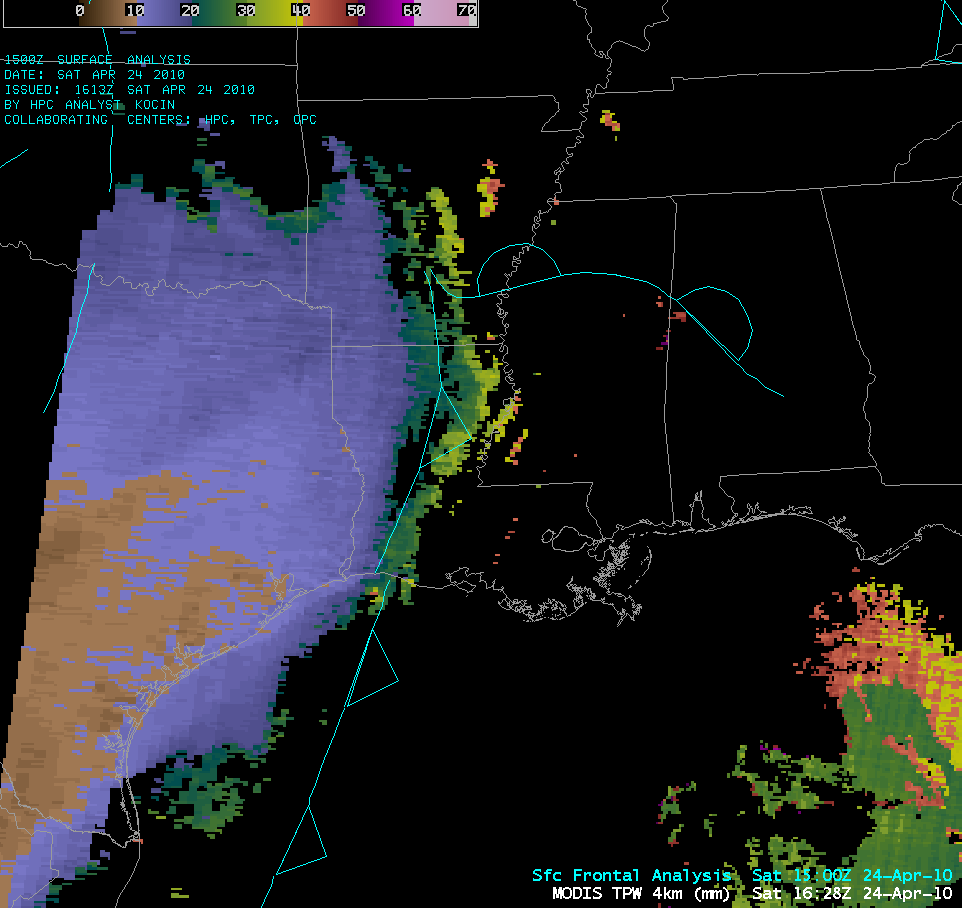
A comparison of the GOES-13 and GOES-15 6.5 µm water vapor channels (above) showed a pocket of very dry air (yellow to orange color enhancement) to the north of the aforementioned strong convection located between Florida and Cuba. This dry air was a signature of a well-defined “jet stream break”, as verified by GFS model 250 hPa wind speed isotachs (below).

GOES-13 water vapor image + GFS 250 hPa wind speed isotachs
View only this post Read Less


")


 image")
")

 products")
