
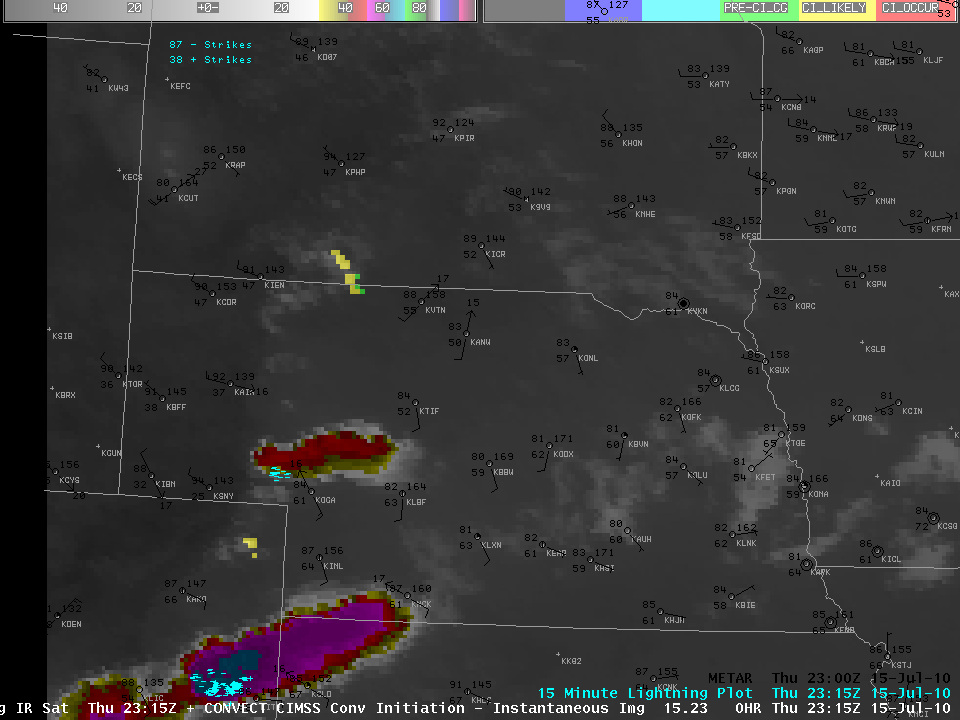
The loop above shows the window channel (11 micron) imagery from the night of 15 July over Nebraska. (Also plotted: METARS, lightning, and the UWCI product) An isolated convective storm — identified accurately by the UWCI algorithm — developed over central Nebraska near local midnight. There were no severe reports associated with this system, but it did produce considerable lightning as it moved through eastern Nebraska. What can the satellite data reveal about the environment over Nebraska?
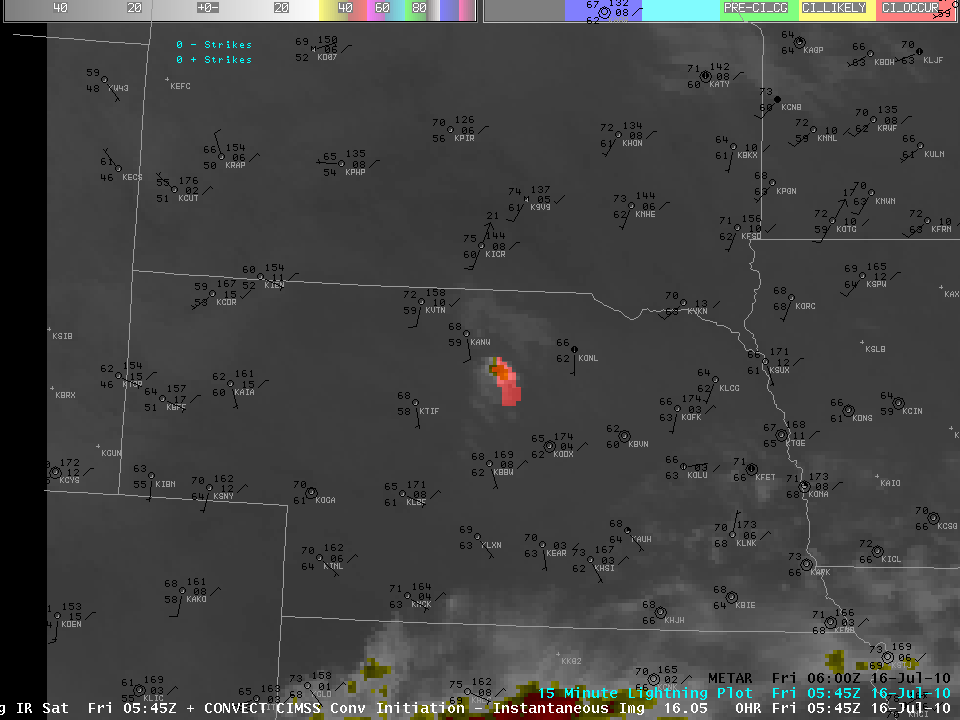
The convection that exists at the start of the loop formed near the dryline in western Nebraska. The 2315 UTC image shows a warmer surface (darker enhancement) over the Nebraska panhandle than points east. METARS shows temperatures there in the 90s, with low dewpoints, versus mid-80s and dewpoints in the 60s to the east. The dry air cools more rapidly, so that the panhandle shows a cooler surface (lighter enhancement) by 0315 UTC. Satellite data suggests that the dryline is not moving east, and forcing associated with it does not cause the convection over central Nebraska.
The CIMSS Nearcast product uses a Lagrangian model to describe the evolution of equivalent potential temperature at two levels in the atmosphere. Retrievals from the GOES Sounder are used to produce the moisture fields that are input into this model. Forecasts for 0600 UTC of the change of equivalent potential temperature from about 800 mb to about 500 mb, near the time of convective onset (Here is the IR Imagery from that time), are shown below as a loop of 5 forecasts — initial times from 00 UTC to 04 UTC — each valid at 0600 UTC. Note how the region of interest is well-highlighted, and is narrowing with time. The low-level equivalent potential temperature is 15-20 K warmer than the mid-level value.

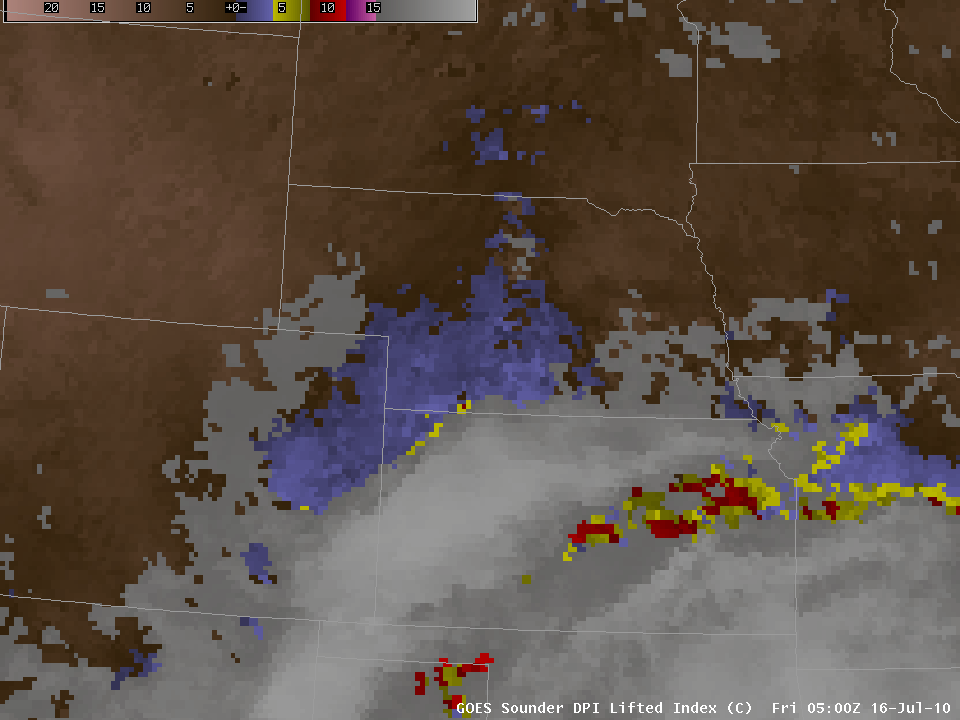
GOES Sounder Lifted Index shows a tongue of lower values of Lifted Index through central Nebraska at 0500 UTC. The axis of minimum stability as denoted by the Lifted Index matches the prediction from the Nearcast product very nicely. Given this potential instability, is there anything that suggests a trigger mechanism? The surface METARS, plotted over the IR imagery shown at the top of this post, do not suggest any propagating boundary.

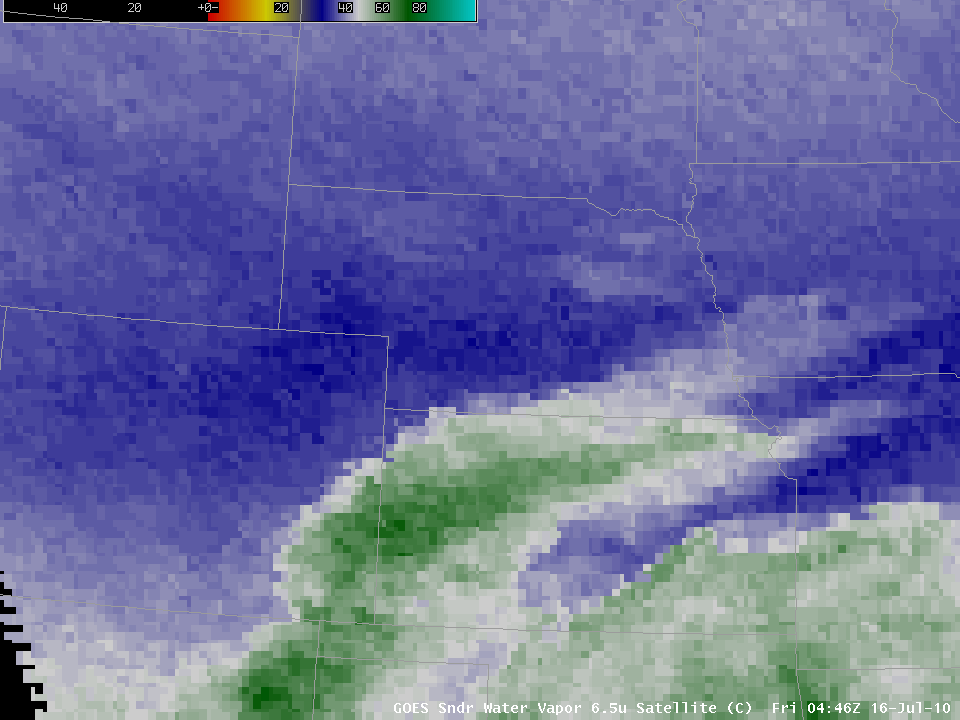
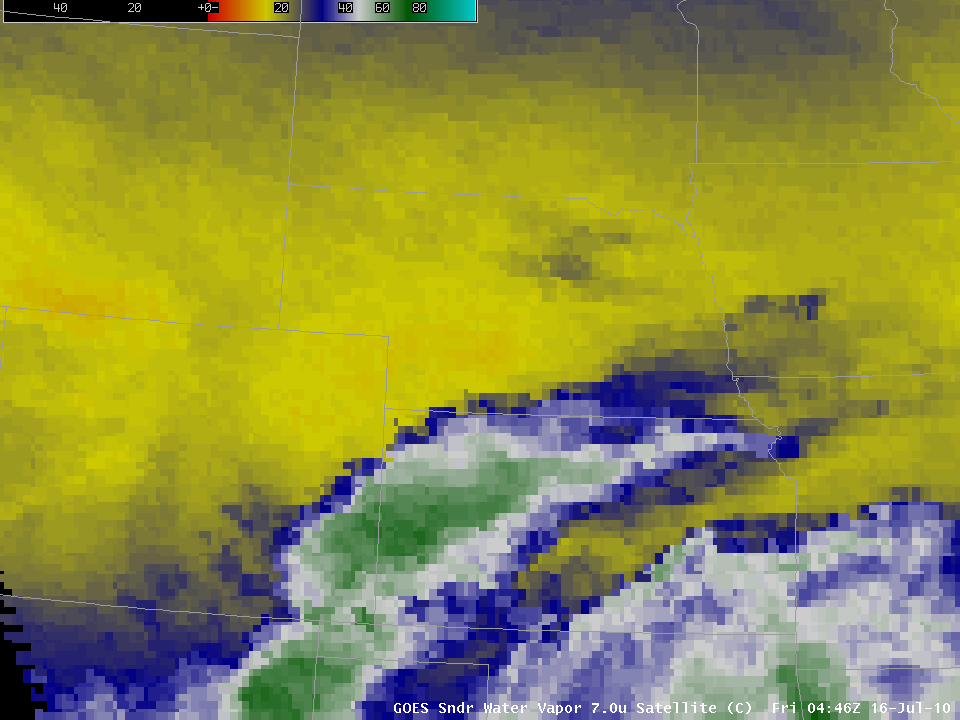
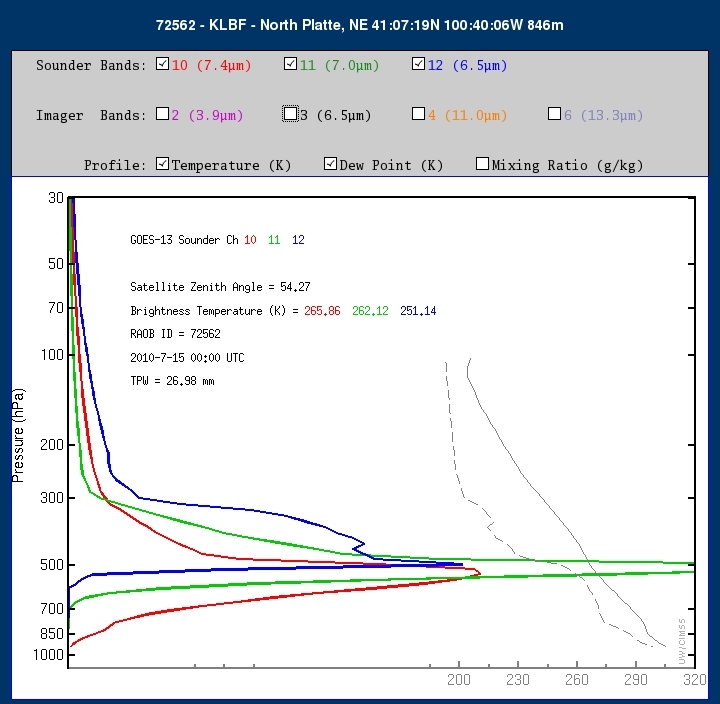
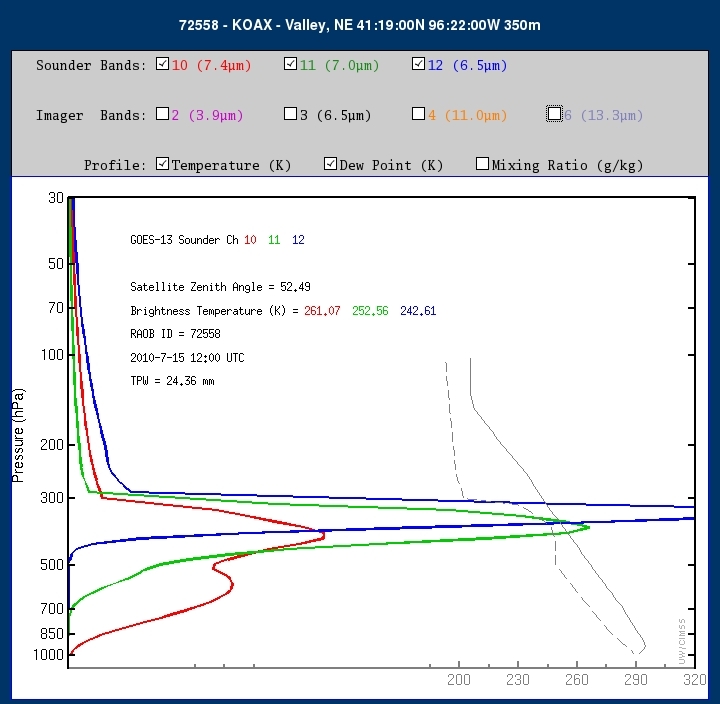
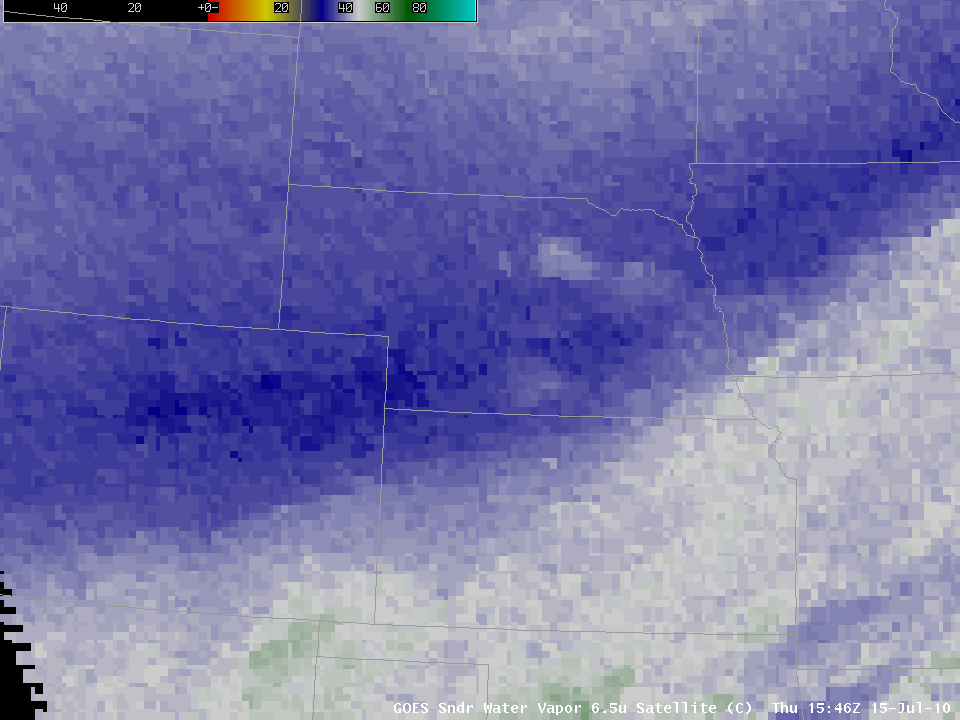
The GOES Imager Water Vapor loop, shown above, does not suggest a clear forcing mechanism for the observed convection. GOES Sounder water vapor, however, is available at three levels, rather than the one level of the GOES Imager. (The ABI on GOES-R will also include 3 water vapor channels that sample different parts of the atmosphere). Although the images at ~0500 UTC from 6.5 microns shows little in the way of forcing (the water vapor channel on the imager is also centered near 6.5 microns), the 7.0 microns and the 7.4-micron image both show a stronger gradient in water vapor near where the convection developed. This suggests that the forcing mechanism for the convection was closer to the surface than could be detected using the 6.5-micron channel on either the imager or the sounder. Weighting functions for the sounder channels (produced at this website computed at North Platte, NE at 00 UTC on 15 July (upstream of the region of convection), and at Valley, NE at 12 UTC on 15 July (downstream of the region of convection) show that the peak response for the 7.0 and especially the 7.4 micron channels is lower in the atmosphere than the peak response for the 6.5 micron channel. (Data from these weighting functions can guide you to search the correct horizontal level in the atmosphere to find the forcing that is causing convection) Thus, while a loop of the sounder 6.5-micron water vapor data shows little to suggest why the convection develops where it does (as expected, given that the sounder 6.5-micron data should show similar features (albeit at coarser sounder resolution) compared to the imager 6.5-micron data shown above), the loop of 7.0-micron sounder water vapor data is a bit more suggestive of a forcing mechanism, and the loop 7.4-micron sounder water vapor, shown below, most definitely shows a boundary that is associated with the convection that develops over central Nebraska. Detection of water vapor distributions at different levels can be key to understanding why convection forms where it does.

View only this post Read Less

 image")


 images")


