A large Mesoscale Convective System (MCS) developed over far northeastern Oklahoma during the pre-dawn hours on 04 June 2012, which eventually produced a Mesoscale Convective Vortex (MCV) that moved into northwestern Arkansas the following morning. AWIPS images of 4-km resolution GOES-13 10.7 µm... Read More
")
GOES-13 10.7 µm IR images + 0.63 µm visible images (click image to play animation)
A large Mesoscale Convective System (MCS) developed over far northeastern Oklahoma during the pre-dawn hours on 04 June 2012, which eventually produced a Mesoscale Convective Vortex (MCV) that moved into northwestern Arkansas the following morning. AWIPS images of 4-km resolution GOES-13 10.7 µm IR images (at night) followed by 1-km resolution GOES-13 0.63 µm visible channel images during the day (above) showed the large nocturnal canopy of cold clouds (with cloud-top IR brightness temperatures as cold as -76º C at 05:01 UTC) — then the dissipating convection revealed the cyclonic circulation of the MCV during the late morning hours. As the atmosphere destabilized with daytime heating, new thunderstorms were seen to develop in the vicinity of the MCV as it moved toward Little Rock, Arkansas (station identifier KLIT).
A comparison of a 1-km resolution MODIS 11.0 µm IR image with the corresponding 4-km resolution GOES-13 10.7 µm IR image at 08:15 UTC or 3:15 AM local time (below) demonstrated that finer-scale cloud top details (such as subtle anvil-top gravity waves) were apparent on the higher resolution MODIS image. Note that the satellite features are displaced slightly to the northwest on the GOES-13 IR images — this is due to parallax error resulting from the large viewing angle from the GOES-East satellite.

MODIS 11.0 µm IR image + GOES-13 10.7 µm IR image
These anvil-top gravity waves were even more evident on a comparison of 1-km resolution Suomi NPP VIIRS 11.45 µm IR channel and 0.7 µm Day/Night Band (DNB) images at 08:42 UTC or 3:42 AM local time (below). A full moon provided excellent illumination of the thunderstorm cloud top, allowing an very good night-time view of the subtle overshooting top and gravity wave structures (just as they might be seen on a daytime visible image). In addition, note that the city lights of the Wichita, Kansas area could be seen through the thin veil of cloud top cirrus along the northwestern edge of the storm.

Suomi NPP VIIRS 11.45 µm IR channel + 0.7 µm Day/Night Band images
As the MCV was approaching the Little Rock area, the CIMSS Cloud Top Cooling Rate product detected CTC rates in excess of 20º C per 15 minutes, just as the thunderstorms began to produce their first cloud-to-ground lightning strike at 17:45 UTC (below). This cluster of thunderstorms was responsible for a few reports of hail and damaging winds as it continued to move southeastward across Arkansas during the afternoon hours (SPC storm reports).

GOES-13 0.63 µm visible images + Cloud Top Cooling Rate + Cloud-to-ground lightning strikes
===============================
")
GOES-13/GOES-15 Sounder DPI Total Precipitable Water (click image to play animation)
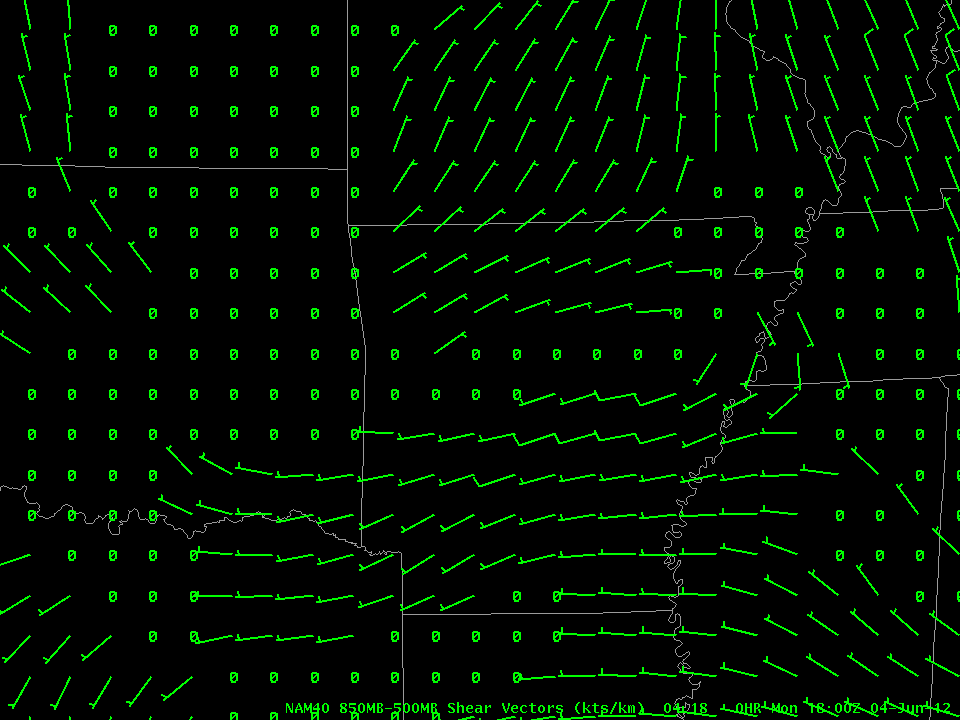
MCVs typically are sustained in regions of low shear and abundant moisture. A plot of 850-500 mb shear from the NAM for 1800 UTC on 4 June show very low values of vertical wind shear in place over Arkansas. GOES Sounder DPI Total Precipitable water (the loop above) shows that the MCV developed in an axis of enhanced moisture. The blended TPW product (a product that blends together GOES Sounder and GPS measurements of precipitable water) shows an axis of values at or above 100% of normal through the mid-south where the MCV formed.
A visible image loop (every half-hour) from June 4 2012 that shows the evolution of the system is below.
")
GOES-13 0.63 µm Visible Imagery (click image to play animation)
View only this post
Read Less

")
")
")
")
 and GOES-13 (right) 0.63 µm visible images (click image to play animation)")

")
")
