This website works best with a newer web browser such as Chrome, Firefox, Safari or Microsoft
Edge. Internet Explorer is not supported by this website.
GOES-16 Day Cloud Phase Distinction RGB imagery at 1801 UTC on 6 January 2025, above, show evidence (in greenish yellow) of a glaciated band of cloudiness that is a Lake Effect snow band that deposited from 3-6″ over extreme southeast Wisconsin, in Kenosha and Racine counties. The toggle with the radar emphasizes how Day... Read More
GOES-16 Day Cloud Phase Distinction and Composite Reflectivity, 1801 UTC on 6 January 2025 (Click to enlarge)
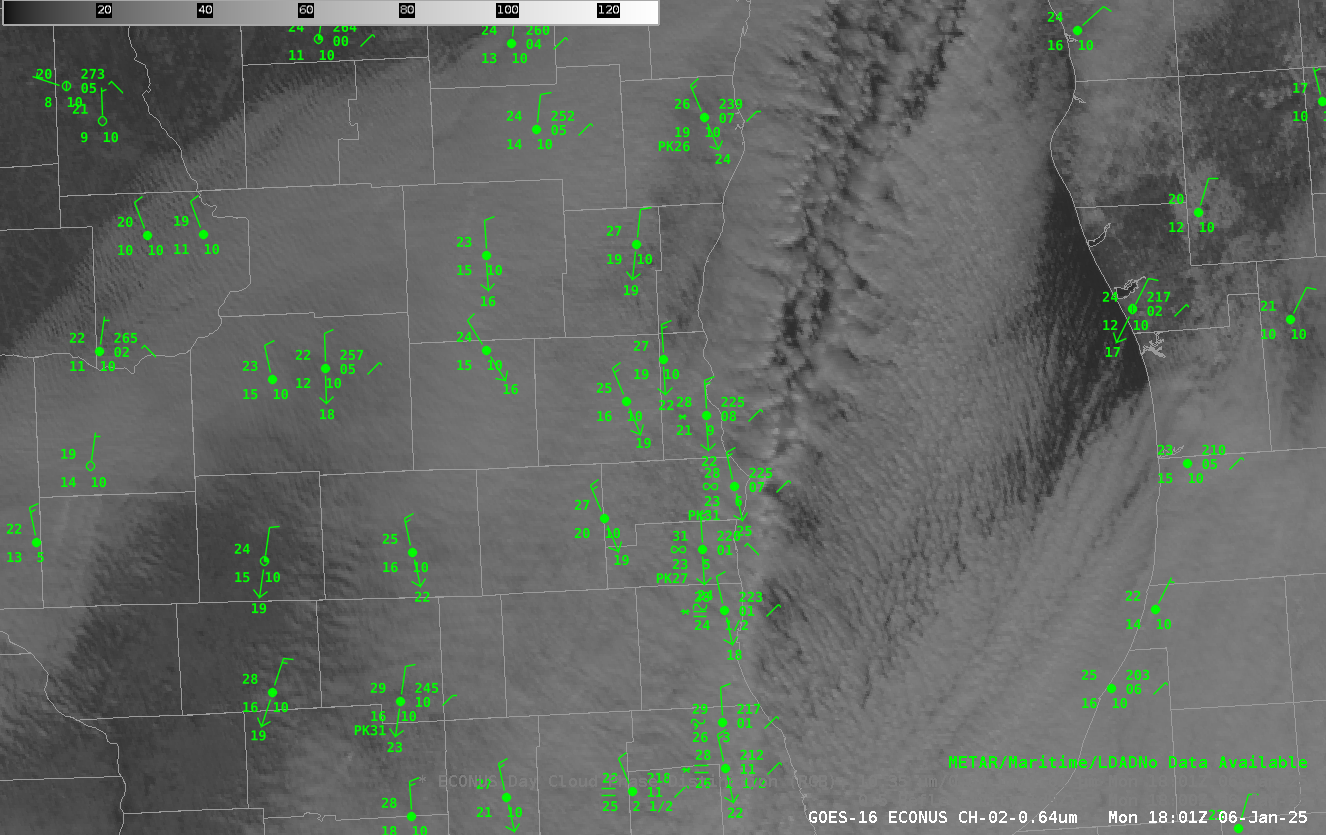
GOES-16 Day Cloud Phase Distinction RGB imagery at 1801 UTC on 6 January 2025, above, show evidence (in greenish yellow) of a glaciated band of cloudiness that is a Lake Effect snow band that deposited from 3-6″ over extreme southeast Wisconsin, in Kenosha and Racine counties. The toggle with the radar emphasizes how Day Cloud Phase Distinction can be used (in daytime) to highlight precipitating lake-effect snow bands. Visible imagery at the same time is shown below. The character of the precipitating clouds is different, and that might help you identify the precipitating clouds from the non-precipitating ones.
GOES-16 Band 2 Visible (0.64 µm) imagery, 1801 UTC on 6 January 2025 (Click to enlarge)
The use of Day Cloud Phase Distinction to highlight precipitating clouds has been discussed before on this blog, here and here and here, for example.
Hourly GOES-18 infrared imagery (10.3 µm), above, shows the development of strong convection to the south of the Samoan Islands during the morning hours of 6 January (on American Samoa) or 7 January (Independent Samoa). Is this the start of a tropical system? Total Precipitable Water (MIMIC TPW) imagery from microwave data,... Read More
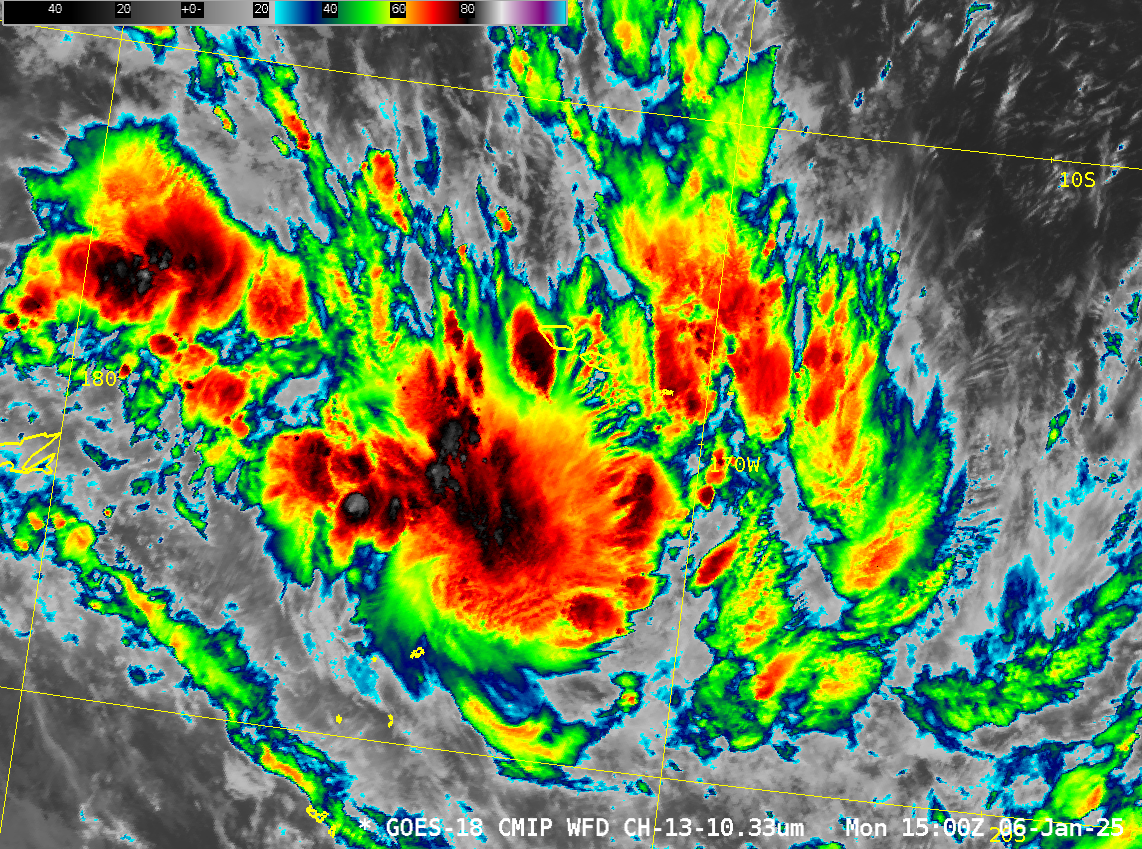
GOES-18 Clean Window infrared (Band 13, 10.3 µm) imagery, 0000 UTC on 5 January 2025 through 1500 UTC 6 January 2025 (Click to enlarge)
Hourly GOES-18 infrared imagery (10.3 µm), above, shows the development of strong convection to the south of the Samoan Islands during the morning hours of 6 January (on American Samoa) or 7 January (Independent Samoa). Is this the start of a tropical system? Total Precipitable Water (MIMIC TPW) imagery from microwave data, below (TPW estimates from GOES-18 require clear skies that aren’t occurring during this time in the domain shown), show the rich moisture of the South Pacific Convergence Zone sagging south through the Samoan Islands. GFS model winds that are used to construct hourly MIMIC TPW fields suggest, perhaps, the beginnings of a cyclone circulation as well.
MIMIC Total Precipitable Water estimates, 1500 UTC 5 January – 1400 UTC 6 January 2025 (Click to enlarge)
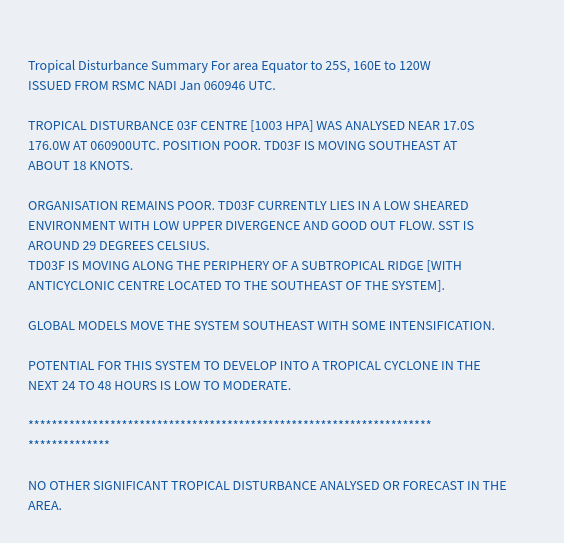
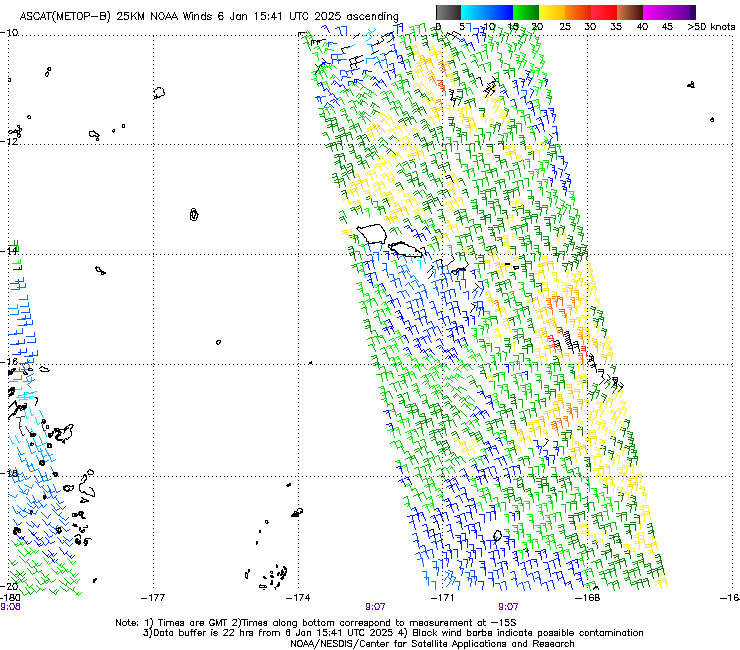
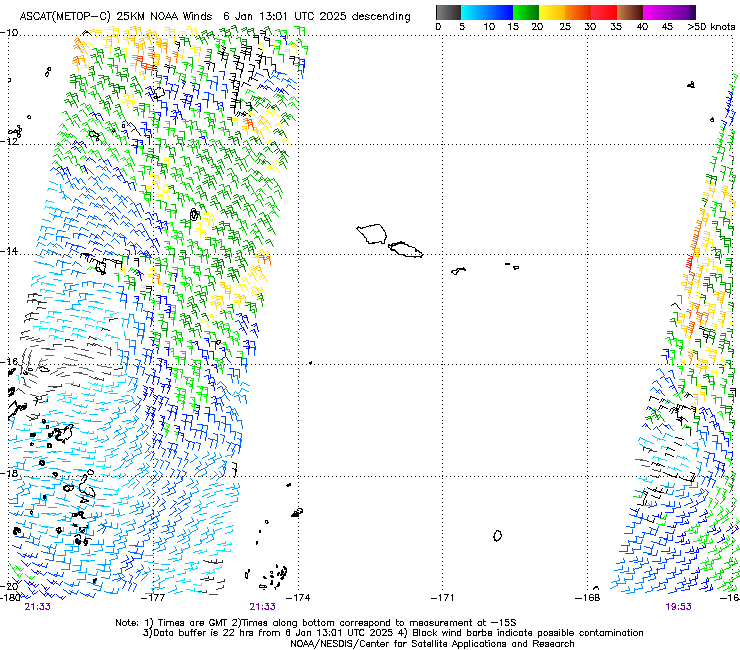
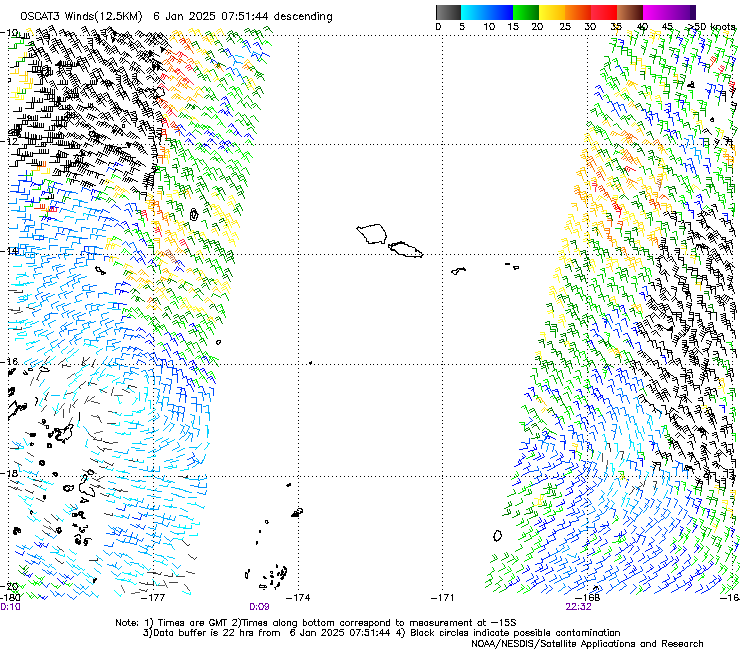
Scatterometry winds can be used to determine the presence of a low-level circulation center. The plots below, from this site, show MetopB / MetopC / OSCAT3 scatterometry for 05/06 January. The challenge, as always is that overpasses miss: the final MetopB overpass in the animation, for example, misses the circulation entirely. It is sampled, however, by MetopB, MetopC and OSCAT3 between 2000 and 0000 UTC on 5/6 January when the circulation was near 178oW, 16oS.
Scatterometry over the South Pacific from Matop B (20238 UTC), MetopC (2133 UTC) on 5 january and from OSCAT3 (0010 UTC), MetopB (0907 UTC) and MetopC (1004 UTC) on 6 January 2024 (Click to enlarge)
Tropical Disturbance Summary from Fiji RSMC, 0900 UTC on 6 January 2024 (Click to enlarge)
Although SSTs are warm, the region of favorable deep layer shear (shown below from 0000 UTC and 1200 UTC 6 January 2024 from this source) is very narrow, and it shrinks during the 12 hours shown.
Deep Layer Shear (850-200 mb) at 0000 UTC (left) and 1200 UTC (right), 6 january 2024 (Click to enlarge)
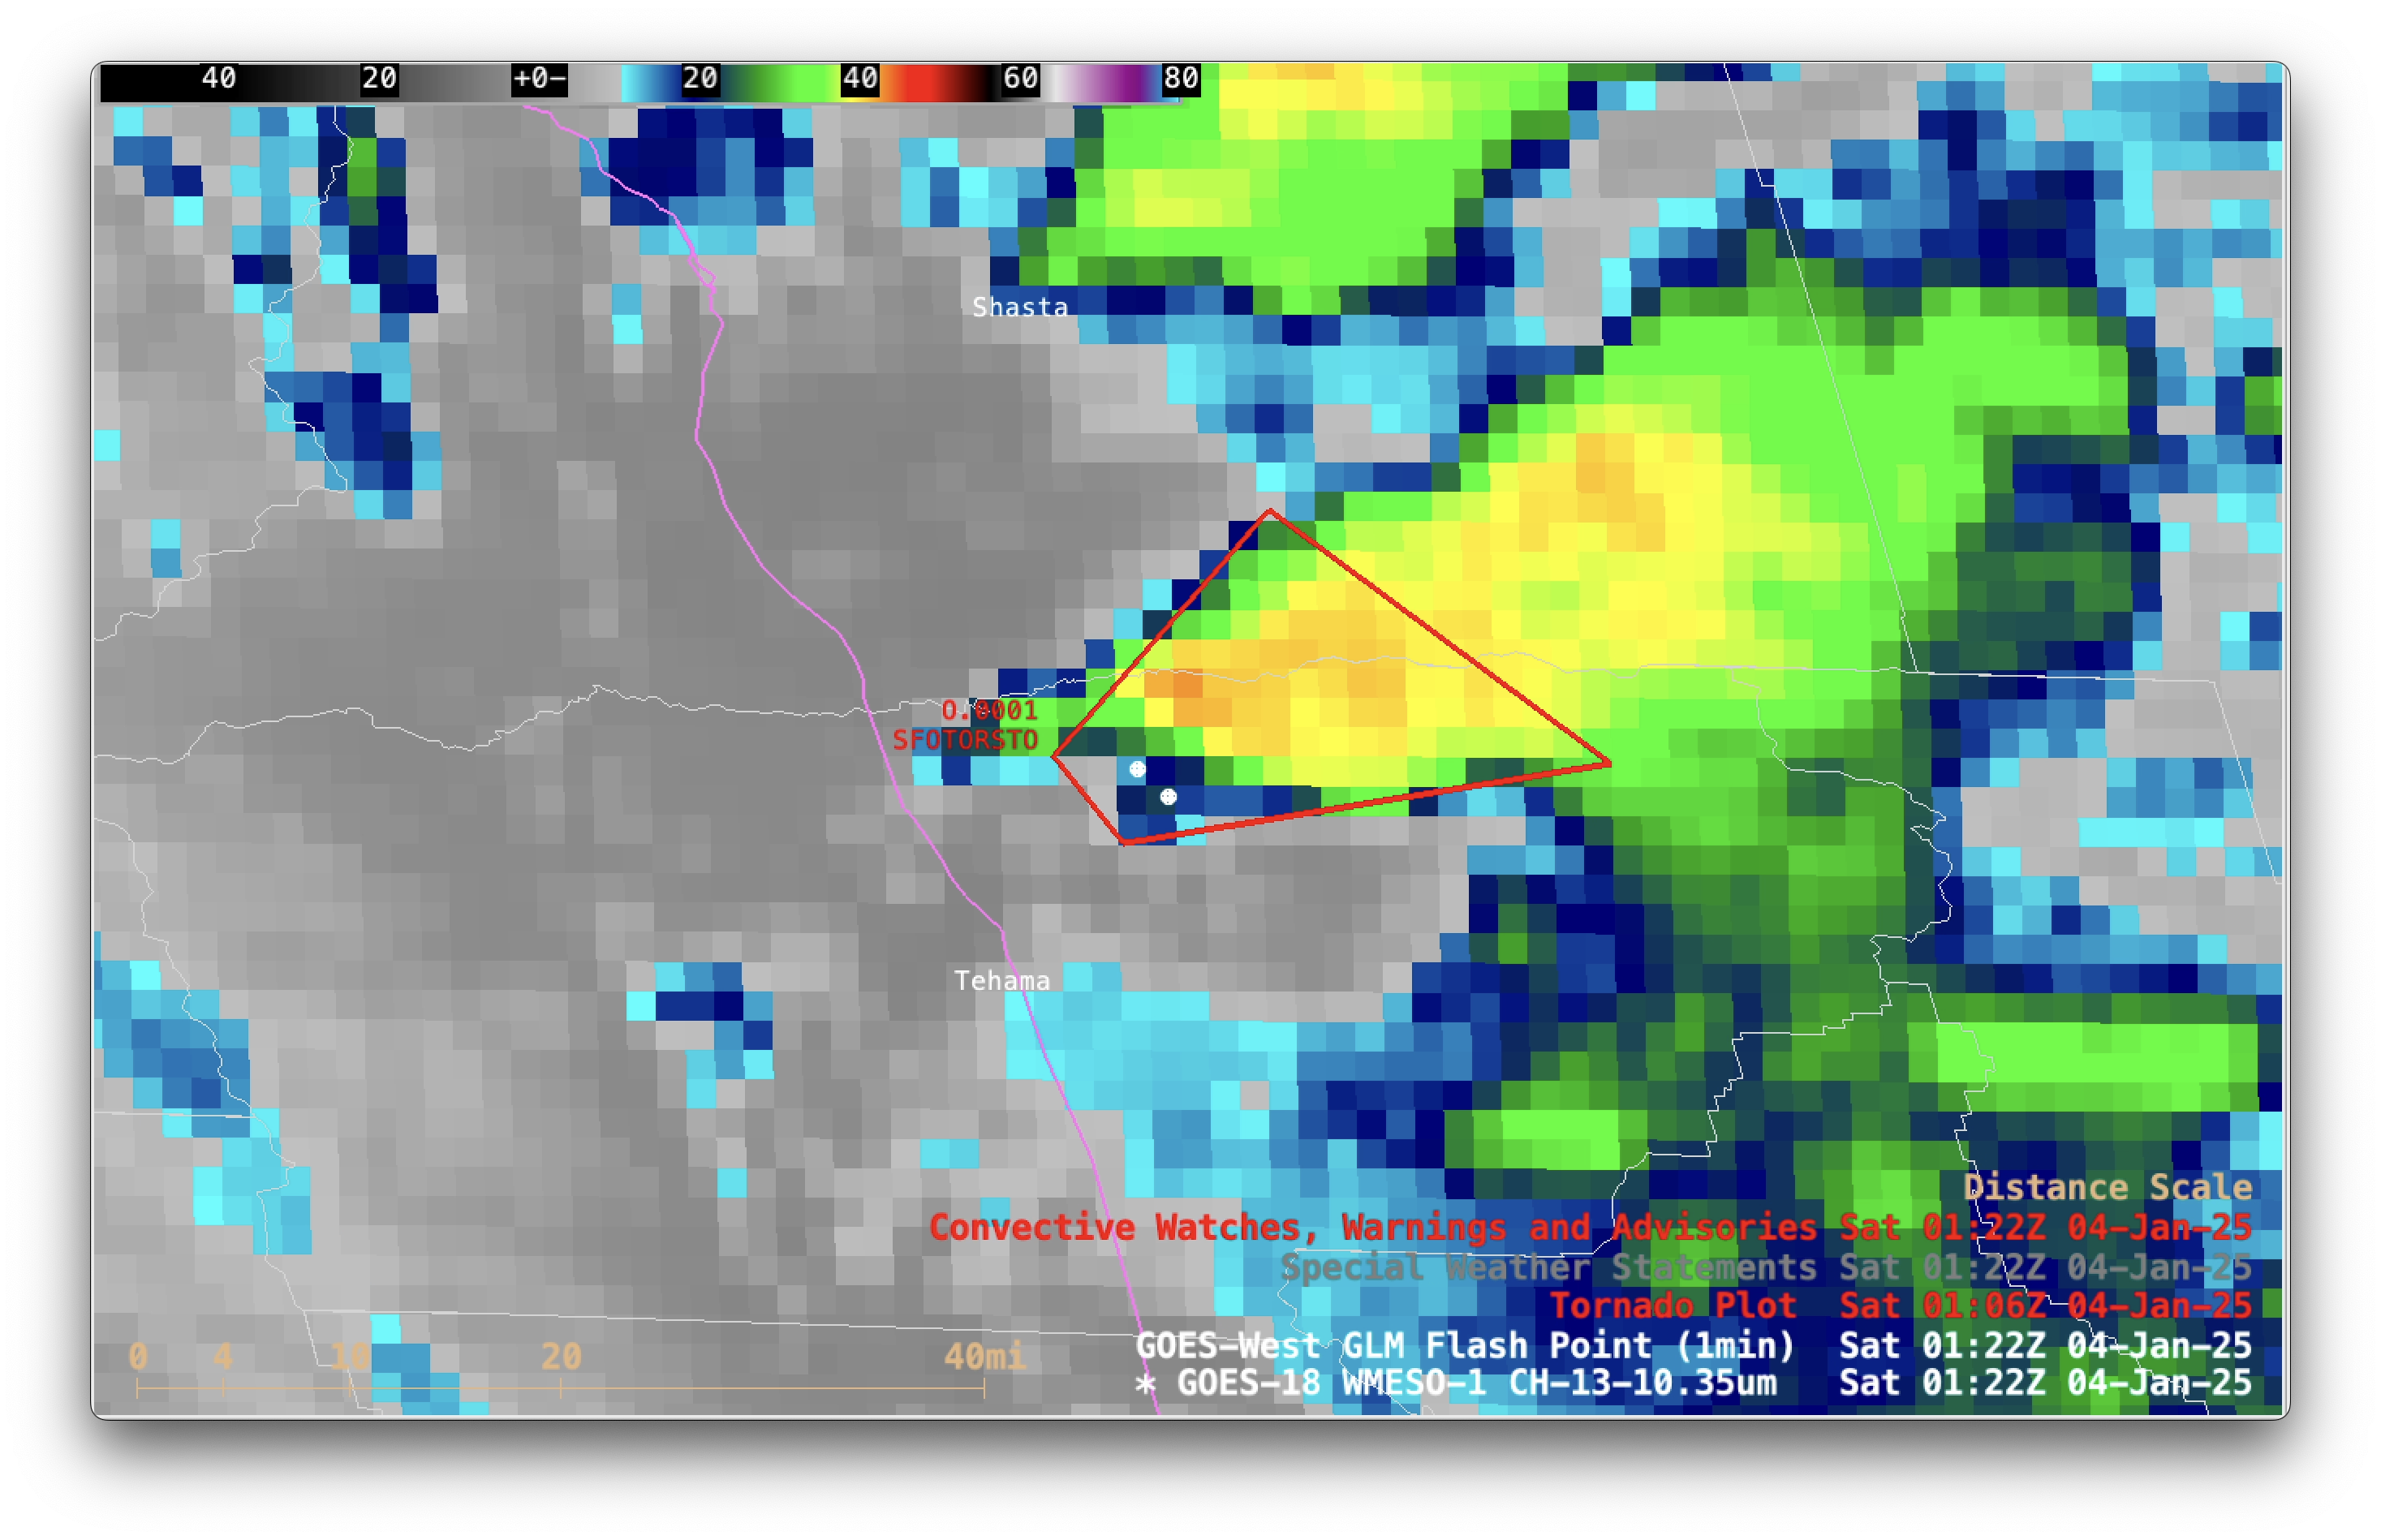
1-minute Mesoscale Domain Sector GOES-18 (GOES-West) Clean Infrared Window images (above) showed the thunderstorm that produced a EF-U rated tornado just east of Interstate 5 in northern Tehama County, California late in the day on 3rd January 2025 (this was the first verified tornado in the US for 2025). Cloud-top 10.3 µm infrared brightness... Read More
1-minute GOES-18 Clean Infrared Window (10.3 µm) images with plots of 1-minute GLM Flash Points (white), Tornado Warning polygon (red) and Tornado report location (red T), from 0100-0200 UTC on 4th January; Interstate 5 is plotted in violet [click to play MP4 animation]
1-minute Mesoscale Domain Sector GOES-18 (GOES-West) Clean Infrared Window images (above) showed the thunderstorm that produced a EF-U rated tornado just east of Interstate 5 in northern Tehama County, California late in the day on 3rd January 2025 (this was the first verified tornado in the US for 2025). Cloud-top 10.3 µm infrared brightness temperatures of that particular thunderstorm cooled to the -40 to -42ºC range (darker shades of orange) beginning at 0101 UTC — and GLM-detected lightning activity began at 0108 UTC, reaching a peak at 0126 UTC.
A plot of rawinsonde data from Oakland, California at 0000 UTC (below) indicated that air temperatures of -40 to -42ºC were present at a pressure level of ~300 hPa (or an altitude ~9.2 km).
Plot of rawinsonde data from Oakland, California at 0000 UTC on 4th January [click to enlarge]
Tornado Warning in effect through 6 PM PST, includes the cities of Shingletown, Manton and Paynes Creek with quarter size hail. Take shelter now! #CAwxpic.twitter.com/cYkAJLahFw
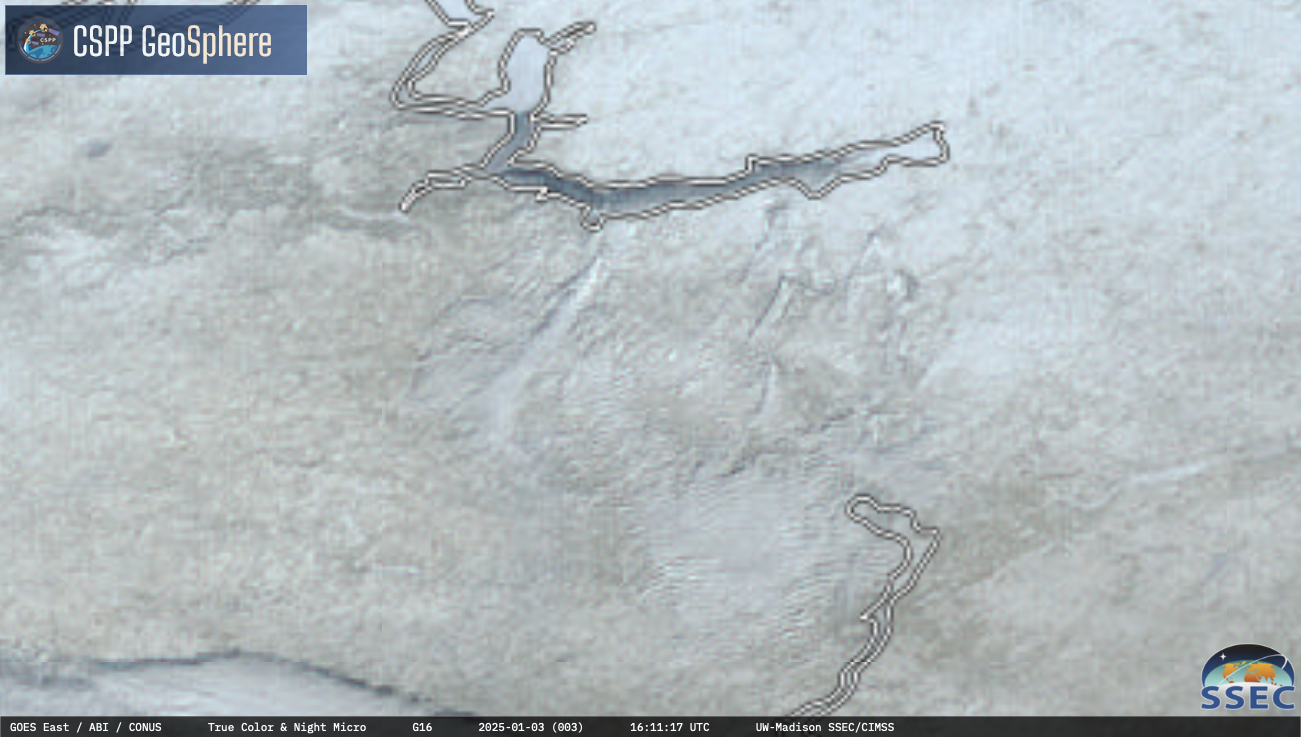
5-minute CONUS Sector GOES-16 (GOES-East) Nighttime Microphysics RGB + daytime True Color RGB images from the CSPP GeoSphere site (above) showed several power plant condensation plumes south of Lake Sakakawea in western North Dakota on 3rd January 2025.GOES-16 Near-Infrared Snow/Ice (1.61 µm) and Day Fog (3.9-10.3 µm) brightness temperature difference images (below) suggested that particulate... Read More
GOES-16 Nighttime Microphysics RGB + daytime True Color RGB images, from 1151-2201 UTC on 3rd January [click to play MP4 animation]
5-minute CONUS Sector GOES-16 (GOES-East)Nighttime Microphysics RGB + daytime True Color RGB images from the CSPP GeoSphere site (above) showed several power plant condensation plumes south of Lake Sakakawea in western North Dakota on 3rd January 2025.
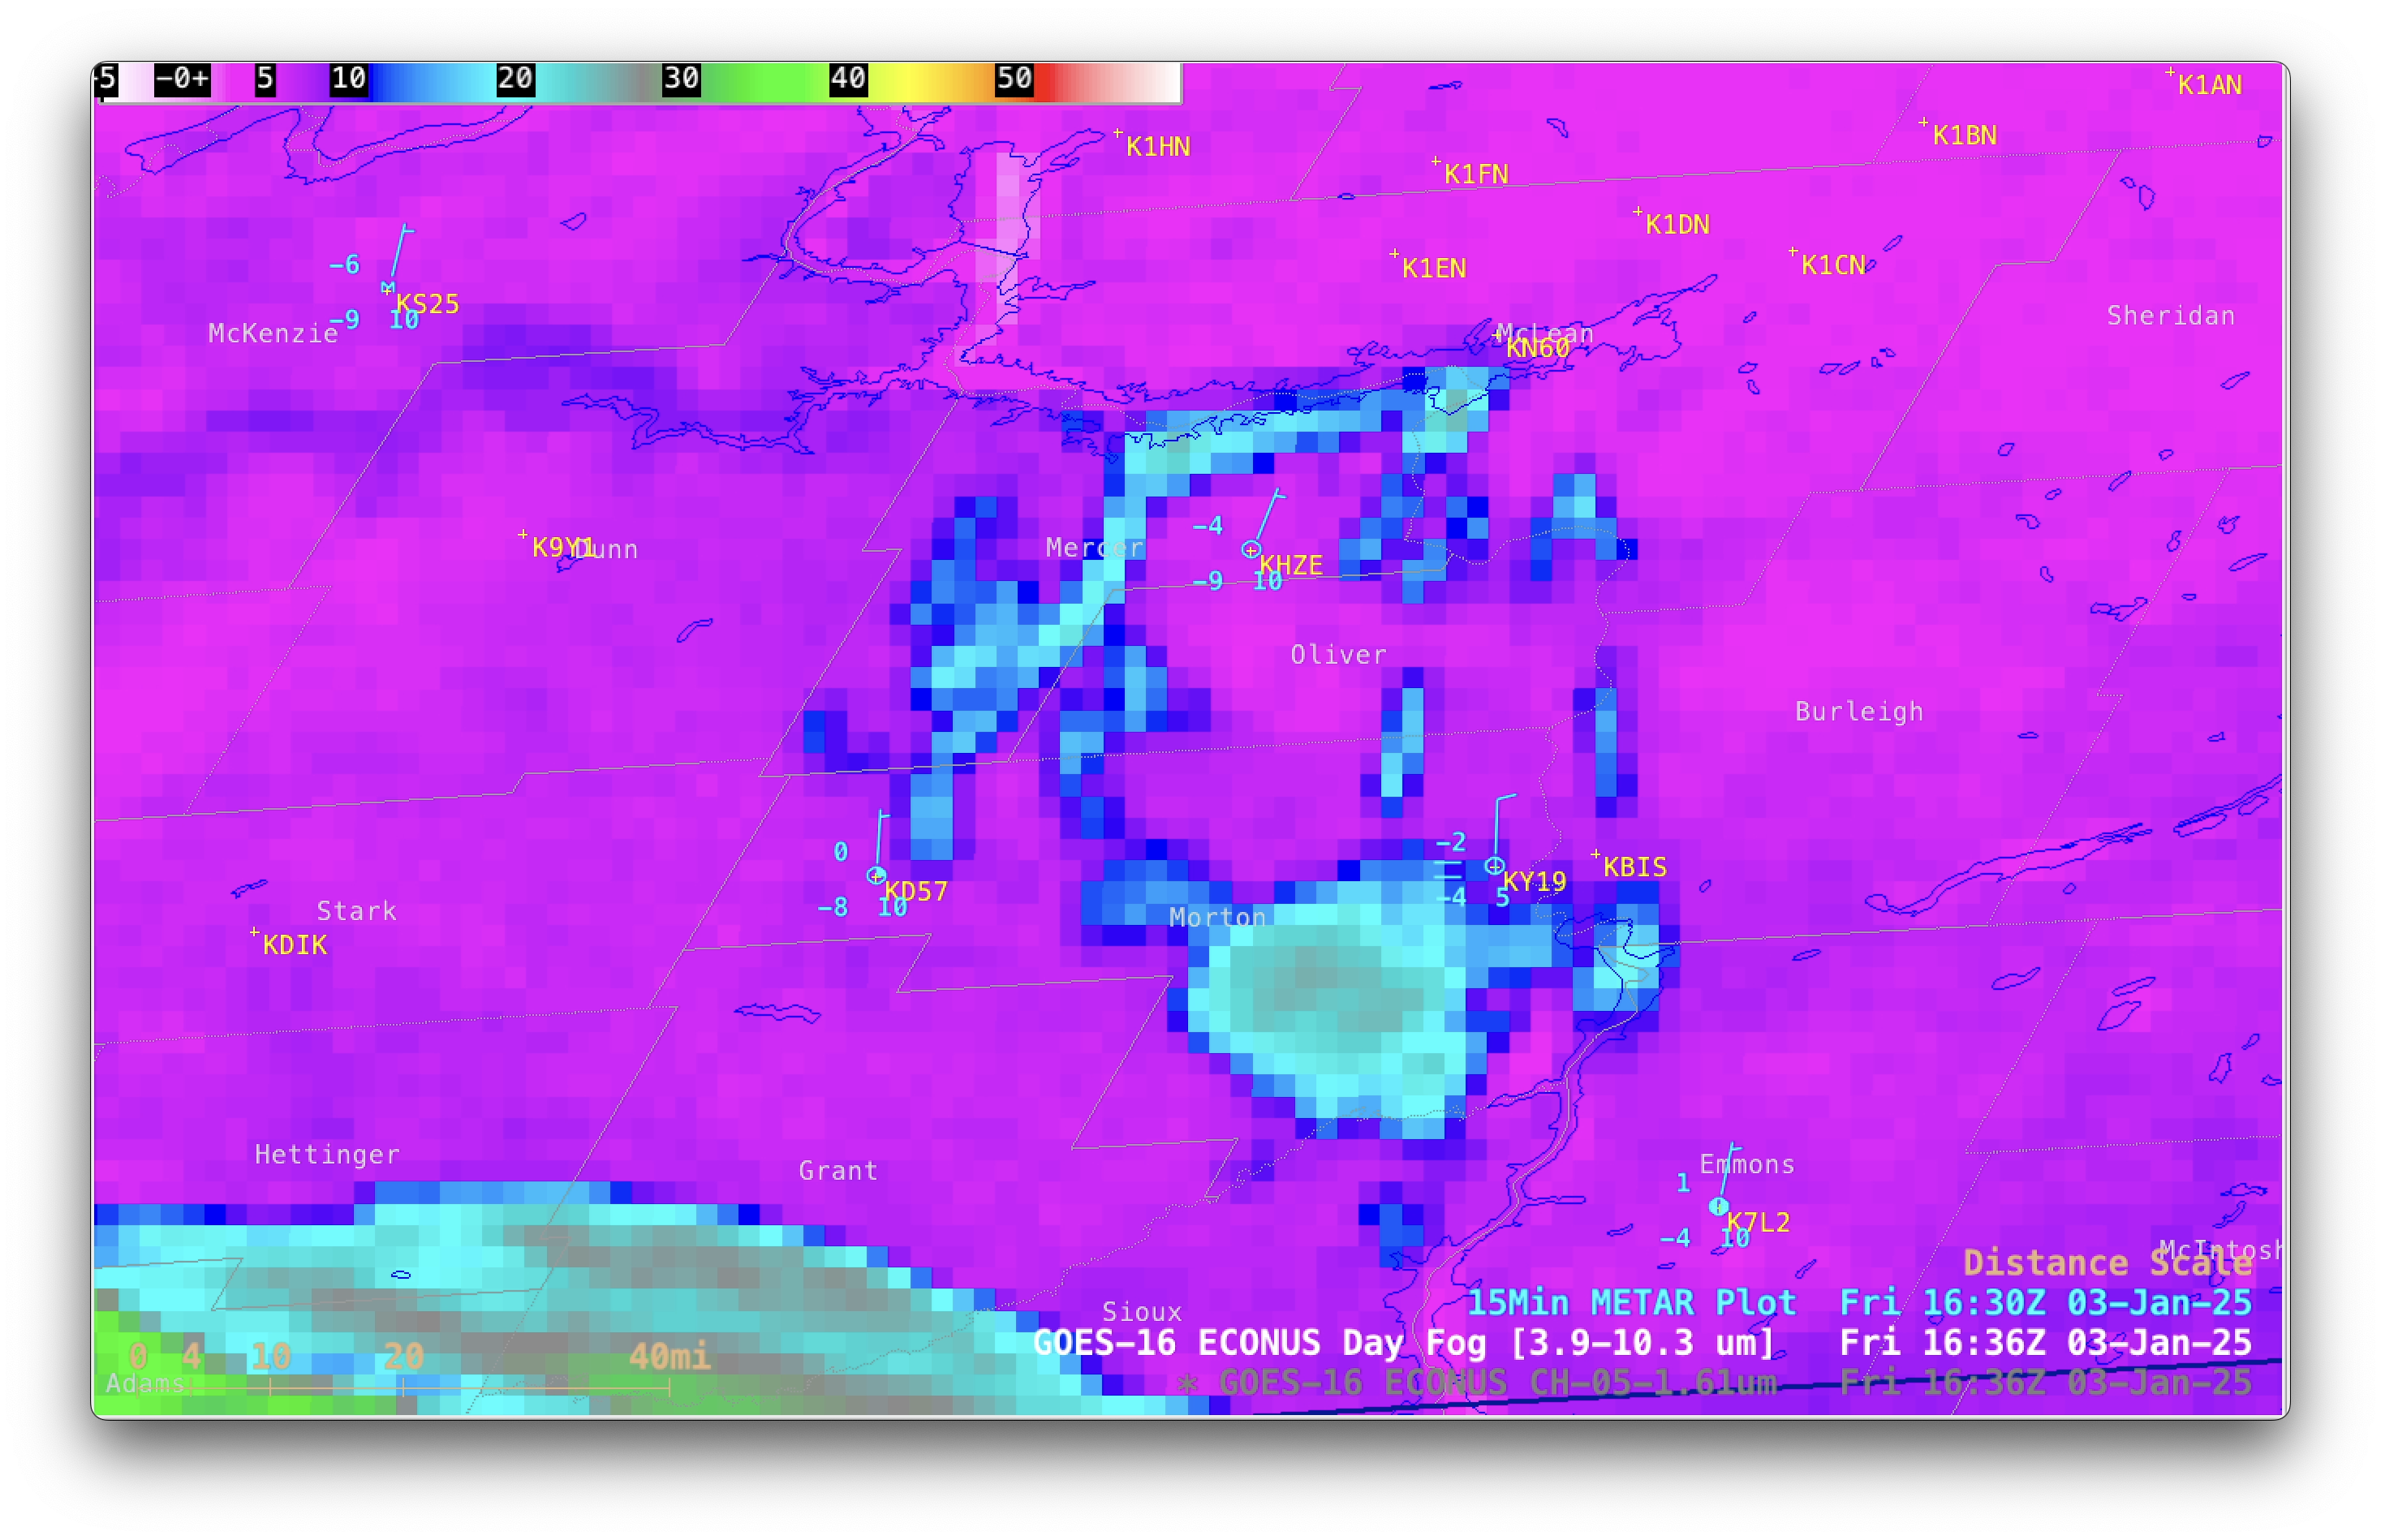
GOES-16 Near-Infrared Snow/Ice (1.61 µm) and Day Fog (3.9-10.3 µm) brightness temperature difference images (below) suggested that particulate matter within these power plant plumes (originating from plants in Mercer, Oliver and McLean counties) may have acted to seed a patch of supercooled water droplet clouds, causing them to glaciate and produce a brief period of light snow at Mandan (KY19) — and perhaps create enough ice crystals in the air to reduce visibility at Glen Ullin (KD57).
GOES-16 Near-Infrared Snow/Ice (1.61 µm) and Day Fog (3.9-10.3 µm) images with 15-minute METAR surface reports plotted in cyan, from 1501-1901 UTC on 3rd January [click to play MP4 animation]
GOES-19 (Preliminary/Non-operational) True Color RGB images and Blowing Snow RGB images created using Geo2Grid(below) displayed the power plant plumes from a different perspective (GOES-19 is positioned over the Equator at 89.5°W longitude during its post-launch testing, compared to the position of GOES-16 at 75.2°W longitude). Some lake effect clouds could also be seen streaming southward, immediately downwind of the ice-free portions of Lake Sakakawea.
GOES-19 (Preliminary/Non-operational) True Color RGB images (left) and Blowing Snow RGB images (right), from 1501-2201 UTC on 3rd January [click to play animated GIF | MP4]


