
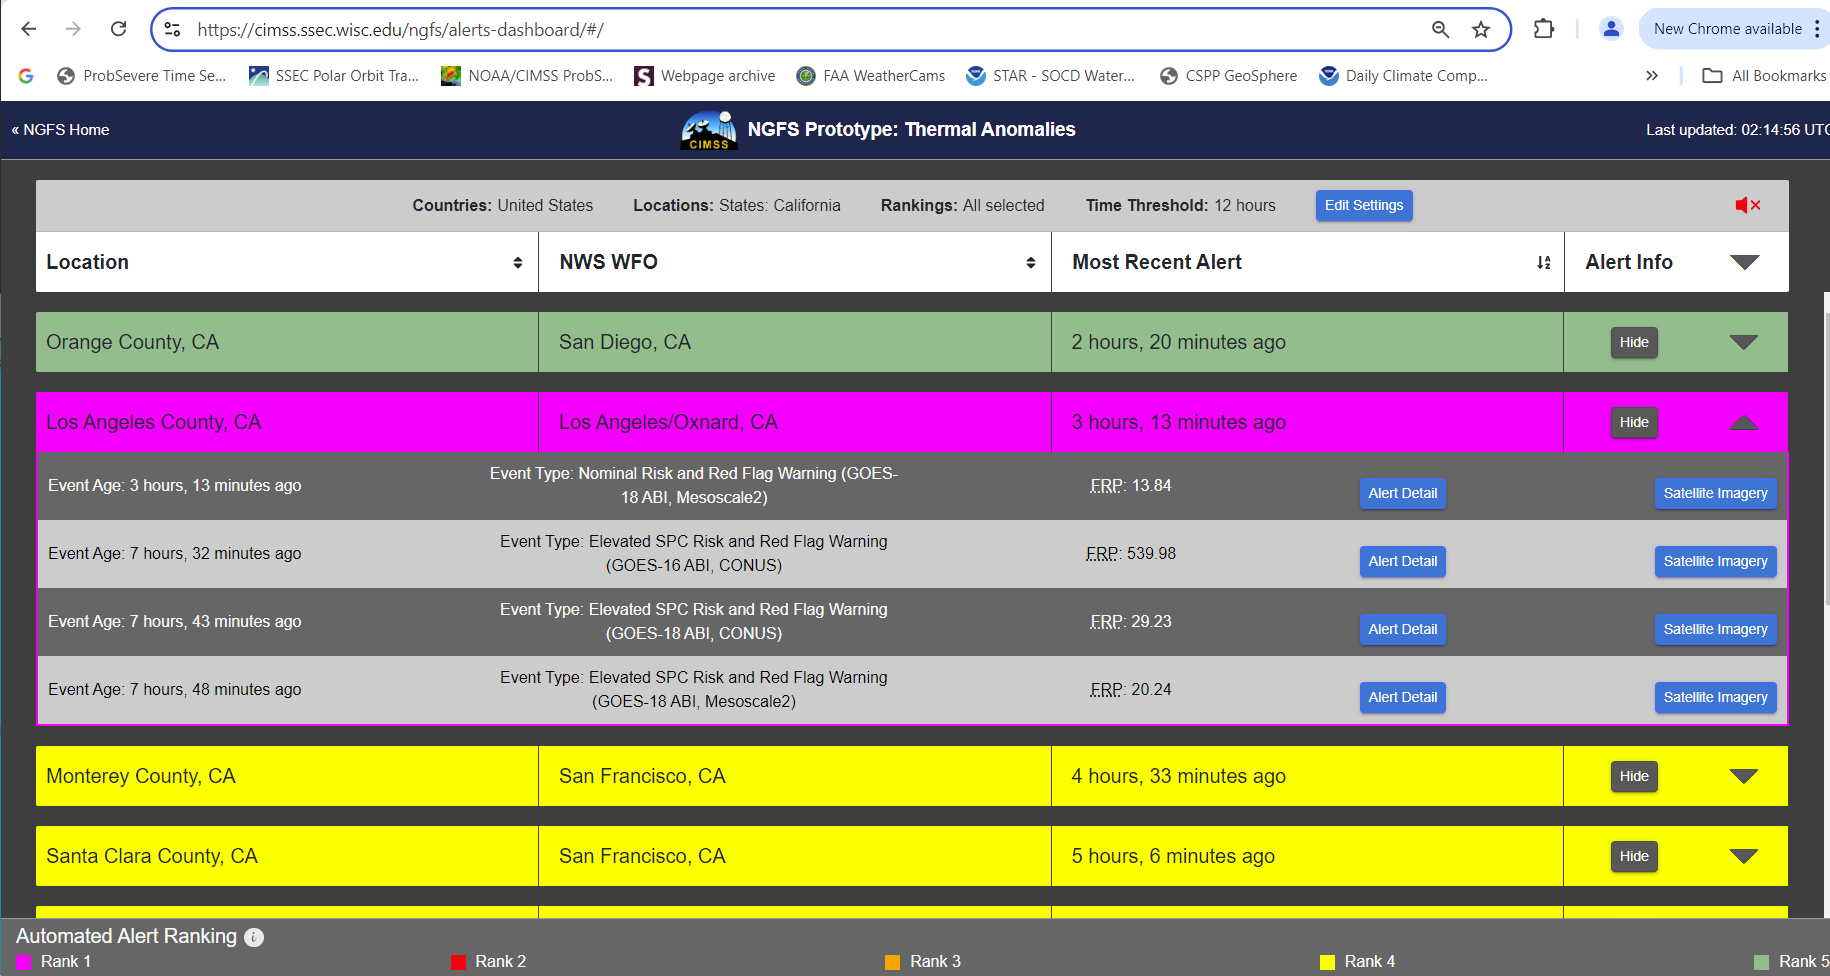
Strong Santa Ana winds and dry conditions caused multiple fires in Los Angeles area on 7-8 January 2025 (here is a blog post on the Palisades fire, for example). What information on these fires is provided by the Next-Generation Fire System (NGFS) website? The Alerts Dashboard at that site shows the latest Thermal Anomalies; when a previously un-detected fire develops, it is highlighted on that website. Consider the screenshot below, from ca. 0214 UTC on 7 January. Two separate fires are indicated in Los Angeles county; the county name is highlighted in magenta because Los Angeles County is ‘Rank 1’ as shown at the bottom of the page: SPC has highlighted the county as one defined by Extreme Fire Weather criteria, and/or there is a Red Flag warning. In other words, the likelihood of rapid fire growth is present. Other counties listed show less hazardous ranks. For Los Angeles County at 0214 UTC, the oldest detection (of the Palisades fire), from 7h 48 minutes before, occurred with GOES-18 Mesoscale Sector 2; GOES-18 CONUS data detected this fire 5 minutes after that, and GOES-16 CONUS’s detection lagged the GOES-18 Mesoscale sector detection by 16 minutes! The lesson from this: Use a mesoscale sector when possible for fire detection.
At 1439 UTC, the Alerts Dashboard for Los Angeles County shows much more activity, with at least three new thermal anomalies shown. For all the fires, the earliest detection was achieved by the GOES-18 Mesoscale domain (1-minute imagery) sector.
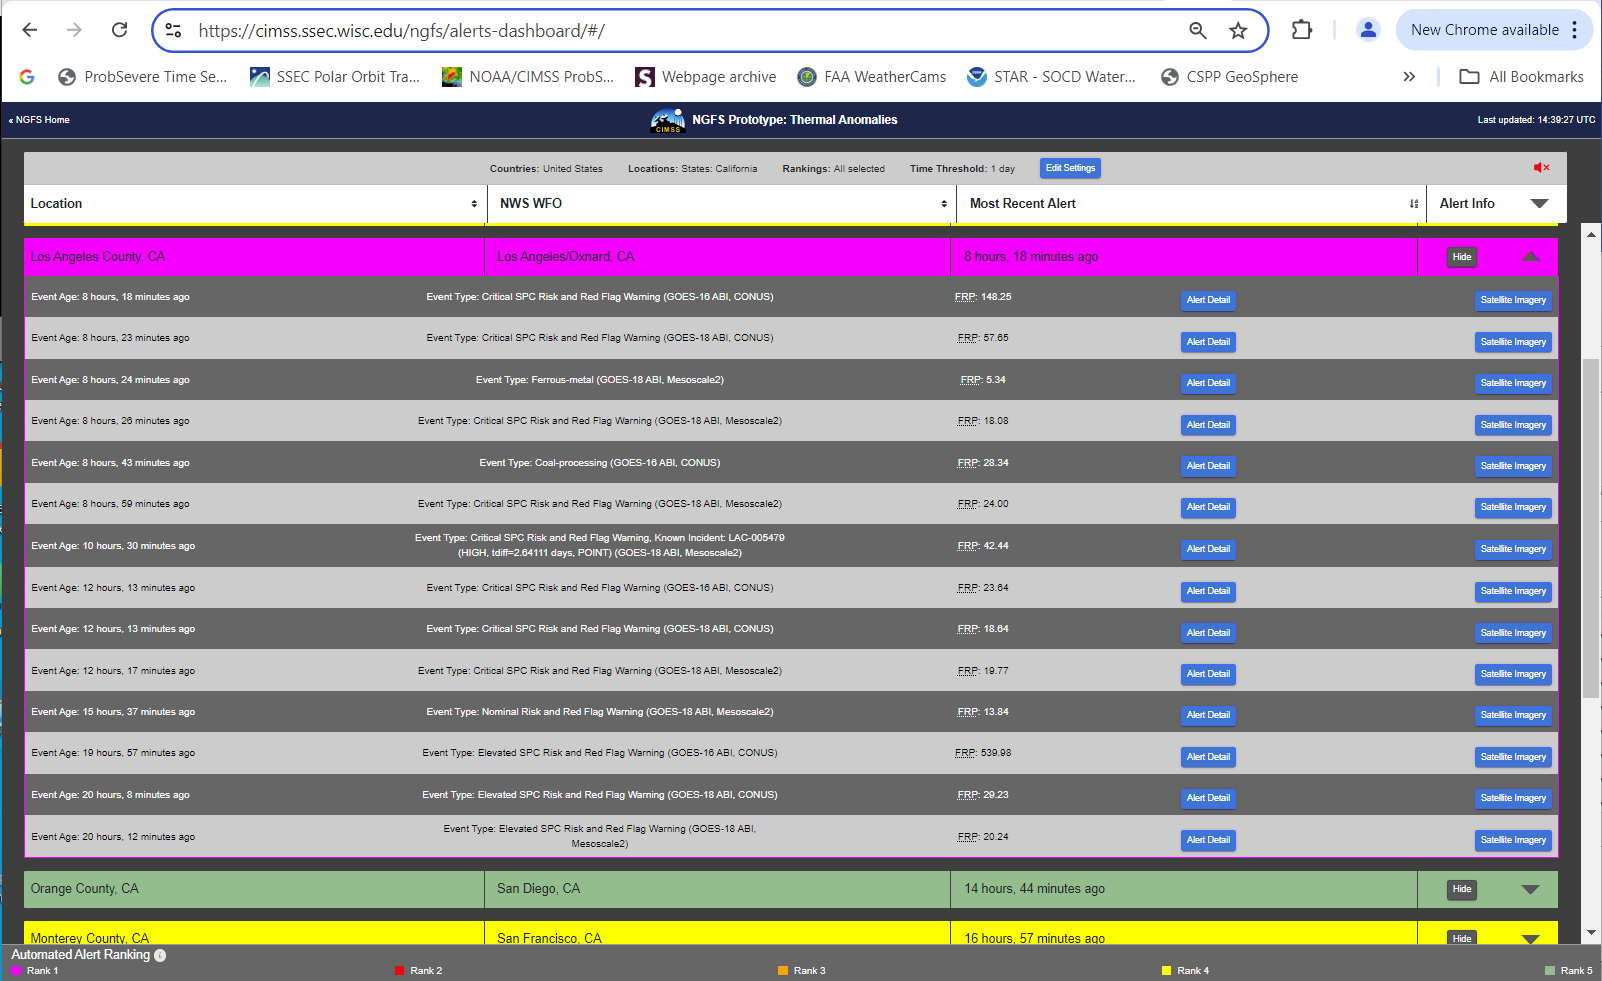
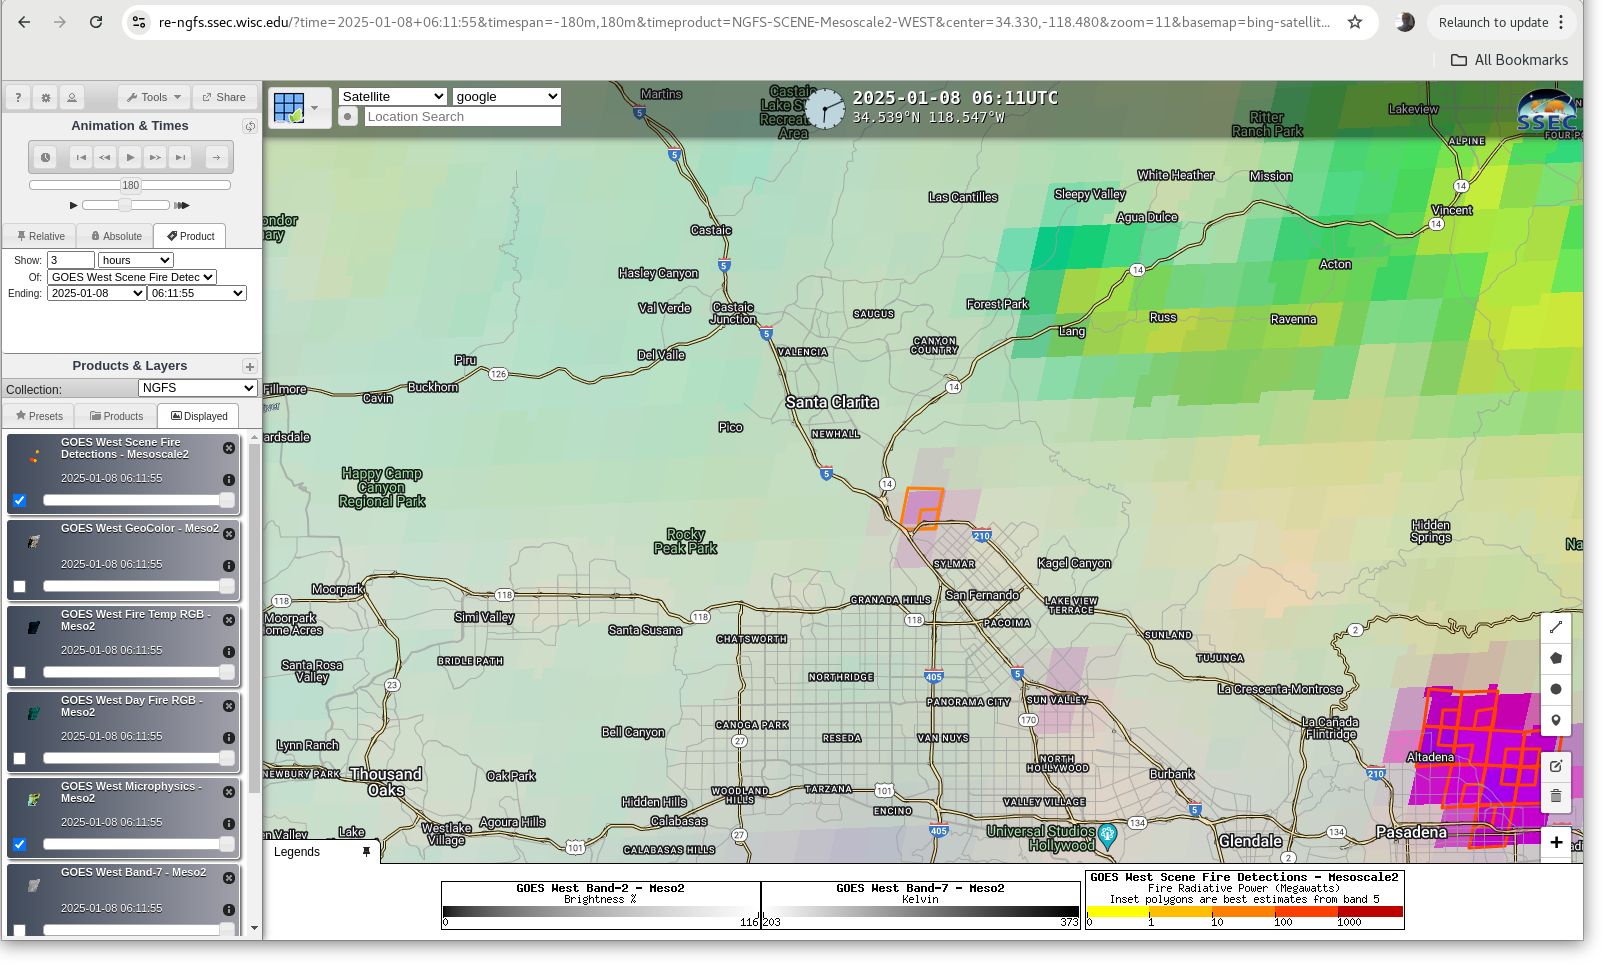
Clicking on the ‘Satellite Imagery’ box for the detection that’s 4 lines down in the image below — GOES-18 Mesoscale Sector 2, from 8h and 26 m before the time of the ‘Last Updated’ time (1439 UTC) yields the display below, NGFS Microphysics imagery centered on the new detection (to become the ‘Hurst’ Fire) between I-210 and I-5 south of Santa Clarita. The very obvious ongoing Palisades fire — near the coast — and the Eaton fire — near Altadena/Pasadena — are present. The focus for the figure below, however, is the newly-developing fire in the center of the image that is circled in the toggle. A user would already know of the two other fires ongoing.
On the right hand side of this display are right/left arrows that let a user step forward and backward with time for up to two hours. The slow toggle below shows the Night Microphysics for this fire at 0610 (no detection), 0611 (first detection), 0615 and 0811 UTC on 8 January. The fire grew rapidly.
Note the link on the side: ‘Open in Real Earth’. When that’s clicked, a new tab appears in your browser with the RealEarth display as shown below. The functionality of RealEarth allows a user to change the start/end times of the images loaded. RealEarth adds flexibility to the times displayed.
If you mouse over a pixel in RealEarth, the data can be probed, and the results at 1031 UTC are shown below for this fire. The land surface and potential fuels for the detected fire are shown in piechart form (this probe feature is also available at the NGFS website).
The RealEarth website makes it relatively simple to zoom out and see how things are changing over a long period of time. The toggle below, showing 0710 and 1710 UTC imagery, shows how the three fires have changed in those 10 hours. All three fires grew in size during these ten hours.
This is a life-threatening fire event over Los Angeles county. Residents should heed warnings from local officials. For more information, view the NWS Los Angeles website. In particular, very strong winds will lead to rapid fire spread, and inhibit fire-fighting efforts.
View only this post Read Less


