This website works best with a newer web browser such as Chrome, Firefox, Safari or Microsoft
Edge. Internet Explorer is not supported by this website.
Day Night Band imagery from JPSS satellites, above, processed using CSPP software on data from CIMSS and Monterey Direct Broadcast antennas, show a ribbon of Aurora over southern Canada early on the 1st of January. Activity was much brighter over the western part of North America. The Aurora is visible... Read More
VIIRS Day Night Band visible (0.7 µm) imagery from 0627 to 1012 UTC on 1 January 2025 (Click to enlarge)
Day Night Band imagery from JPSS satellites, above, processed using CSPP software on data from CIMSS and Monterey Direct Broadcast antennas, show a ribbon of Aurora over southern Canada early on the 1st of January. Activity was much brighter over the western part of North America. The Aurora is visible in part because of the waxing crescent Moon (it was new on 30 December 2024). NOAA-21 Day Night Band imagery over Alaska, below (unfortunately mislabeled as Suomi NPP), shows the peak Aurora initially over the southern part of the State. By the end of the animation however it is farther north.
VIIRS Day Night Band visible (0.7 µm) imagery from 0944 to 1804 UTC on 1 January 2025 (Click to enlarge)
The Aurora were present on 2 January as well over Alaska, as shown below.
VIIRS Day Night Band visible (0.7 µm) imagery from 0926 to 1427 UTC on 2 January 2025 (Click to enlarge)
It’s very hard to choose just one event from every month of the year, but the goal here is to show a variety of phenomena and locations that NOAA‘s GOES ABI routinely monitors, in this case during 2024. Most loops generated are from the University of Wisconsin-Madison CIMSS Satellite Blog, which is linked to in the titles at the top of each monthly entry. Imagery from GOES-16 and -18 (and -19) are showcased, along with the ABI’s sectors: Full Disk (10-min intervals), Contiguous U.S. (5-min intervals) and Mesoscale sectors (30-sec to 1-min intervals).
GOES-16 Full Disk CIMSS true color composite, most days of 2024, around 17 UTC.
Similar loop as above, but with a 1-min duration. Note that for several days in March that 16 UTC images were used.
GOES-18 Full Disk true color (Rayleigh corrected) composite, most days of 2024, around 17 UTC. (Click to Play)
The Moon’s shadow during the total solar eclipse was observed by many ABI spectral bands.
Time composited (minimum value) ABI band 3 imagery (every 10 min) from 2017, 2024 and both.
Bonus material: 1-min Mesoscale Sector (with 5-min CONUS sectors) of an enhanced ABI band 3 (0.86 um) following the shadow:
GOES-16 ABI Band 3 enhanced to highlight the eclipse shadow. These are 1-minute Mesoscale sectors over the 5-minute CONUS sectors, tracking the shadow every minute as it moves across North America. (Animation from M. Gunshor, UW/CIMSS).
GOES-16 (GOES-East)Nighttime Microphysics RGB images showed a thunderstorm that moved southeast from the New Mexico / Texas border across the southern Texas Panhandle Plains on 29 May 2024. A narrow northwest-to-southeast oriented hail swath produced by this storm — from south of Clovis, New Mexico to south of Lubbock, Texas — showed up as pale shades of beige. The Land Surface Temperature derived product showed cooling in the hail swath of more than 10F.
GOES-16 Nighttime Microphysics RGB images on May 29, 2024. (Click to play)
Similar to the long forgotten fog in many river valleys in BAMS (1989) observed by GOES-7, GOES-16 showed narrow tendrils of river valley fog — along a portion of the Mississippi River and a few of its tributaries in Wisconsin, Minnesota and Iowa. The derived fog and low stratus product also monitored the fog, while showing the need for improved spatial resolutions.
GOES-16 “Red” Visible (0.64 µm) images on May 5, 2024, without/with plots of 15-minute METAR surface reports. Click to Play.
The GOES-U rocket launch was monitored by both GOES-18 ABI (30-sec) and GOES-16 (1-min), these were research Mesoscale Sector requests. Note that not only was the launch and rocket separation seen, but also the booster rockets re-burn when returning to land at the Kennedy Space Center! GOES-U became GOES-19 after successfully reaching geostationary orbit.
30-second GOES-East imagery showing the thermal signature of the SpaceX Falcon Heavy rocket boosters as it launched GOES-U from NASA’s Kennedy Space Center, June 25, 2024. (Click to Play.)GOES-U Rocket launch and the booster re-entry (in white circle) as seen by GOES-16 ABI meso-sector scans on June 25, 2024. Click to Play.
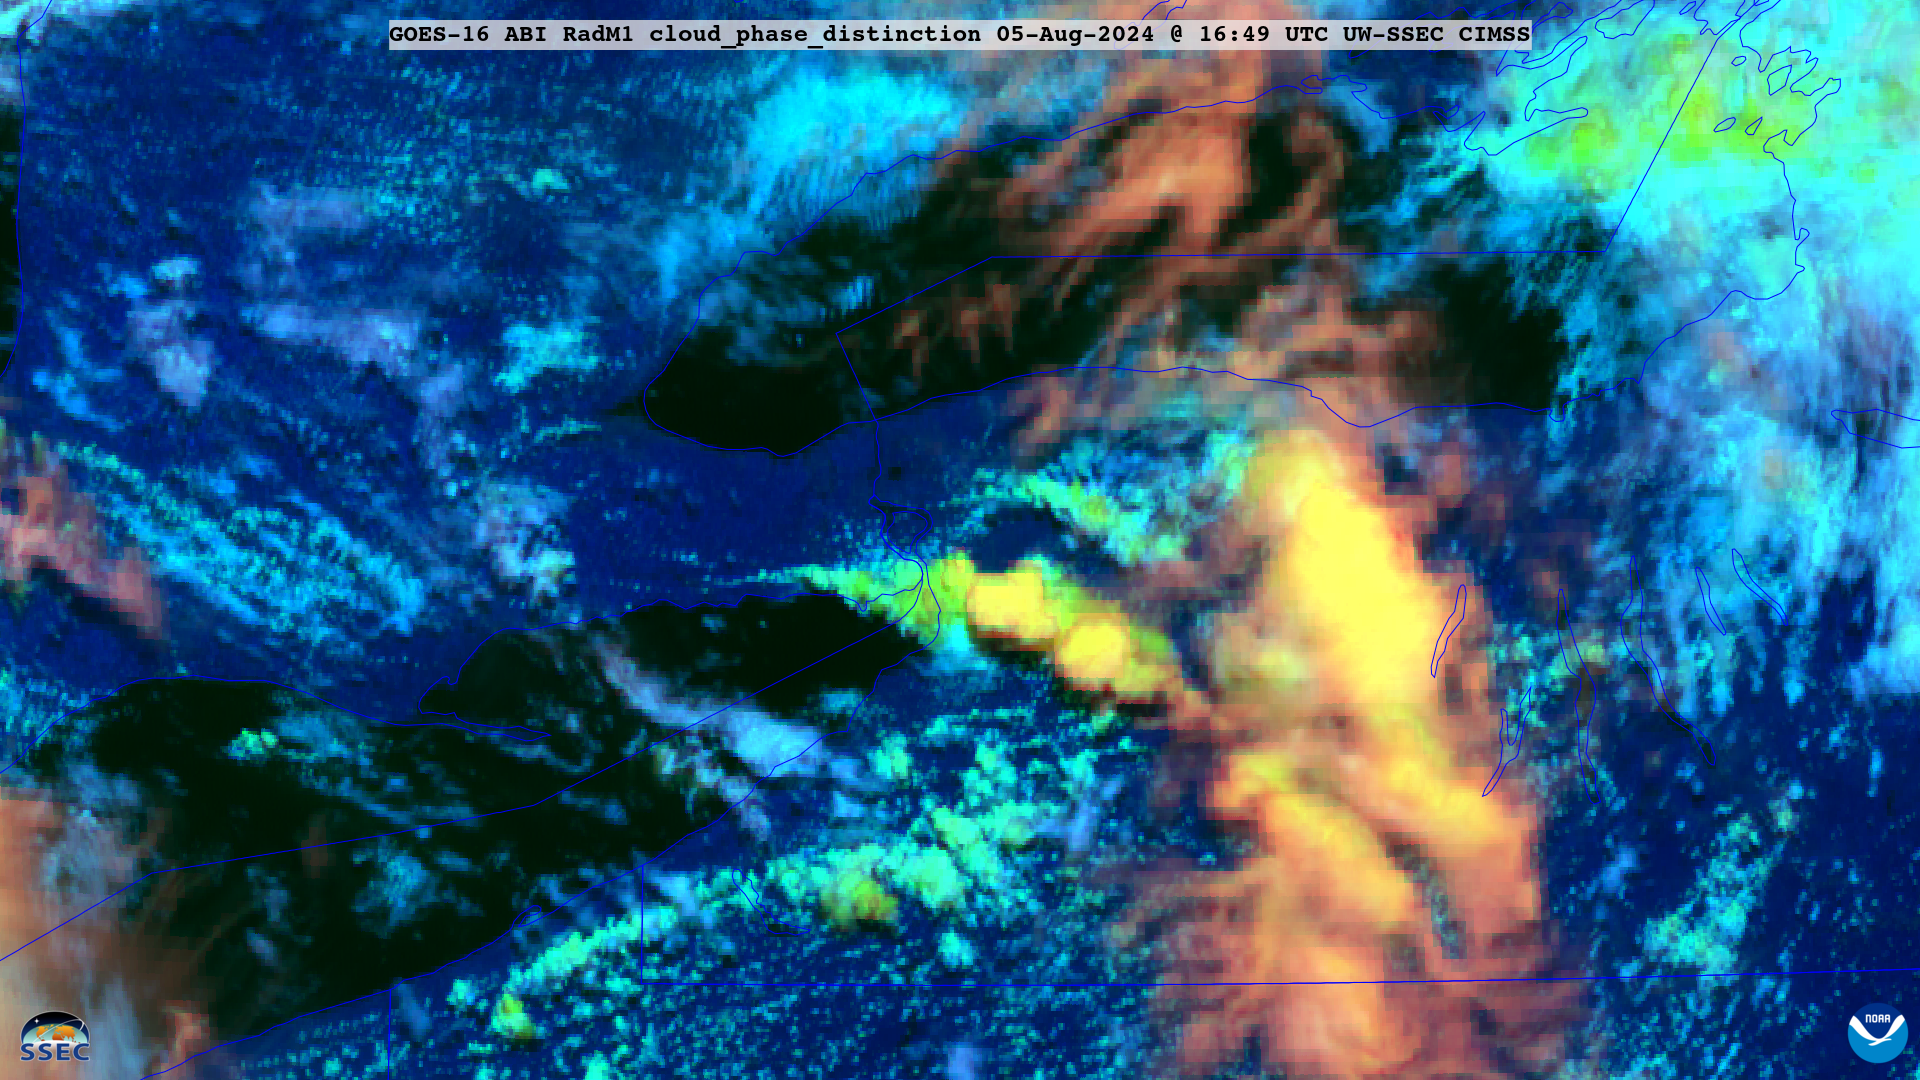
The storms associated with a weak tornado (at 16:49 UTC) in Buffalo New York were monitored by GOES. The Day Cloud Phase Distinction RGB is shown, demonstrating the glaciation of the clouds.
GOES-16 Mesoscale Sector Day Cloud Phase Distinction RGB, 14 -19 UTC on 5 August 2024 (Click to Play.)
During September, GOES-19 ABI continued to collect imagery from it’s location at approximately 90W and the equator. The ABI has 2 visible, 4 near-IR (or near-visible) and 10 IR bands.
The 16 spectral bands of the (Preliminary/Non-operational) early GOES-19 ABI from September 27 to October 1, 2024. (Click to Play.)
On October 2, 2024 several of the geostationary imagers observed the Moon’s shadow in the Southern Hemisphere. An example from the ABI on GOES-19 is below. A CIMSS true color loop doesn’t create the artificial colors that can happen in Raleigh-corrected composite imagery.
GOES-19 (Preliminary, Non-operational) ABI Full Disk CIMSS true color animation from October 2, 2024. (Click to Play.)
A prolonged eruptive period of Popocatépetl occurred during 22 October – 4 November 2024. Ash RGB images showed the periodic pulses of ash from Popocatépetl.
GOES-19 ABI (Preliminary, Non-operational) “ash” RGB from October 22 to November 4, 2024. (Click to Play.)
A number of derived products, such as a radiometrically-retrieved Ash Height product from the NOAA/CIMSS Volcanic Cloud Monitoring site showed that the volcanic plume occasionally reached altitudes of 12 km or greater.
Bonus – Power Plant Plume Produces Precipitation
GOES-19 (Preliminary, non-operational) cloud phase distinction over western WI on November 28, 2024. (Click to Play.)
According to Scott Bachmeier, CIMSS “The Nighttime Microphysics RGB did a good job of highlighting the industrial plume — then after sunrise, True Color RGB imagery showed that the plume had seeded the cloud layer enough to cause it to dissipate as it produced the snowfall (sort of like the aircraft-induced “fall streak” effect).”
While the animation below does not start in the month of December, it does end in that month. This is a combined GOES-West and East ABI band 13 composite image, in a Mollweide projection. This loop shows hourly data, as does this near realtime web page.
GOES-18/16 ABI longwave window composite imagery, starting on June 1, 2024. (Click to Play.)
Similar animations as above, from June 1 to December 13, but with playback durations of 1 and 2 minutes. The location of 7-day (hourly) animations for a few of the ABI bands.
Thanks to all who make the GOES imagery possible, the ingest and software to display the imagery (including, but not limited to McIDAS-X, geo2grid, geosphere, Real Earth and AWIPS) and all who generated CIMSS Satellite Blog entries, especially Scott Lindstrom and Scott Bachmeier. Special thanks to Mat Gunshor and Jim Nelson of the UW/CIMSS AWG Imagery Team. T. Schmit works for NOAA/NESDIS/STAR, is stationed in Madison WI, and will be retiring from federal service at the end of 2024.
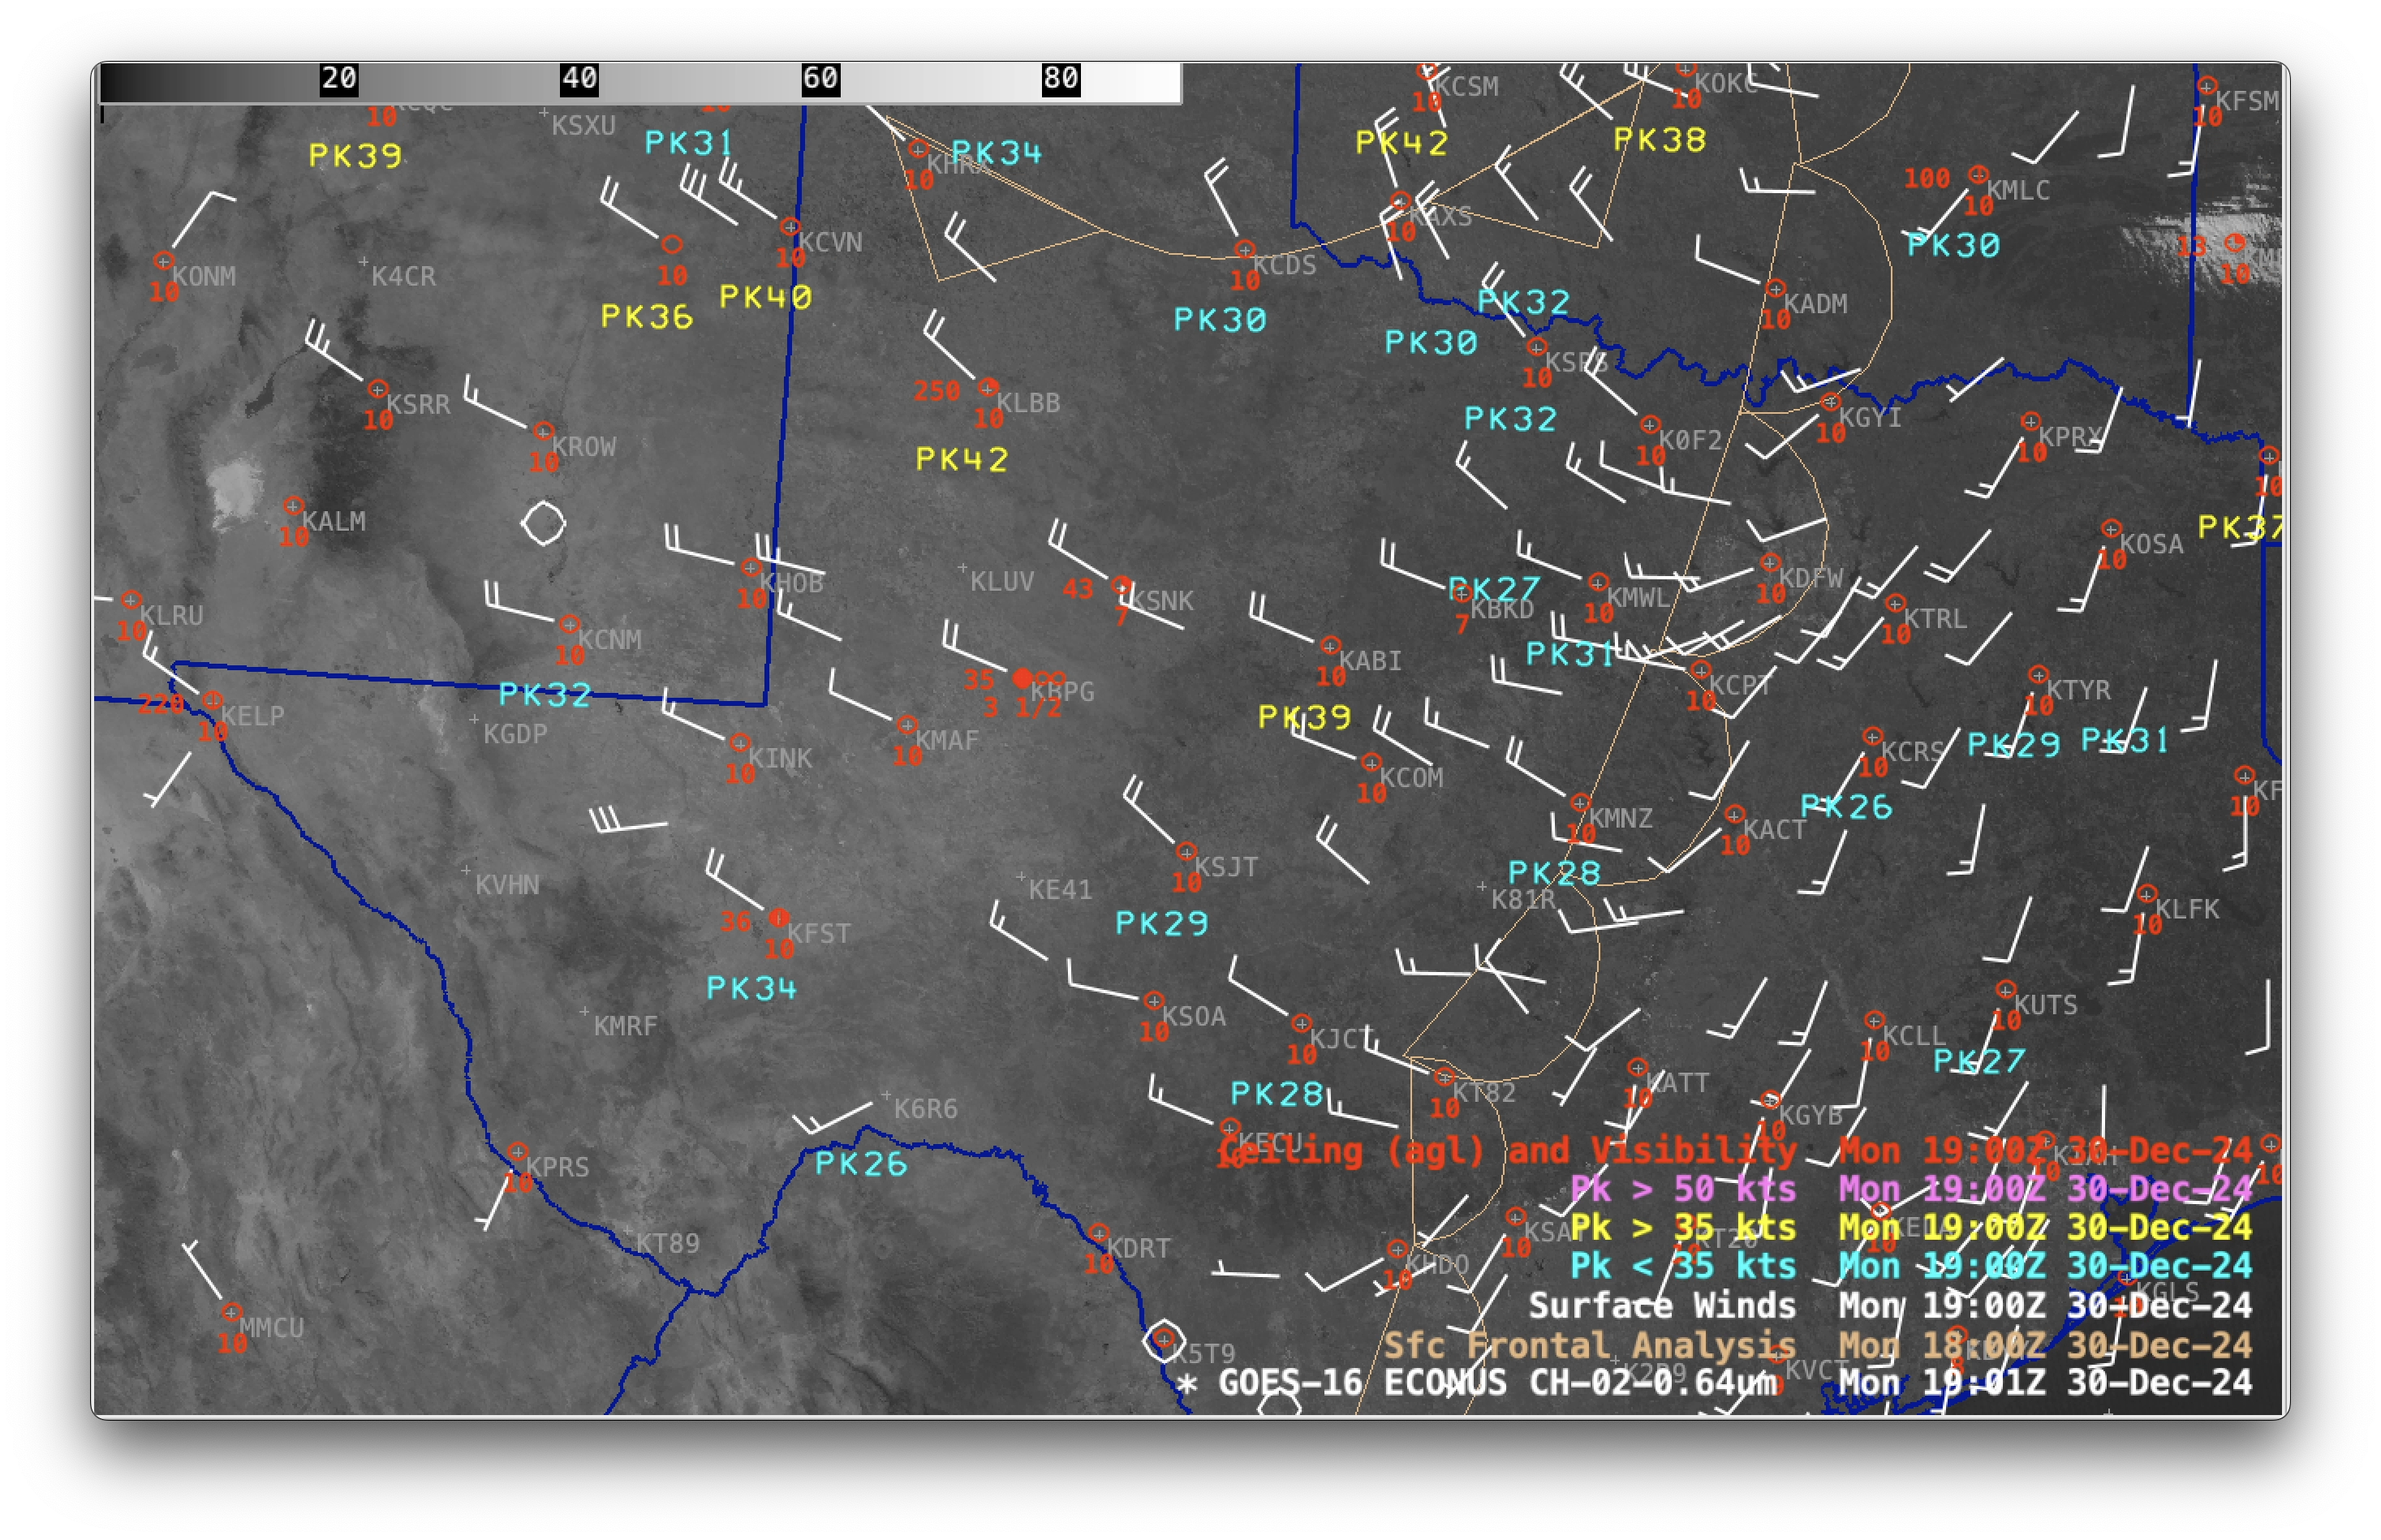
GOES-16 (GOES-East) Visible images (above) showed the hazy signature of a narrow plume of blowing dust that developed across West Texas on 30 December 2024. Lofted by strong NW winds behind a dryline, this blowing dust briefly reduced the surface visibility to 3.5 miles at Big Spring (KBPG) and 7... Read More
GOES-16 Red Visible (0.64 µm) images with plots of surface wind barbs (white), peak wind gusts (cyan/yellow), ceiling/visibility (red) and surface fronts (beige), from 1446-2301 UTC on 30 December [click to play MP4 animation]
GOES-16 (GOES-East) Visible images (above) showed the hazy signature of a narrow plume of blowing dust that developed across West Texas on 30 December 2024. Lofted by strong NW winds behind a dryline, this blowing dust briefly reduced the surface visibility to 3.5 miles at Big Spring (KBPG) and 7 miles at Snyder (KSNK).
GOES-19 (Preliminary/Non-operational) True Color RGB images (top) and Dust RGB images (bottom), from 1701-2326 UTC on 30 December [click to play animated GIF | MP4]
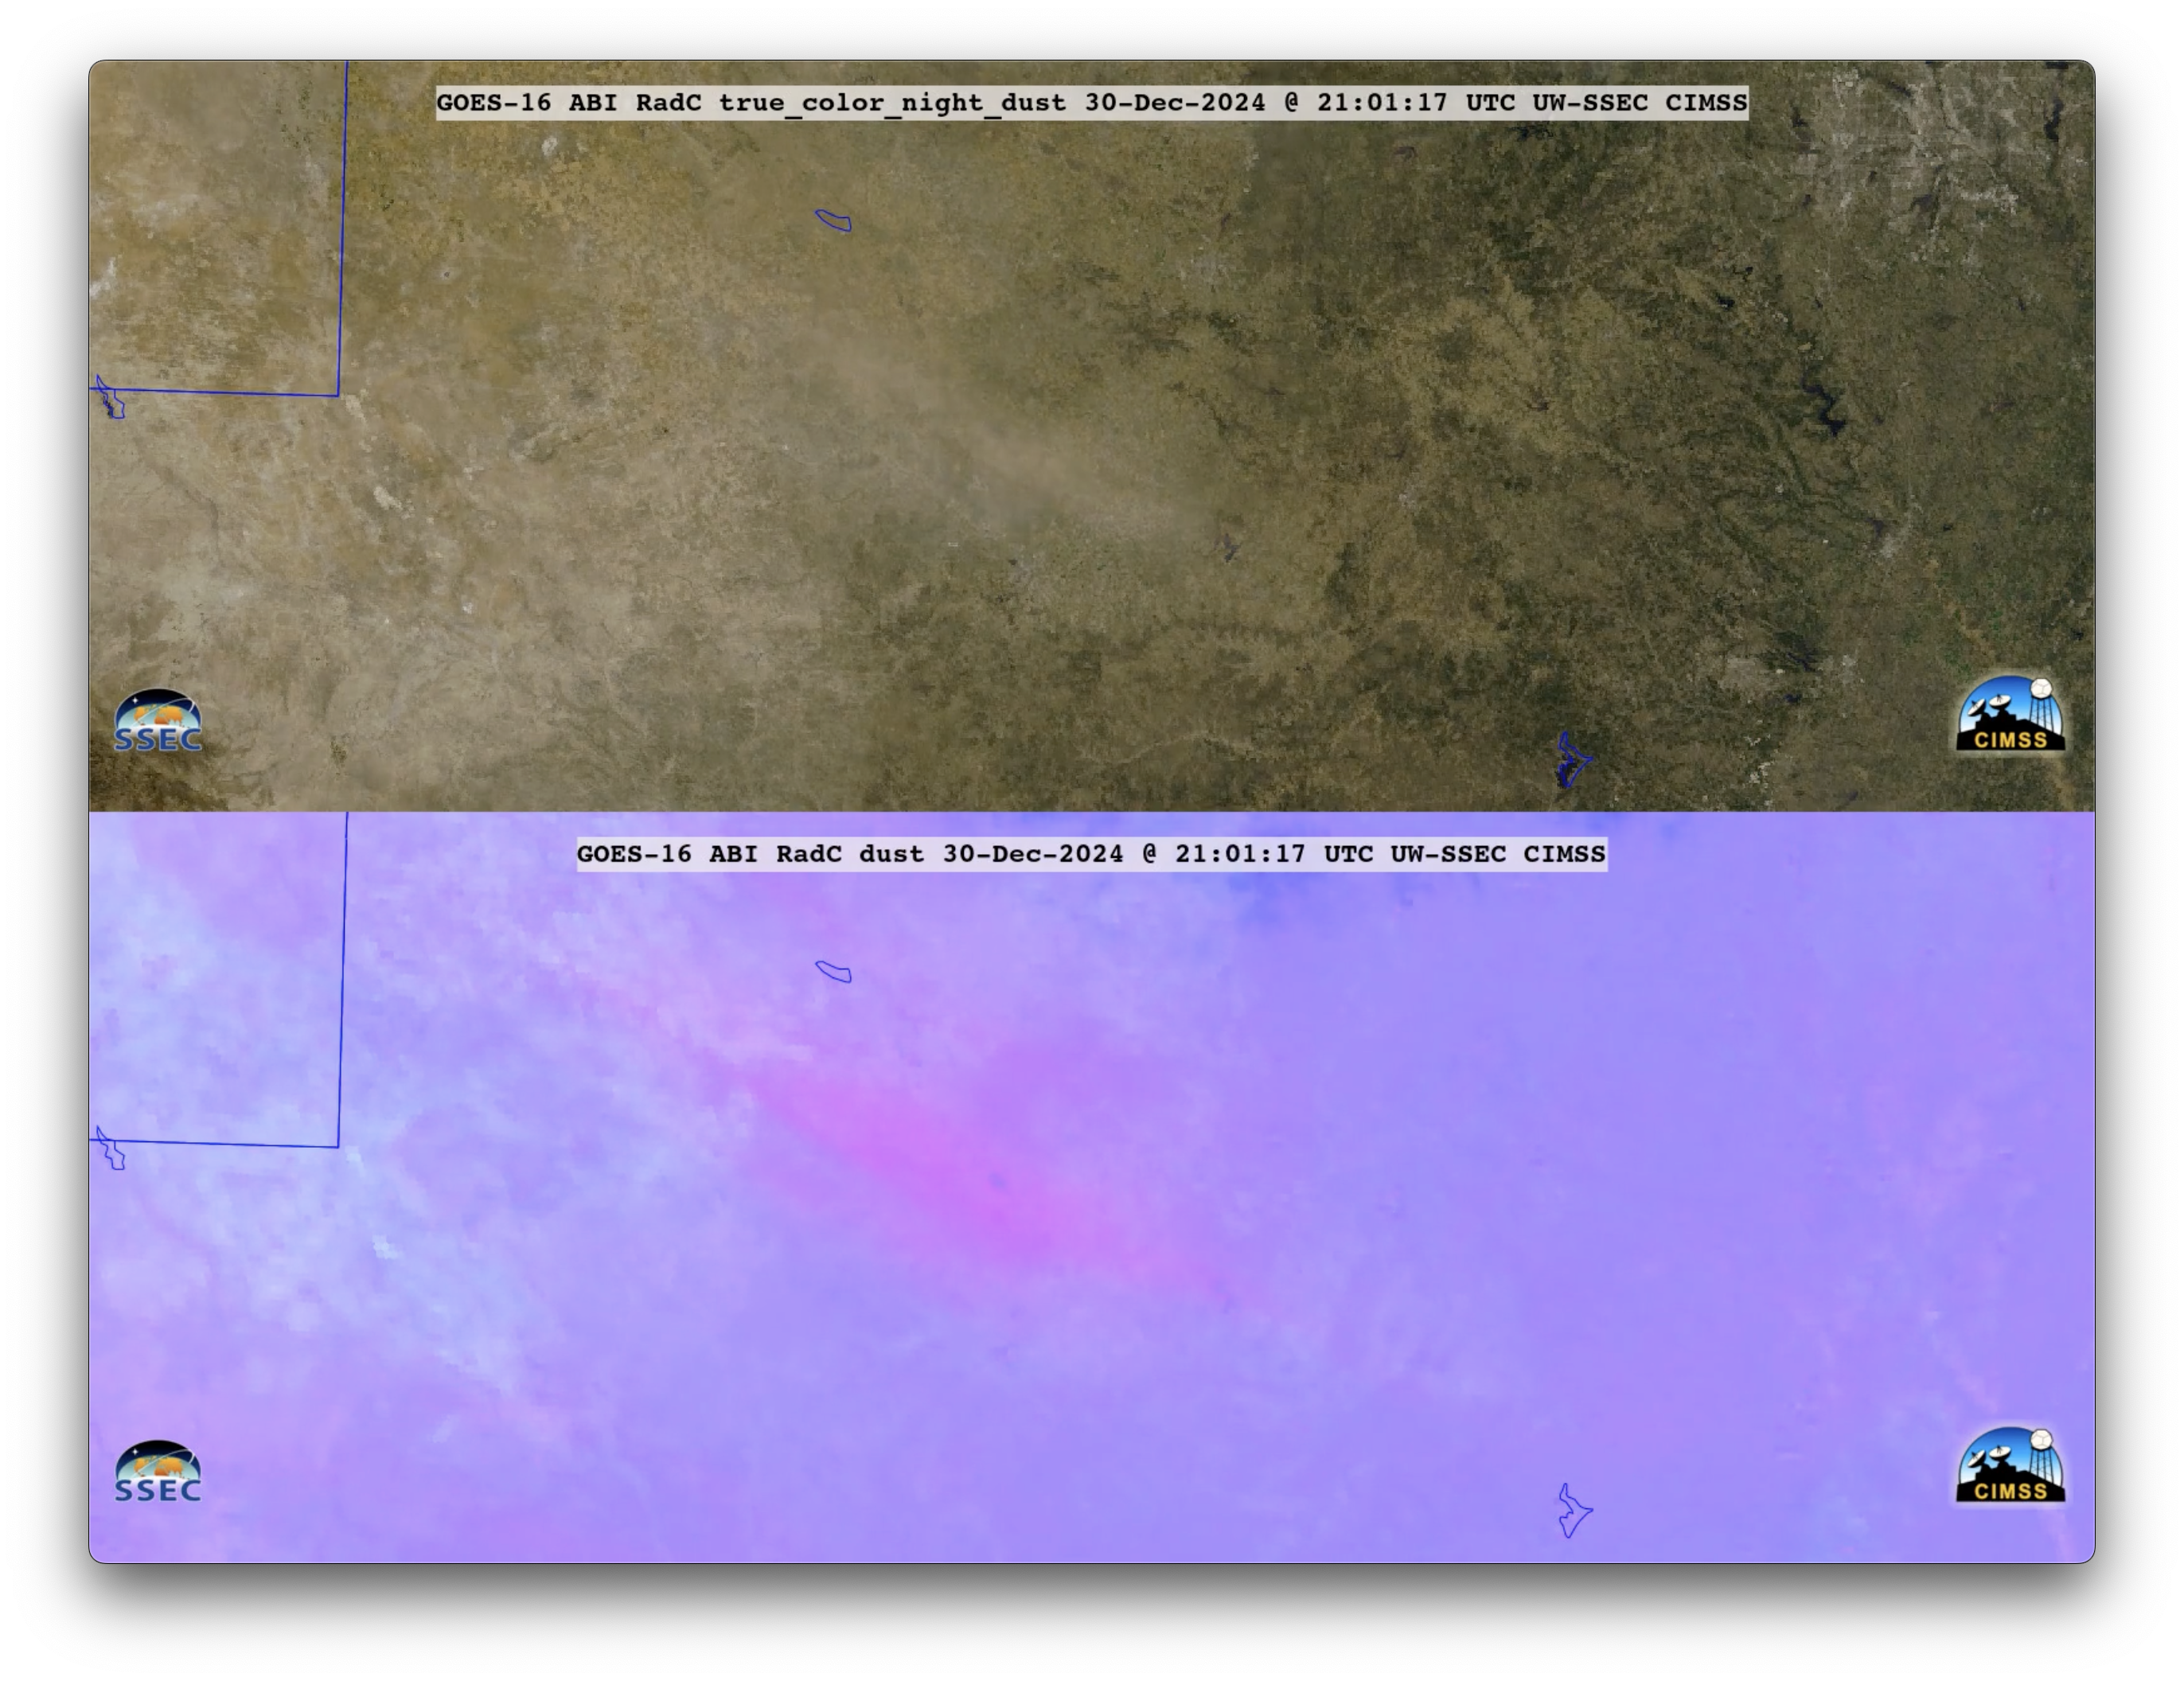
True Color RGB and Dust RGB images — created using Geo2Grid — from GOES-19 (Preliminary/Non-operational) (above) and GOES-16 (below) revealed that the blowing dust’s light magenta signature in Dust RGB imagery was apparent before its hazy tan signature became evident in True Color RGB imagery.
GOES-16 True Color RGB images (top) and Dust RGB images (bottom), from 1701-2326 UTC on 30 December [click to play animated GIF | MP4]
Also of note was the earlier appearance of the dust’s hazy tan signature in GOES-16 True Color RGB imagery compared to GOES-19, as seen in a toggle of 2101 UTC images (below). This was due to a larger (and thus more favorable) forward scattering geometry from GOES-16 (positioned farther east over the Equator at 75.2°W longitude) compared to GOES-19 (positioned at 89.5°W longitude, during its post-launch testing).
GOES-16 vs GOES-19 True Color RGB image (top) and Dust RGB image (bottom) at 2101 UTC on 30 December [click to enlarge]
5-minute CONUS Sector GOES-19 (Preliminary/Non-operational) True Color RGB and Blowing Snow RGB images created using Geo2Grid (above) displayed a small patch of radiation fog over Lake Mendota that slowly dissipated during the morning hours on 25th December 2024 (the Blowing Snow RGB is a modified version of the Day Snow-Fog RGB, which uses higher spatial resolution Band 2... Read More
GOES-19 True Color RGB (left) and Blowing Snow RGB (right), from 1431-1801 UTC on 25th December [click to play animated GIF | MP4]
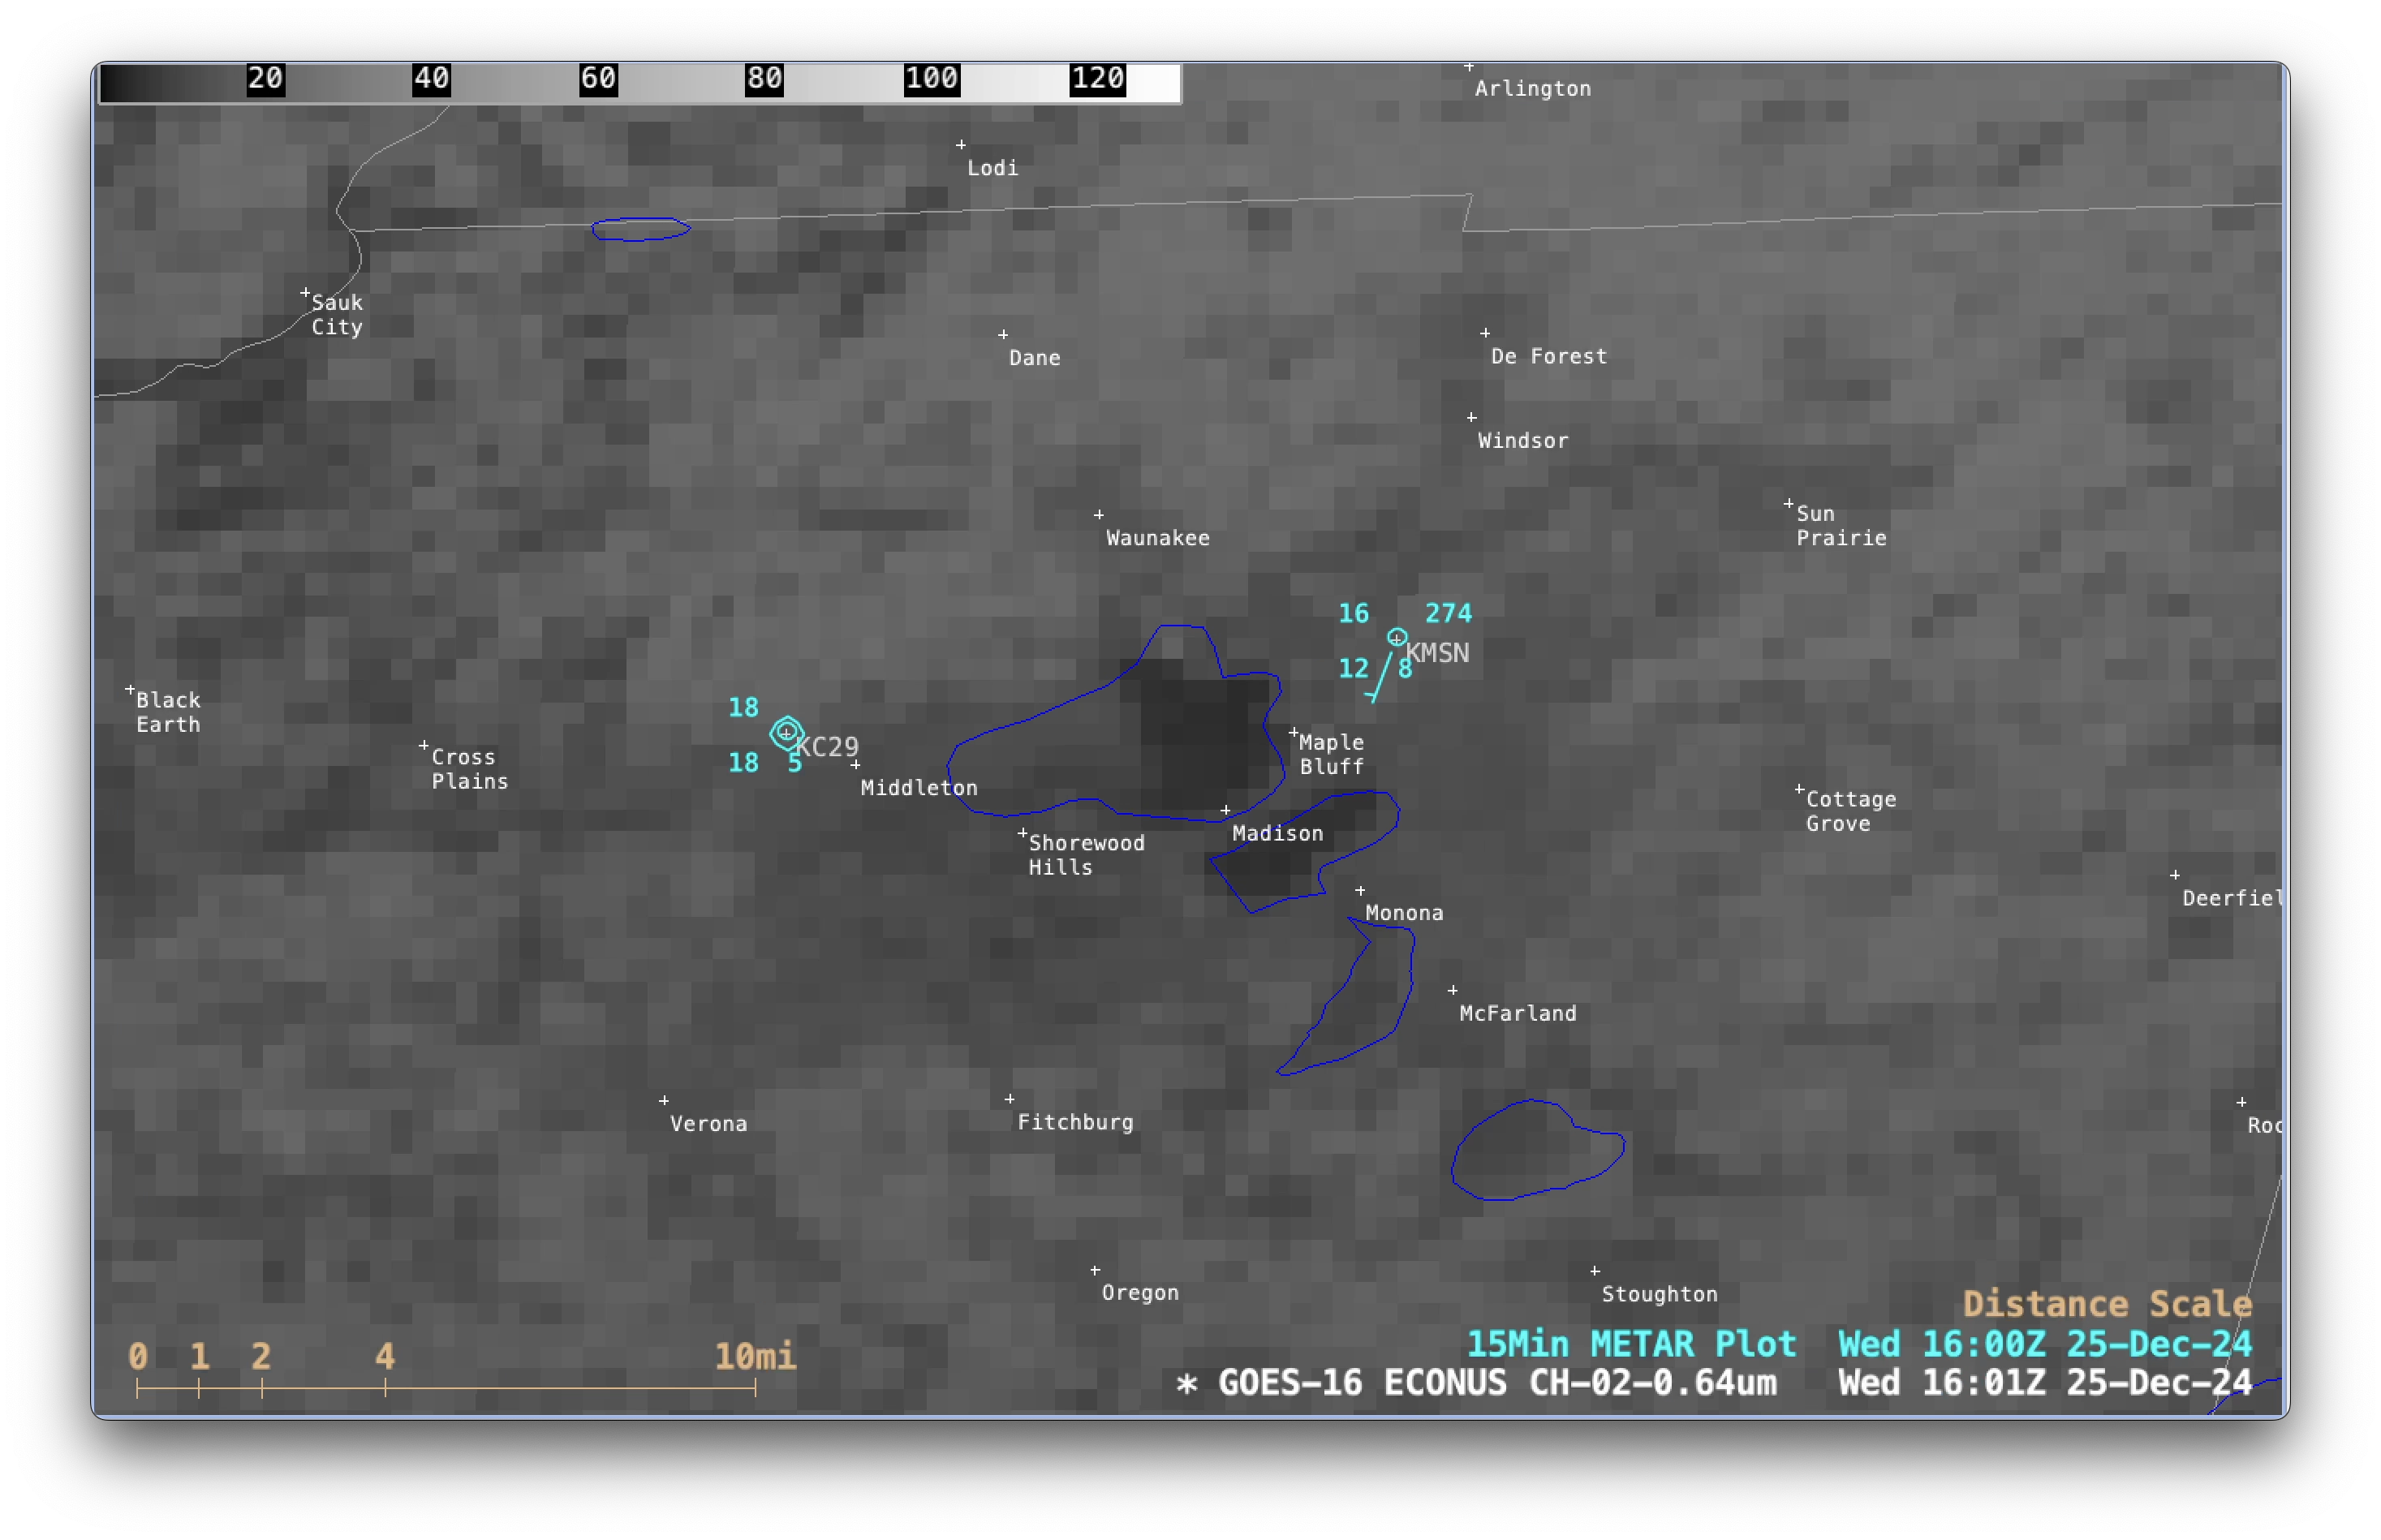
5-minute CONUS Sector GOES-19 (Preliminary/Non-operational) True Color RGB and Blowing Snow RGB images created using Geo2Grid(above) displayed a small patch of radiation fog over Lake Mendota that slowly dissipated during the morning hours on 25th December 2024 (the Blowing Snow RGB is a modified version of the Day Snow-Fog RGB, which uses higher spatial resolution Band 2 imagery in place of Band 3 as the Red component). Much of Lake Mendota was still ice-free (although some ice growth had occurred along parts of the shoreline) — but nocturnal radiational cooling allowed the surface air temperature at nearby airports to reach minimum values of 9ºF at Middleton (KC29) and 10ºF at Madison (KMSN). The Lake Mendota fog did briefly move inland across the southern and western edges of the lake.
5-minute GOES-16 (GOES-East) Visible images (below) showed the fog dissipating over the western half of Lake Mendota as surface air temperatures began to warm after sunrise.
GOES-16 Red Visible (0.64 µm) images with surface reports with 15-minute METAR surface reports plotted in cyan, from 1431-1801 UTC on 25th December [click to play MP4 animation]
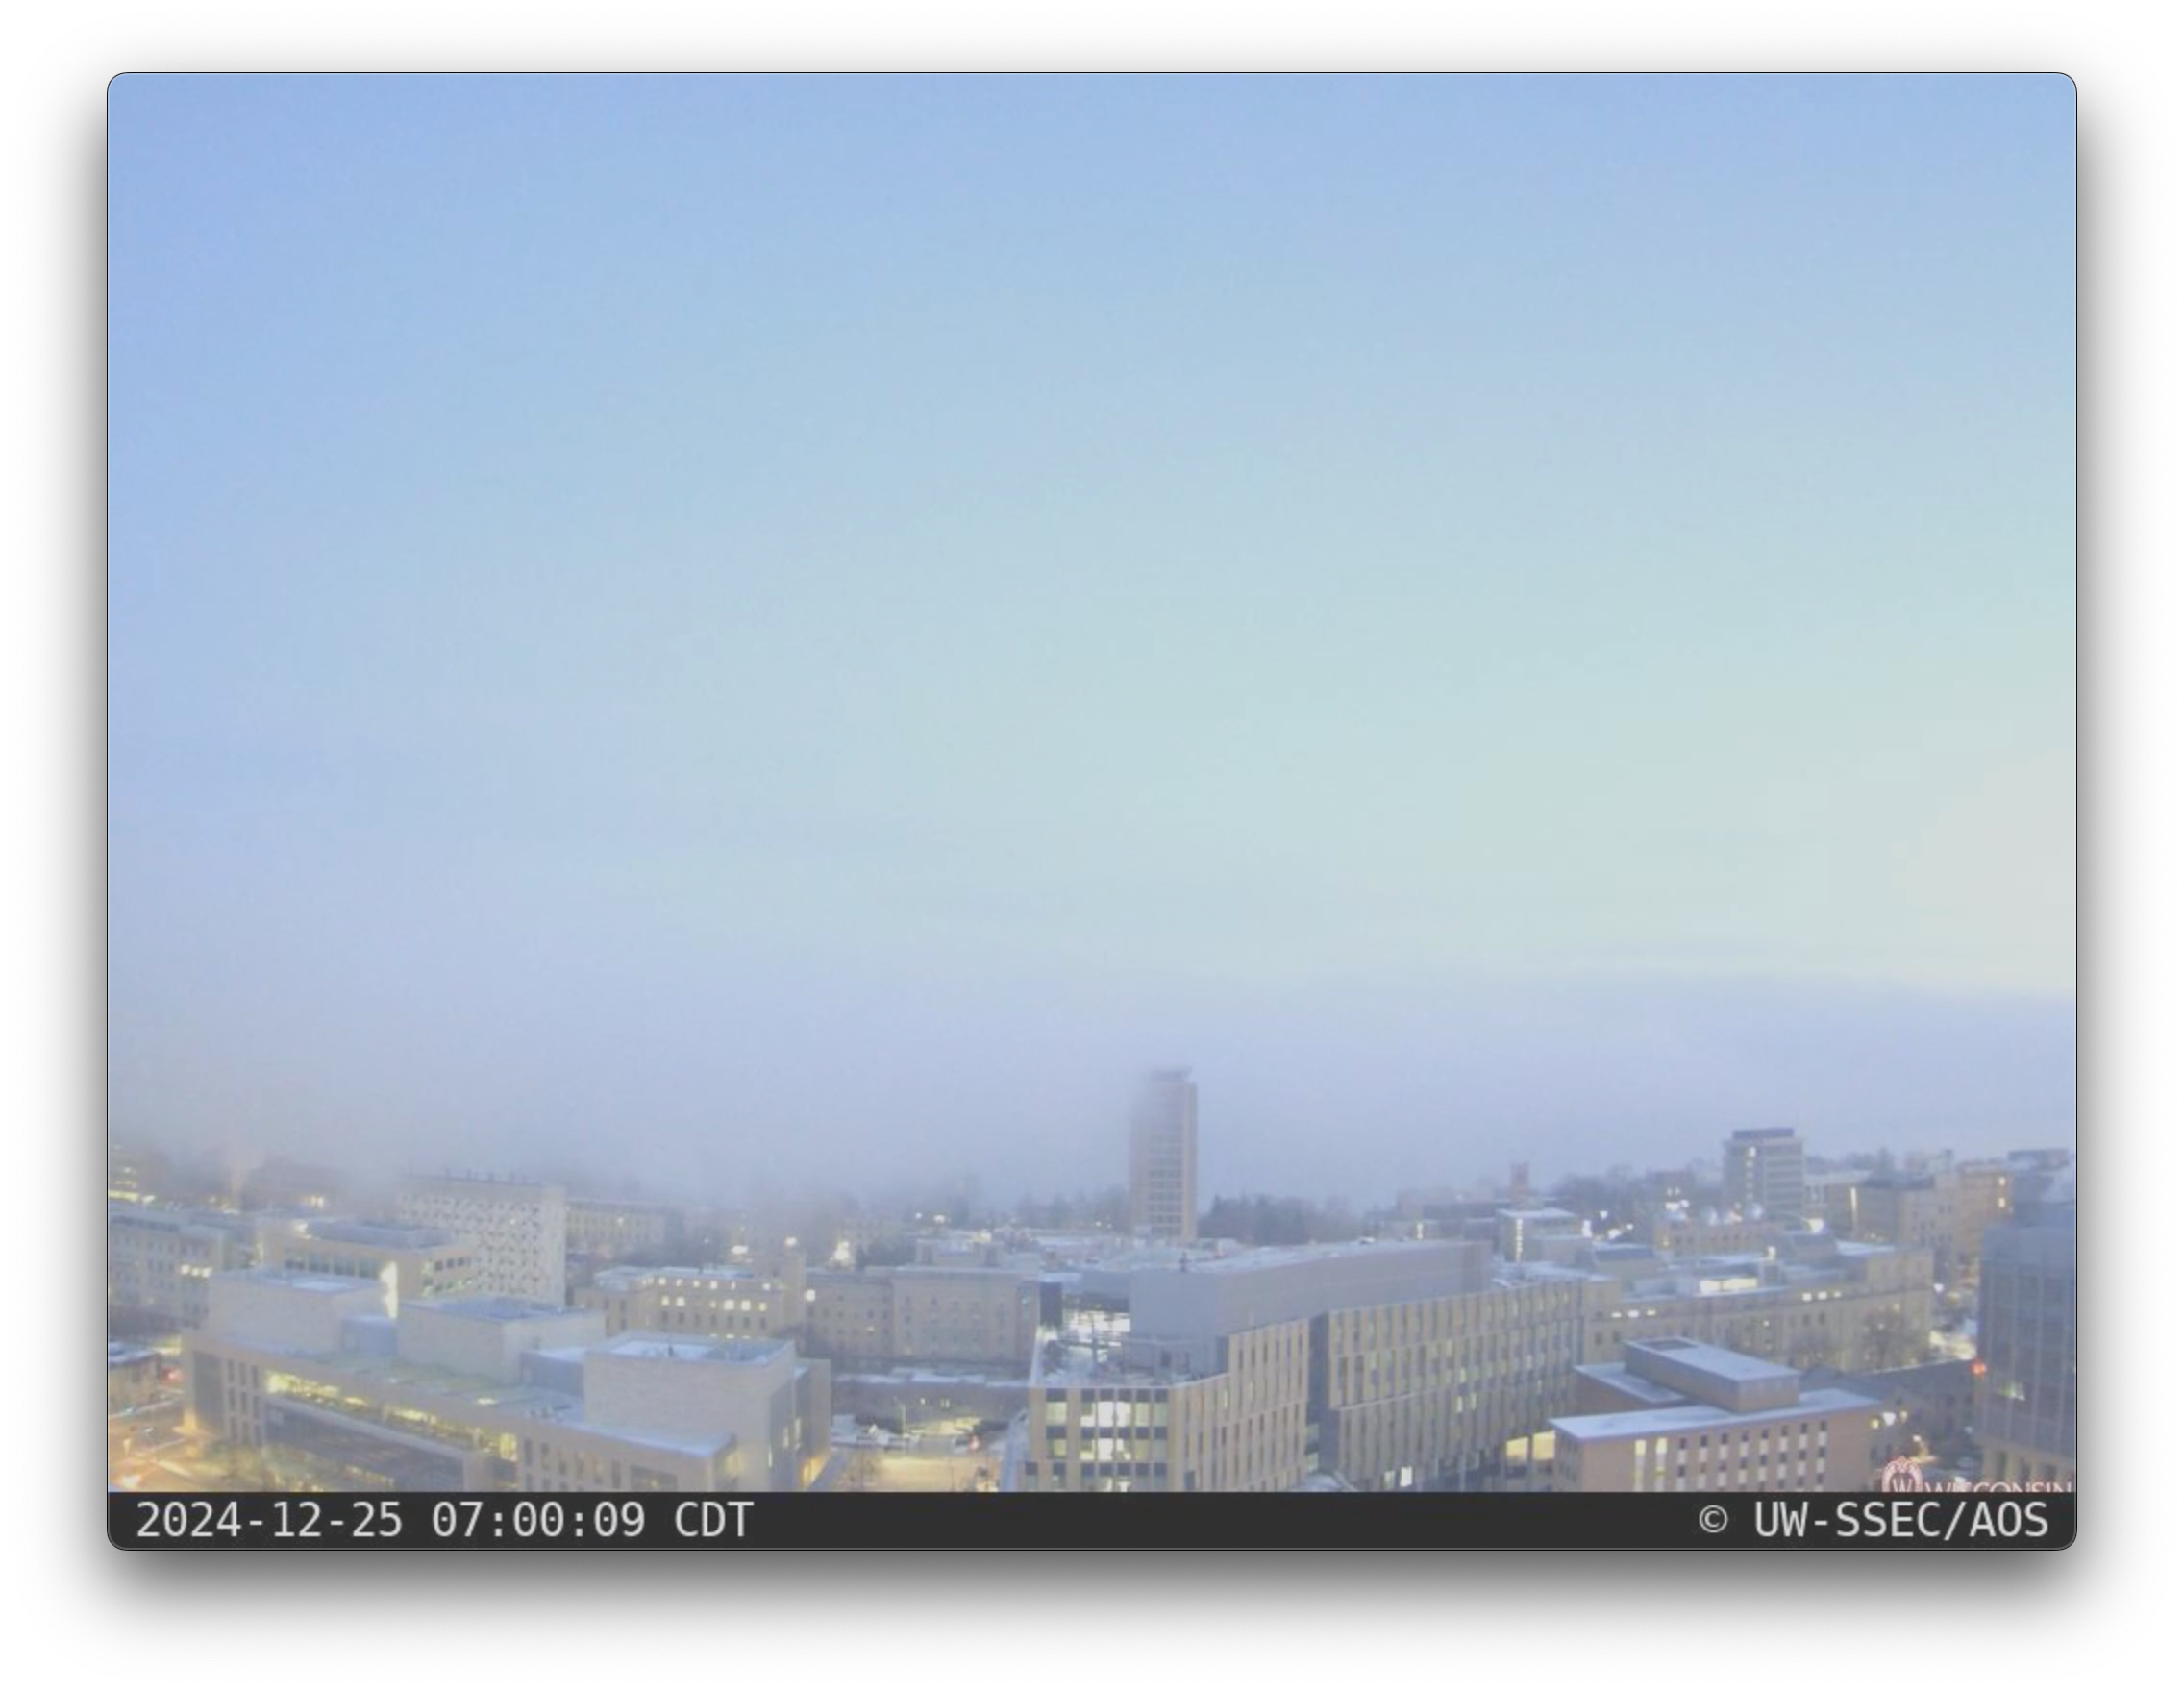
UW-SSEC/AOS north-facing rooftop camera images (below) revealed multiple incursions of the Lake Mendota fog into the University of Wisconsin – Madison campus, located just south of the lake (both before and after sunrise).
UW-SSEC/AOS north-facing rooftop camera images [click to play MP4 animation]
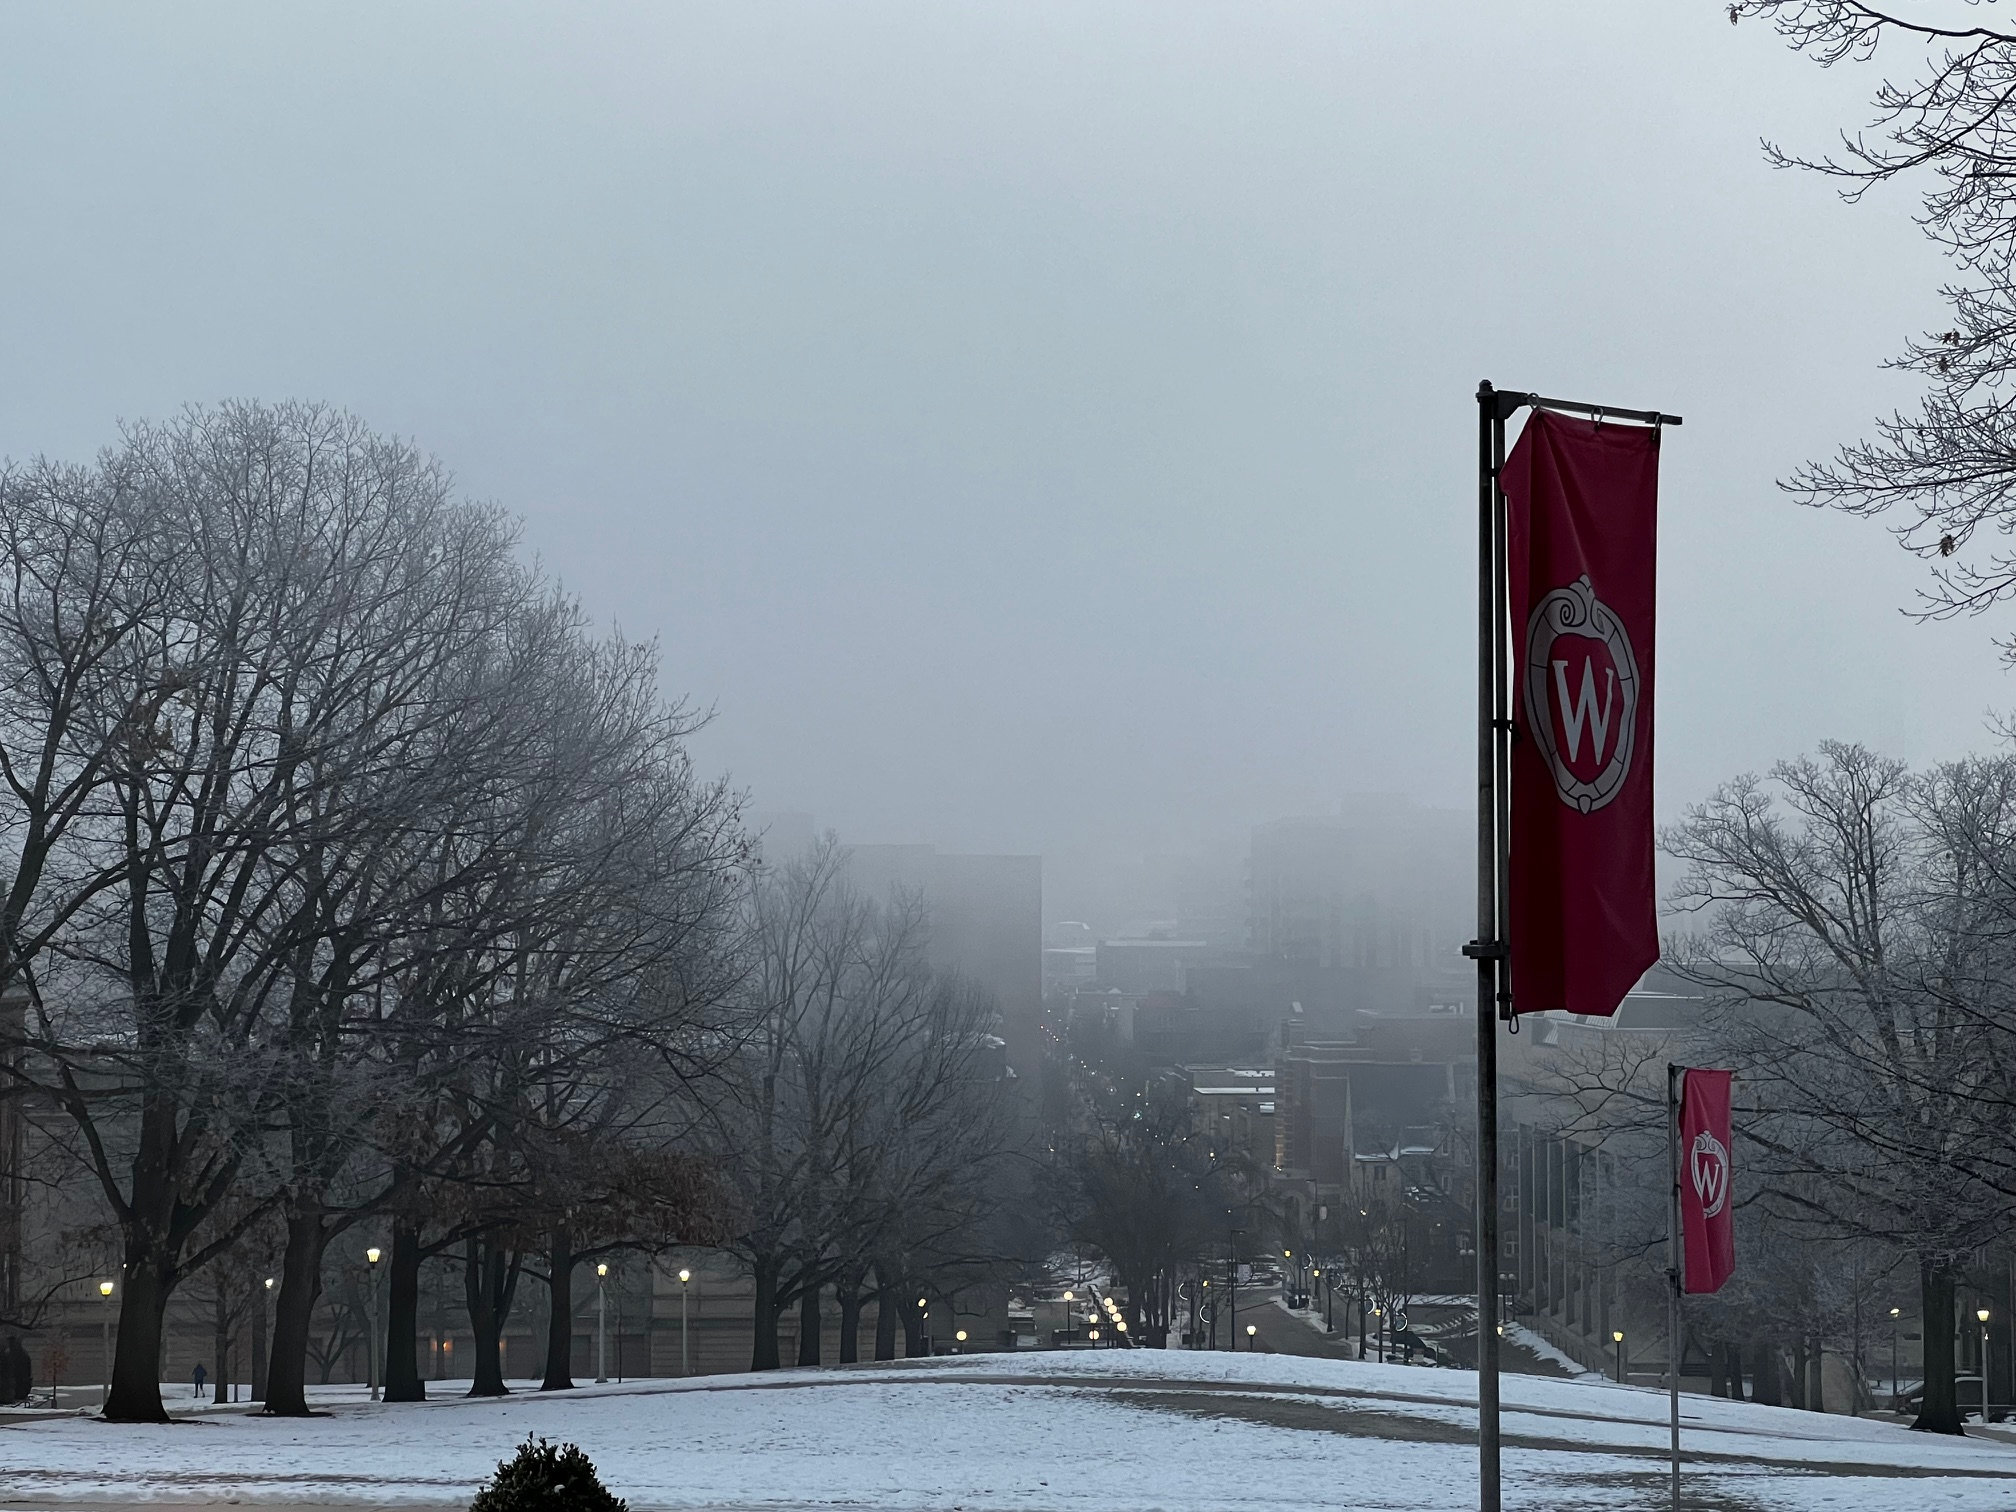
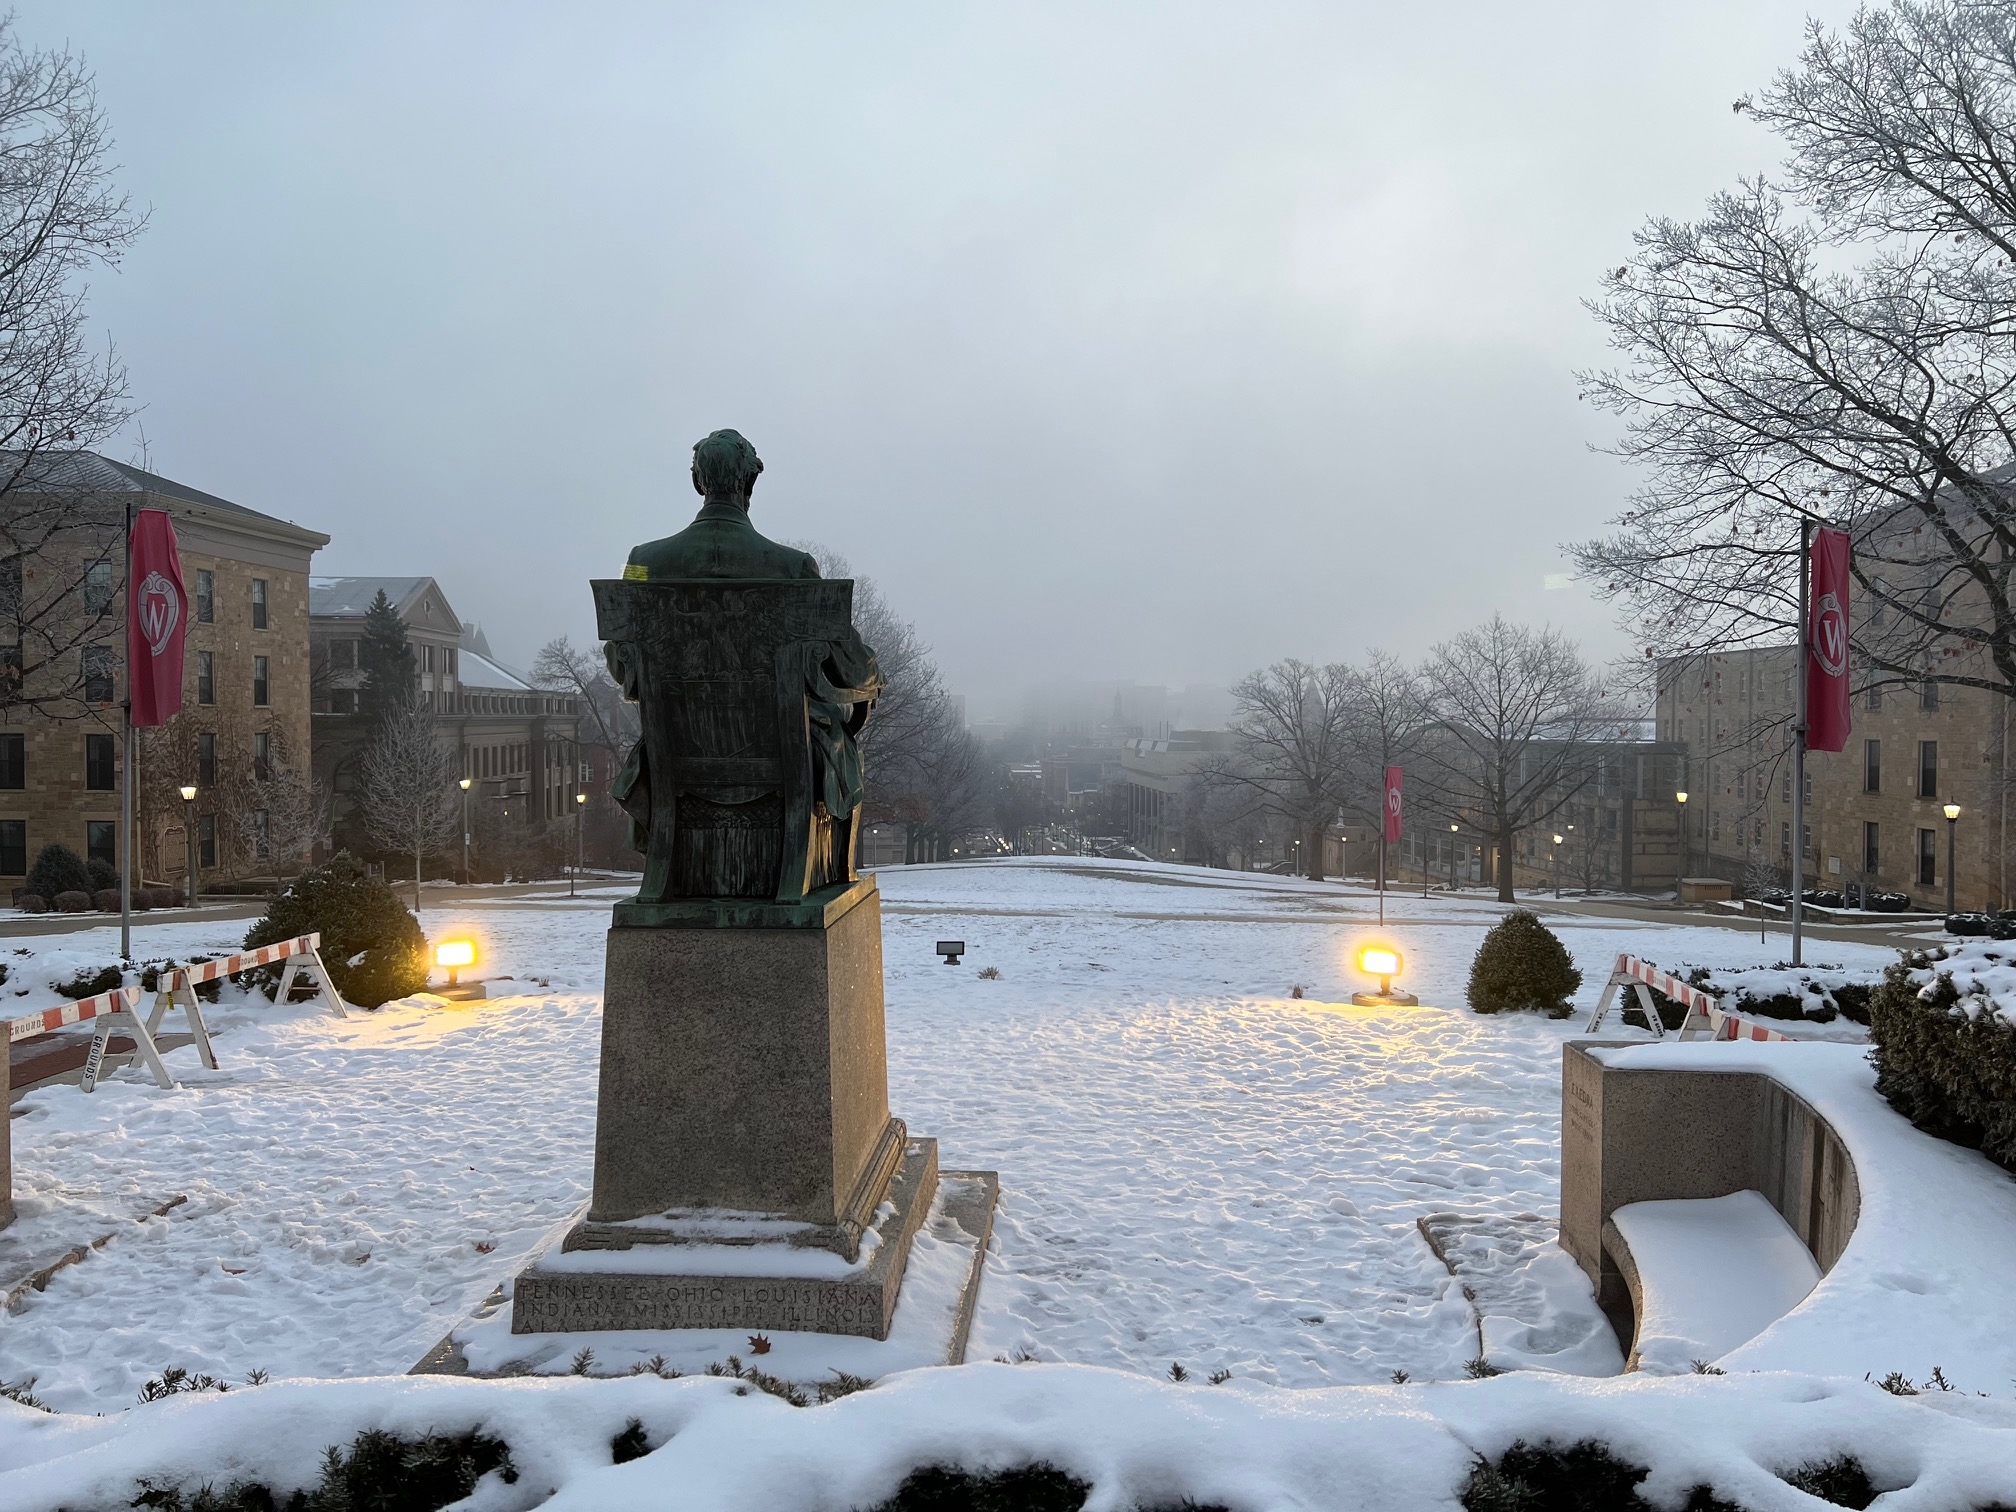
Thanks to Tim Schmit (NOAA/NESDIS/STAR) for bringing this interesting case to our attention (and also taking ground truth photo1 and photo2 of the fog on campus).


