A large and intense storm system moved across the southern US on 25 December 2012, producing a wide variety of weather that included heavy snow from Texas and Oklahoma into Arkansas (HPC storm summary), along with hail, damaging winds,... Read More
Suomi-NPP VIIRS 0.64 µm visible and 11.45 µm IR channel images [click to enlarge]
A large and intense storm system moved across the southern US on
25 December 2012, producing a wide variety of weather that included heavy snow from Texas and Oklahoma into Arkansas (
HPC storm summary), along with hail, damaging winds, and tornadoes from eastern Texas into Alabama (
SPC storm reports).
AWIPS images of 1-km resolution Suomi-NPP VIIRS 0.64 µm visible channel and 11.45 µm IR channel data with overlays of surface reports and the corresponding surface analysis (above) showed great detail in the cloud structure, as well as the variety of weather conditions across the region at 19:41 UTC. At 19:48 UTC, a similar comparison of 1-km resolution MODIS 0.65 µm visible channel, 11.0 µm IR channel, and 6.7 µm water vapor channel images (below) also showed the cloud structure associated with the storm, in addition to the well-defined dry slot associated with an upper level cyclonically-curved jet streak that was wrapping around the base of the storm.
MODIS 0.65 µm visible, 11.0 µm IR, and 6.7 µm water vapor images [click to enlarge]
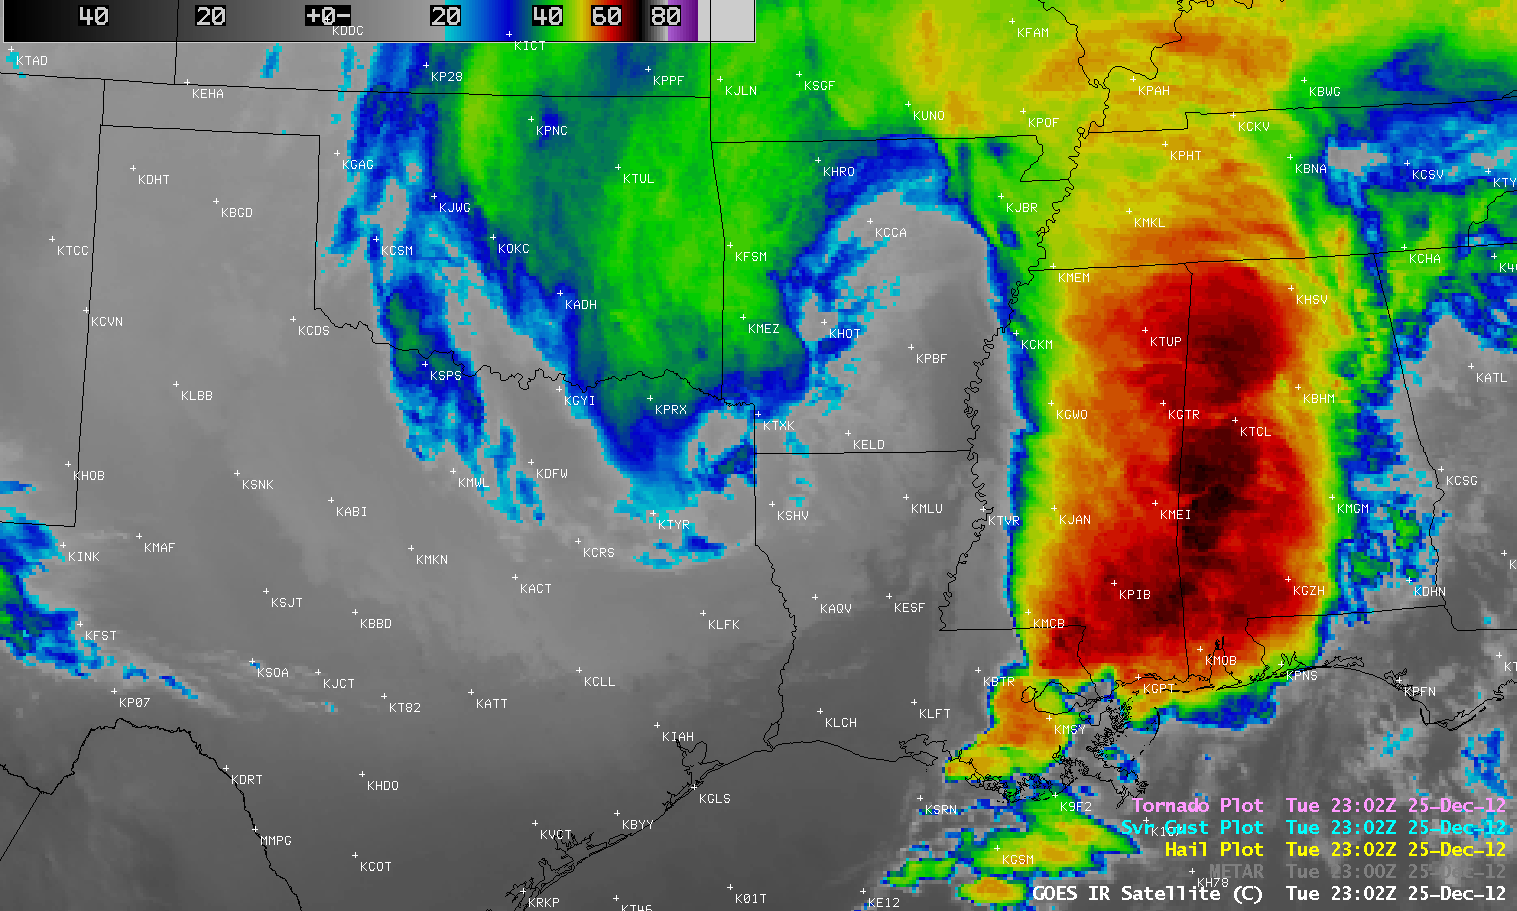
GOES-13 10.7 µm IR channel images
(below; click image to play animation; also available as a QuickTime movie) included overlays of SPC Storm Reports of hail, damaging winds, and tornadoes. This event may turn out to be one of the largest outbreaks of tornadoes on record for Christmas Day — and the EF-3 rated tornado that struck Pearl River County in Mississippi was the
strongest tornado on record for Christmas Day.
")
GOES-13 10.7 µm IR channel images [click image to play animation]
GOES-13 6.5 µm water vapor channel images
(below; click image to play animation; also available as a QuickTime movie) showed the dry slot (associated with the upper-level jet streak) as it approached the rear edge of the squall line which formed in eastern Texas and intensified as it moved eastward into Mississippi and Alabama.
")
GOES-13 6.5 µm water vapor channel images [click image to play animation]
===== 26 December Update =====
Suomi-NPP VIIRS 0.7 µm Day/Night Band and IR brightness temperature difference “Fog/stratus product’ images [click to enlarge]
A “nighttime visible image” provided by the Suomi-NPP VIIRS 0.7 µm Day/Night Band
(above) showed the hook-shaped signature of moonlight-illuminated snow cover across the Texas/Oklahoma Panhandle region and surrounding areas at 07:58 UTC or 1:58 AM local time on 26 December. The corresponding VIIRS IR brightness temperature difference “Fog/stratus product” image showed that while there were some patches of low cloud
(yellow to red color enhancement) in the central and eastern portions of the satellite scene
(as well as high cirrus clouds, black enhancement, approaching from the west), the majority of the bright areas seen on the Day/Night Band image were fresh snow cover.
Later in the day, a comparison of the 19:22 UTC VIIRS 0.64 µm visible channel image with the corresponding false-color Red/Green/Blue (RGB) image (below) demonstrated the value of using RGB images to help discriminate between snow cover (shades of red) and supercooled water droplet cloud features (shades of white). Storm total snowfall amounts in Arkansas were as high as 15.0 inches.
Suomi-NPP VIIRS 0.64 µm visible channel and false-color Red/Green/Blue (RGB) images [click to enlarge]
View only this post
Read Less
")
")

")
")
