MODIS 0.65 µm visible channel and 6.7 µm water vapor channel images
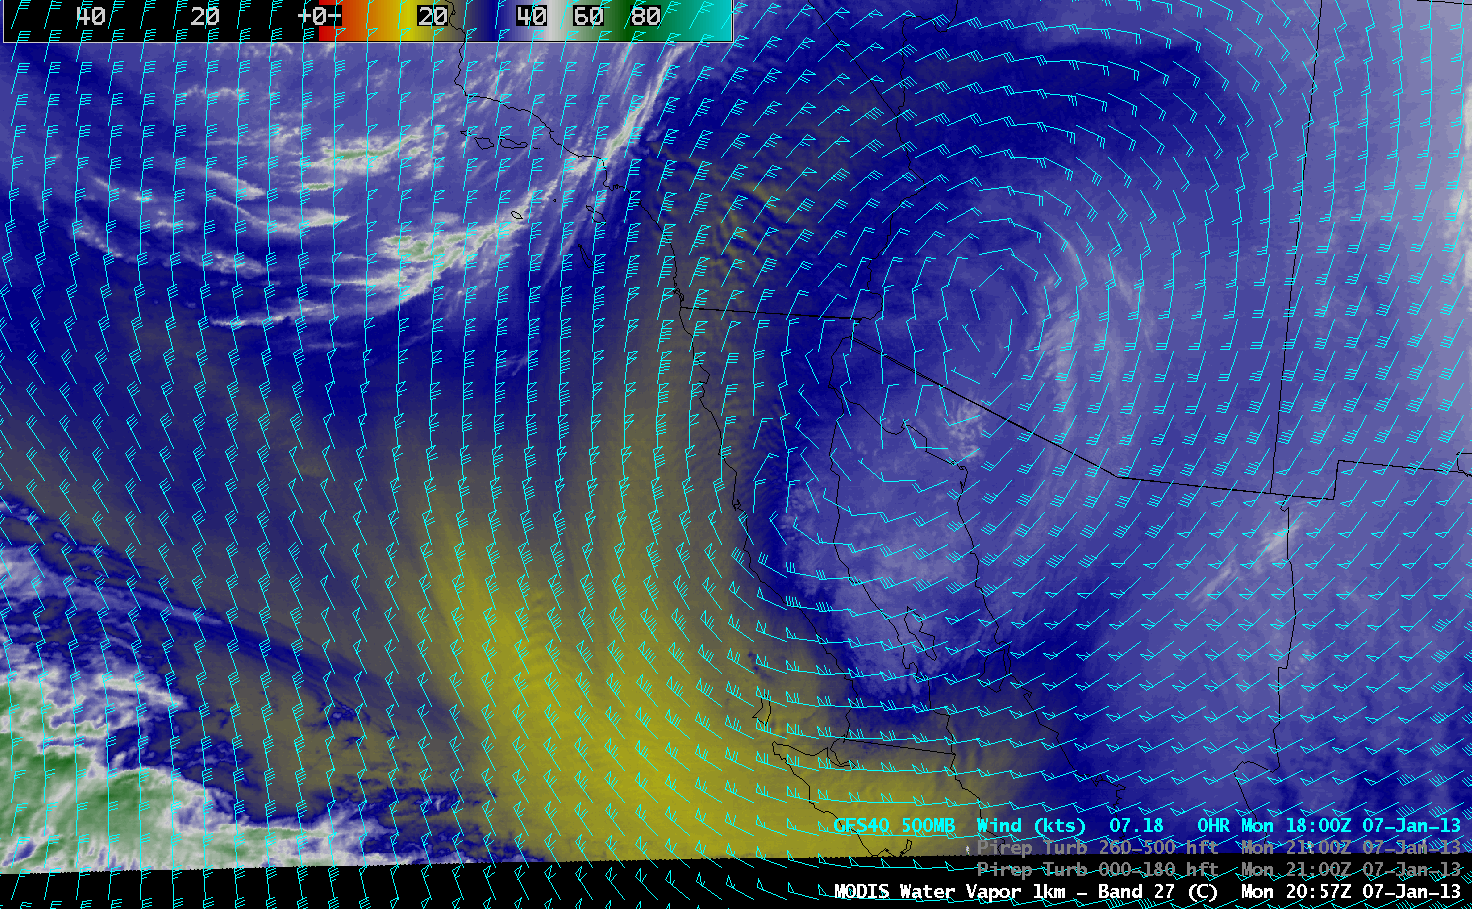
AWIPS images of 1-km resolution 6.7 µm water vapor channel data (above) revealed interesting wave patterns over parts of southern California, Baja California, and the adjacent offshore waters of the Pacific Ocean on 07 January 2013. A comparison with the corresponding 0.65 µm MODIS visible image showed that there were no clouds associated with any of these water vapor wave features. The mountain waves over southern California and northern Baja California were caused by strong winds on the western periphery of an upper-level low pressure system — and there were isolated pilot reports of moderate turbulence over southern California at the 30,000-34.000 foot altitude range.
Also of interest is the “bow shock wave” feature seen on the water vapor image, which fans out downwind (southward) of Guadalupe Island (station identifier 76151). These waves were caused by the interaction of lower-tropospheric winds from the north interacting with the high terrain of the volcanic island (whose highest point is Mount Augusta at 4257 feet or 1298 meters). Lower-tropospheric satellite winds off the west coast of Baja California were as strong as 37 knots at the 812 hPa pressure level.
McIDAS images of 4-km resolution GOES-15 6.5 µm water vapor channel data (below; click image to play animation) suggested that there was strong middle-tropospheric subsidence over the region surrounding Guadalupe Island — as seen by the warming/drying trend (the transition to brighter yellow colors) — which allowed the weighting function of the water vapor channel to peak at lower altitudes in order to detect the lower-level signature of the bow shock wave.
GOES-15 6.5 µm water vapor channel images (click image to play animation)
View only this post Read Less

")
