A comparison of AWIPS images of 1-km resolution MODIS 0.65 µm visible, 11.0 µm IR, and 6.7 µm water vapor channel data (above) showed a textbook example of a “baroclinic leaf” satellite signature associated with the large storm affecting much of the eastern US on Read More
MODIS 0.65 µm visible channel, 11.0 µm IR channel, and 6.7 µm water vapor channel images
A comparison of AWIPS images of 1-km resolution MODIS 0.65 µm visible, 11.0 µm IR, and 6.7 µm water vapor channel data (above) showed a textbook example of a “baroclinic leaf” satellite signature associated with the large storm affecting much of the eastern US on 17 January 2013. The baroclinic leaf represents a region of ascending air that originates at low levels on the warm side of the primary surface cold front (18 UTC surface analysis).
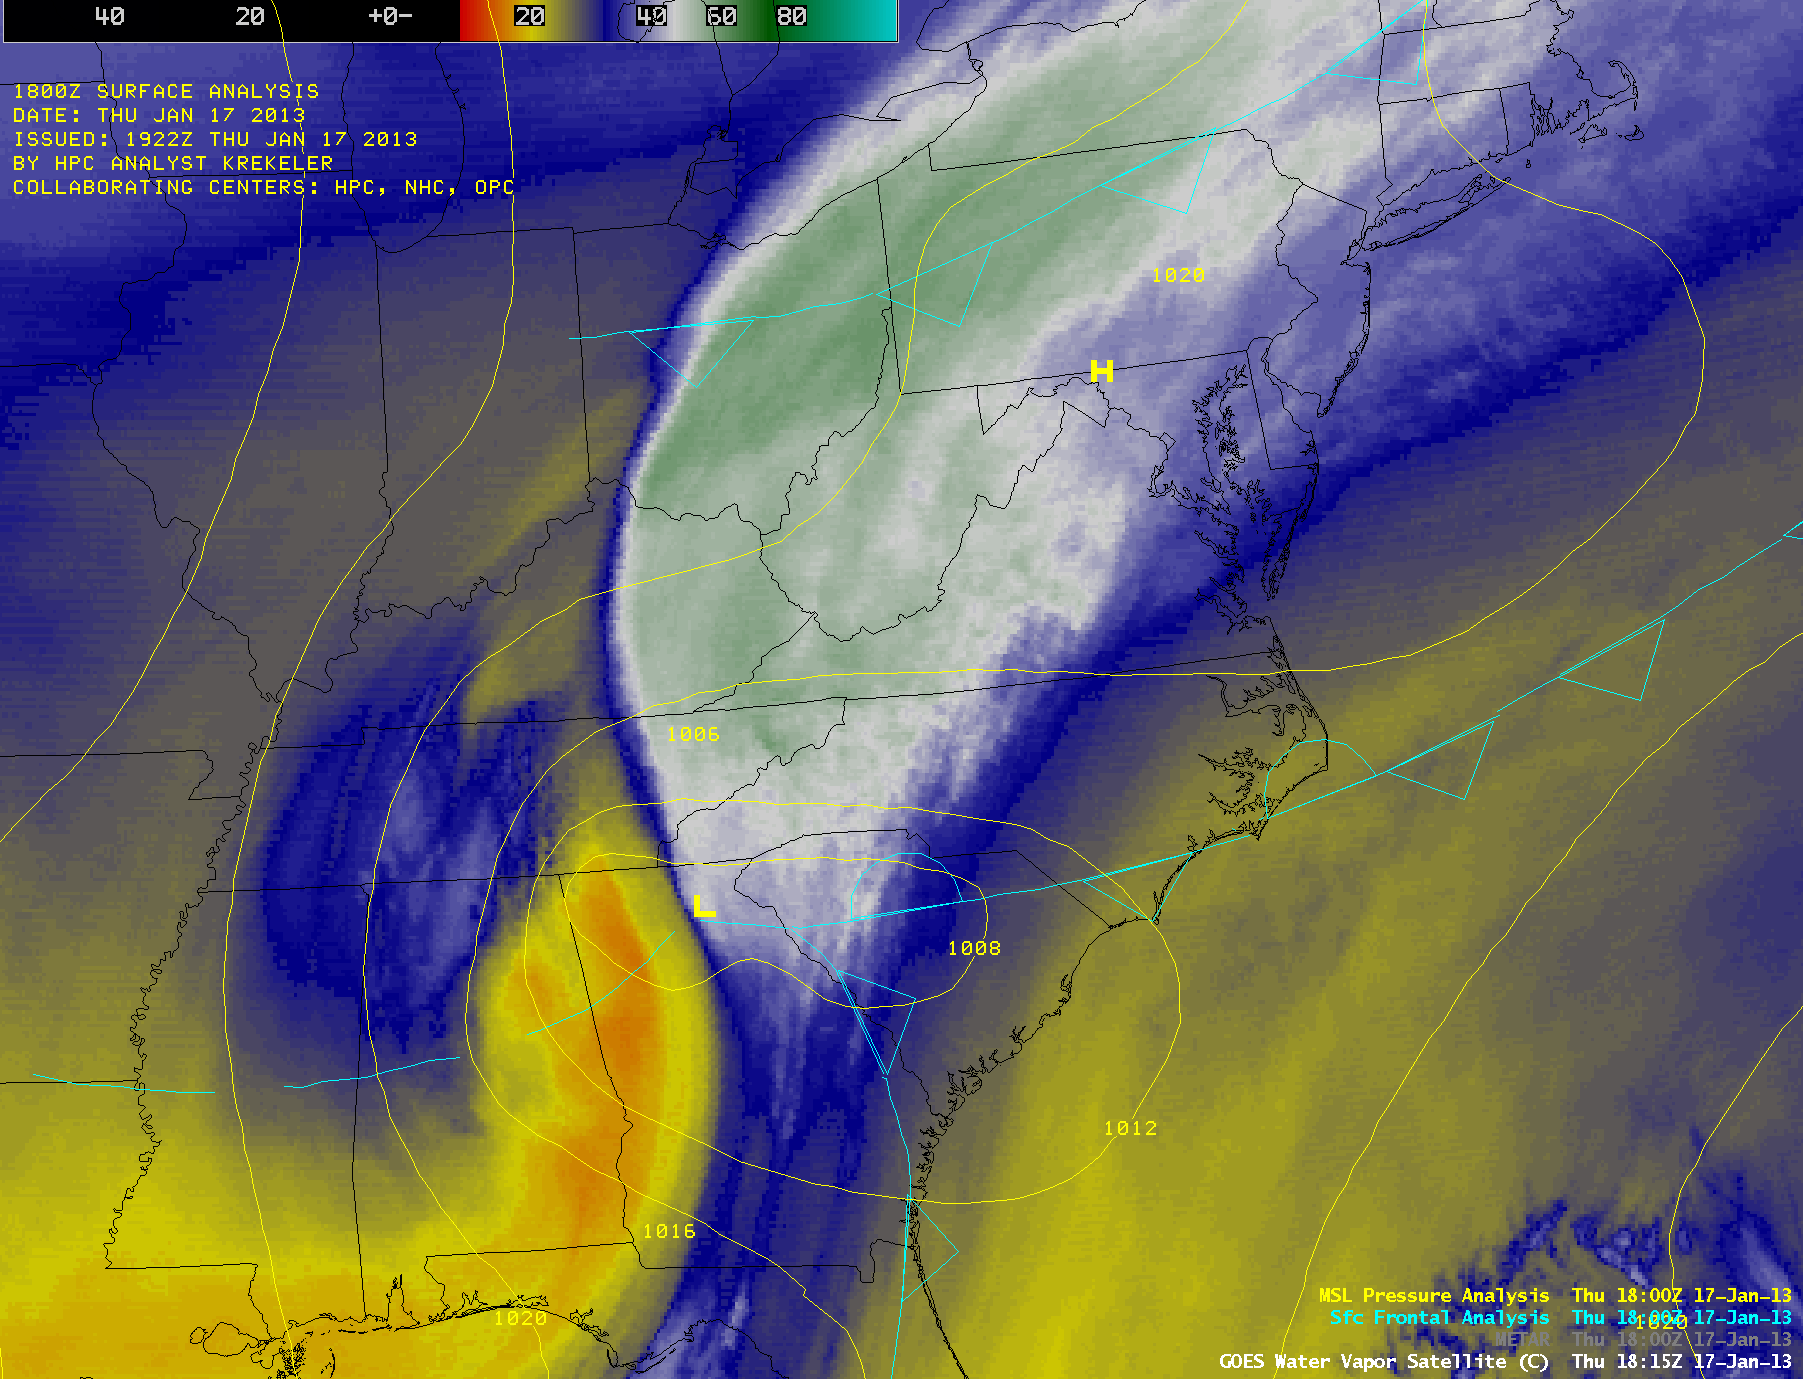
4-km resolution GOES-13 6.5 µm water vapor channel images (below; click image to play animation) showed the development several important satellite signatures: (1) the baroclinic leaf; (2) the primary warm conveyor belt;, (3) the cold conveyor belt (which was helping to produce snow across parts of northern Mississippi and Alabama); and (4) a secondary warm conveyor belt after about 19 UTC. For additional information on conveyor belts, see this blog post from January 2011.
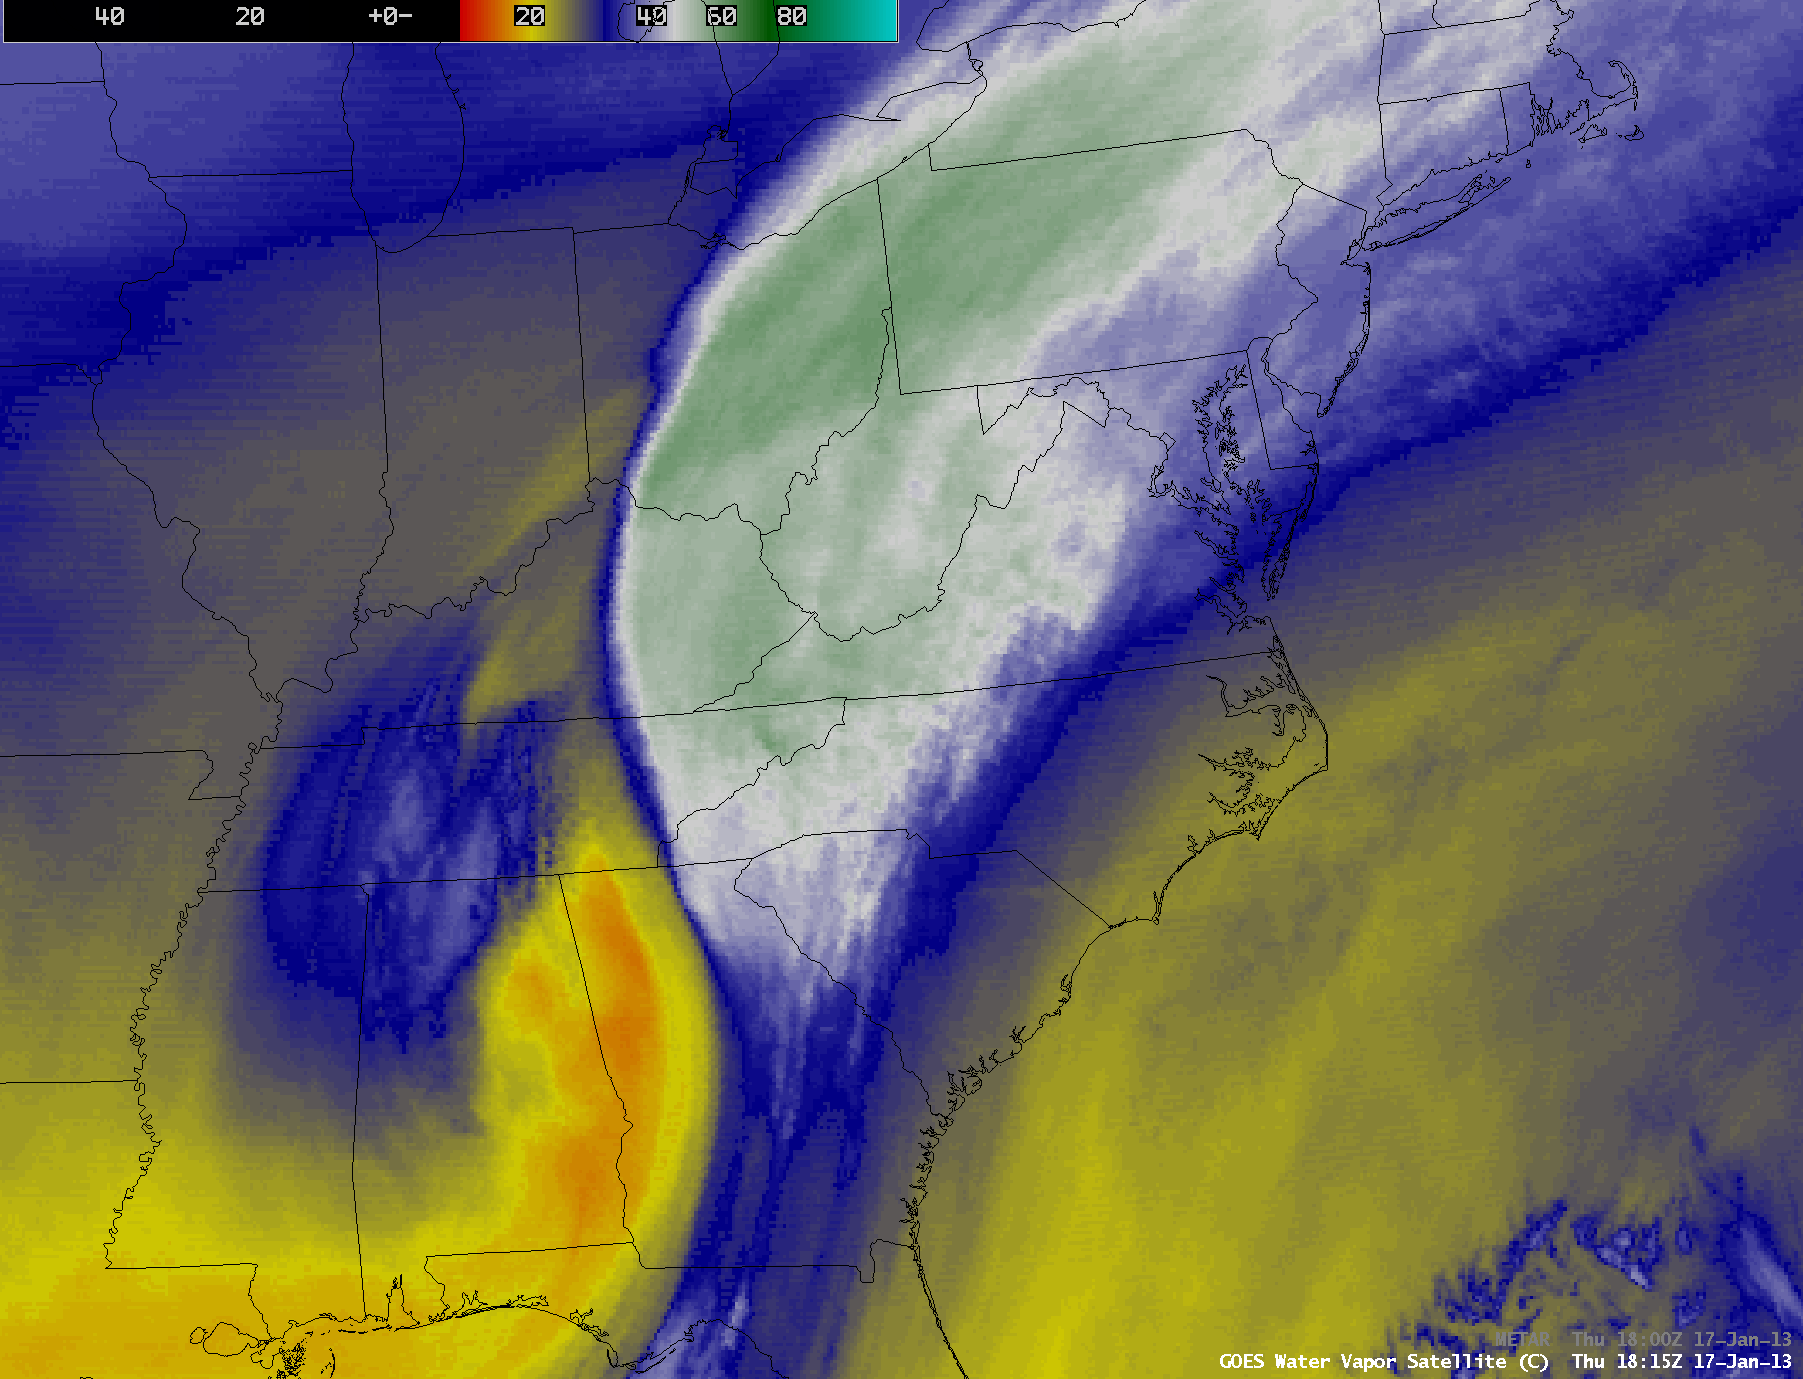
GOES-13 6.5 µm water vapor channel images (click image to play animation)
A McIDAS-V representation of the GOES-13 (GOES-East) water vapor image brightness temperatures as a topographical surface (below; click image to play animation; also available as a QuickTime movie) helps to visualize the descending intrusion of dry air (which exhibited warm brightness temperatures, yellow to orange color enhancement) and the ascending streams of moist air (which exhibited blue to white to green colors)Â within the warm conveyor belt and baroclinic leaf structures.
")
GOES-13 6.5 µm water vapor images (click image to play animation)
Another McIDAS-V visualization (below; click image to play animation) shows the 3-dimensional structure of the various jet streams (cyan isosurface of 50 meters per second or higher winds) and the increasing values and ascending height of moisture (mixing ratio) within the primary warm conveyor belt as the cross section slice is moved from south to north. McIDAS-V images courtesy of Joleen Feltz and Mike Hiley (CIMSS).
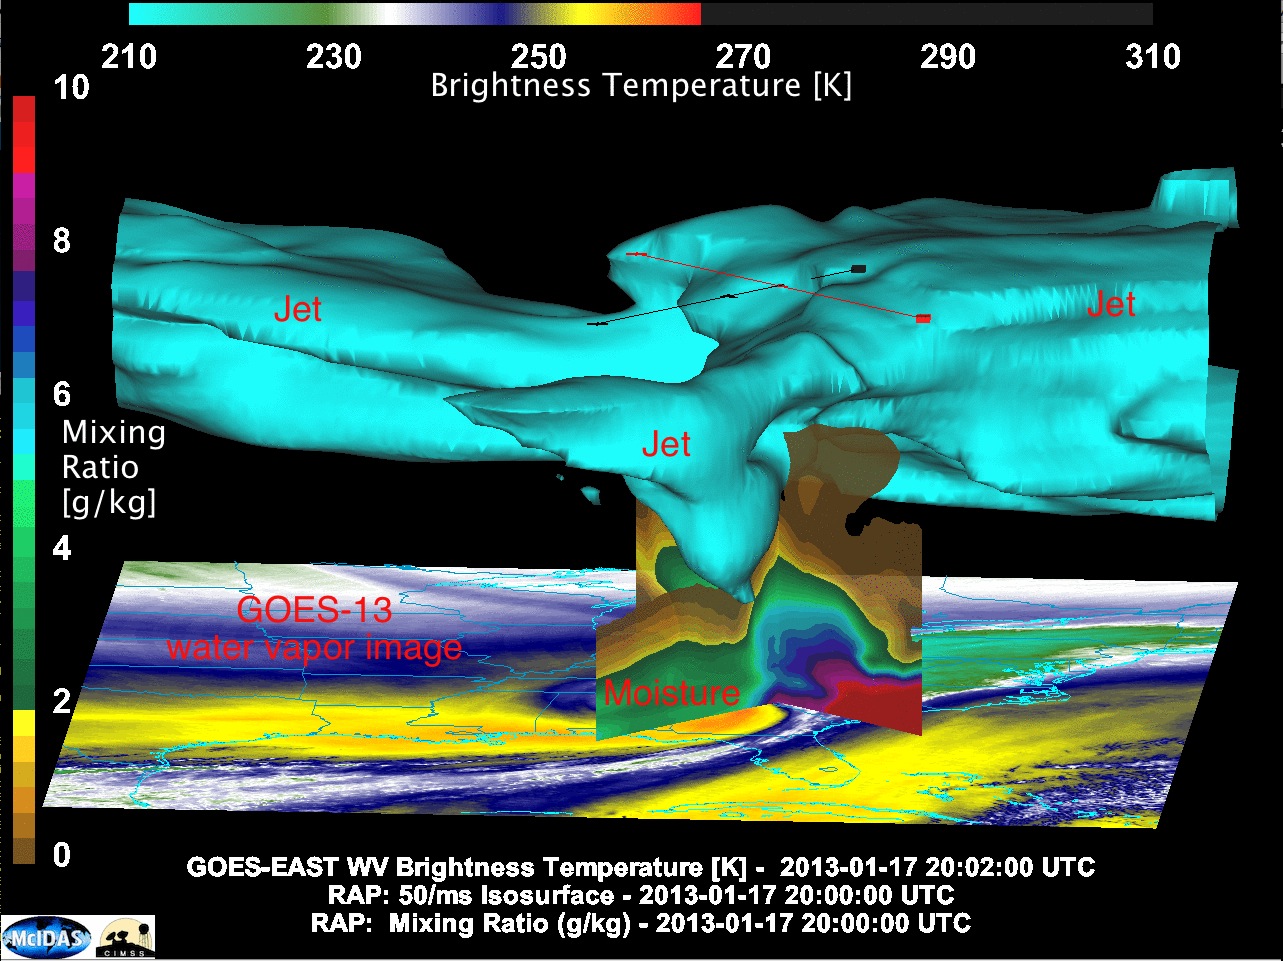
GOES-13 water vapor image with Rapid Refresh model fields of wind speed and mixing ratio (click image to play animation)
Early in the day, a SIGMET was issued (below) to outline an area of risk for severe turbulence due to wind shear near the axis of the strong jet stream associated with this developing system.

GOES-13 6.5 µm water vapor image with outline of Turbulence SIGMET and Pilot reports of turbulence
===== 18 January Update =====
A comparison of AWIPS images of Suomi NPP VIIRS 0.64 µm visible channel and the corresponding VIIRS false-color Red/Green/Blue (RGB) image (below) aided in the discrimination of the resulting snow cover from the storm (shades of red) versus clouds (shades of white).
Suomi NPP VIIRS 0.64 µm visible channel and False-color Red/Green/Blue (RGB) images
View only this post
Read Less
")
")
")
