 and GOES-13 (right) 0.63 µm visible channel images (click image to play animation)")
GOES-15 (left) and GOES-13 (right) 0.63 µm visible channel images (click image to play animation)
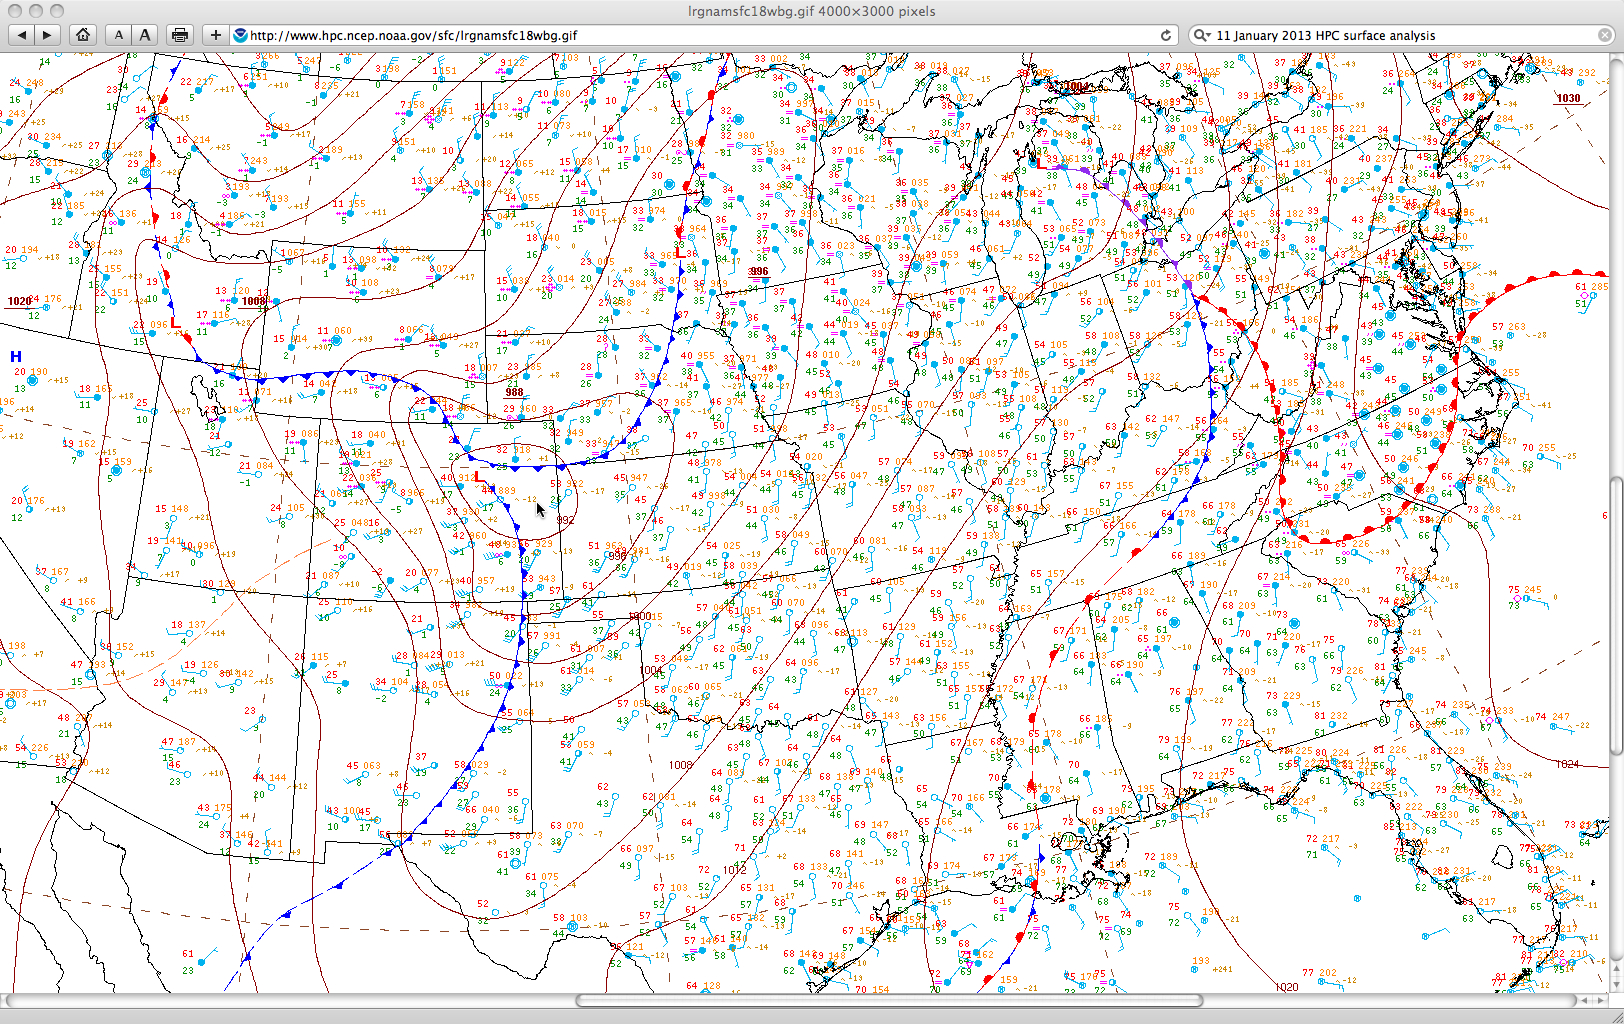
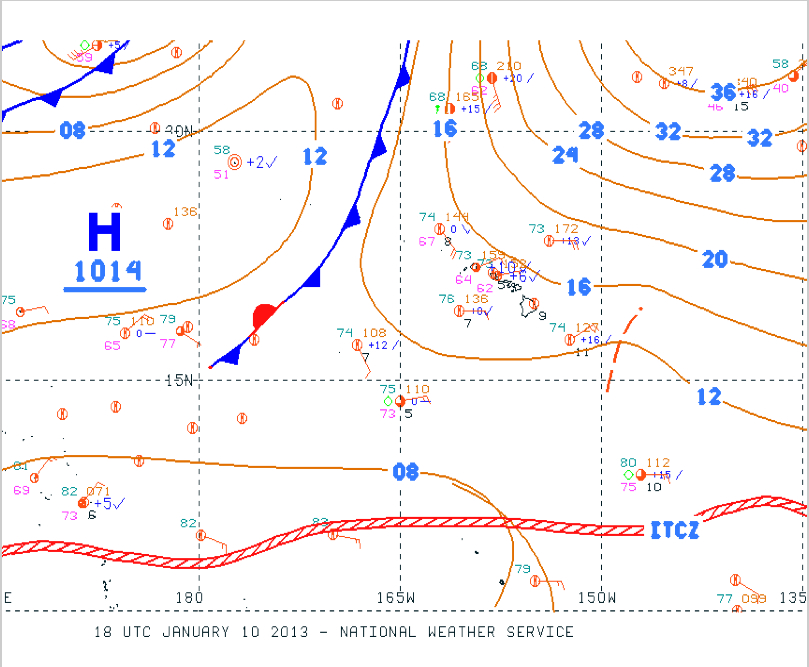
McIDAS images of GOES-15 (GOES-West) and GOES-13 (GOES-East) 0.63 µm visible channel data (above; click image to play animation) showed the development of a large area of blowing dust that formed in response to high winds along and in the wake of a strong cold frontal boundary (18 UTC surface analysis) that was moving from eastern Colorado into western Kansas on 11 January 2013. Winds gusted to 56 mph in Burlington, Colorado and gusted to 49 mph in Goodland, Kansas (where the surface visibility was reduced to 1.75 miles by the blowing dust).
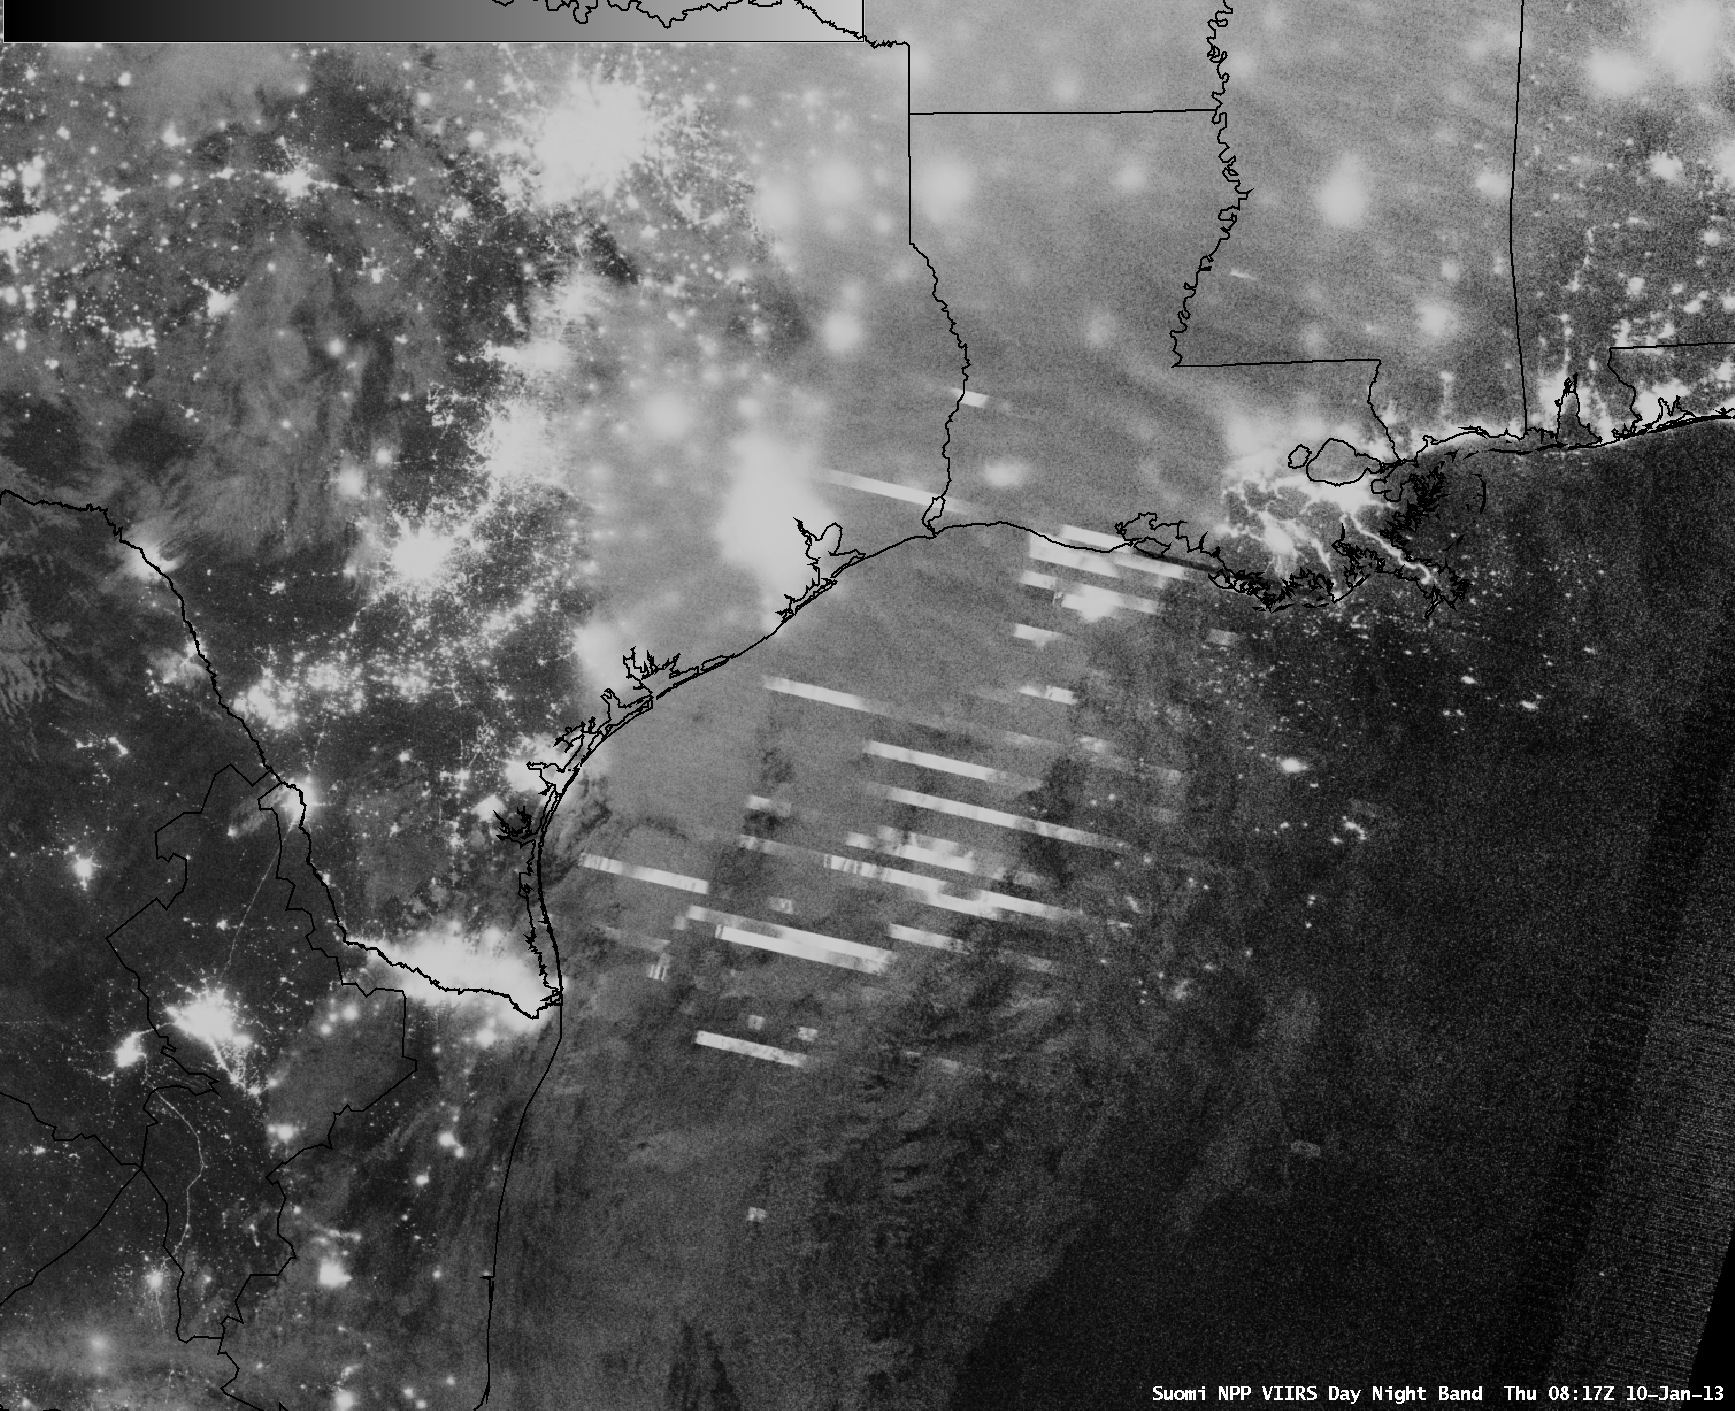
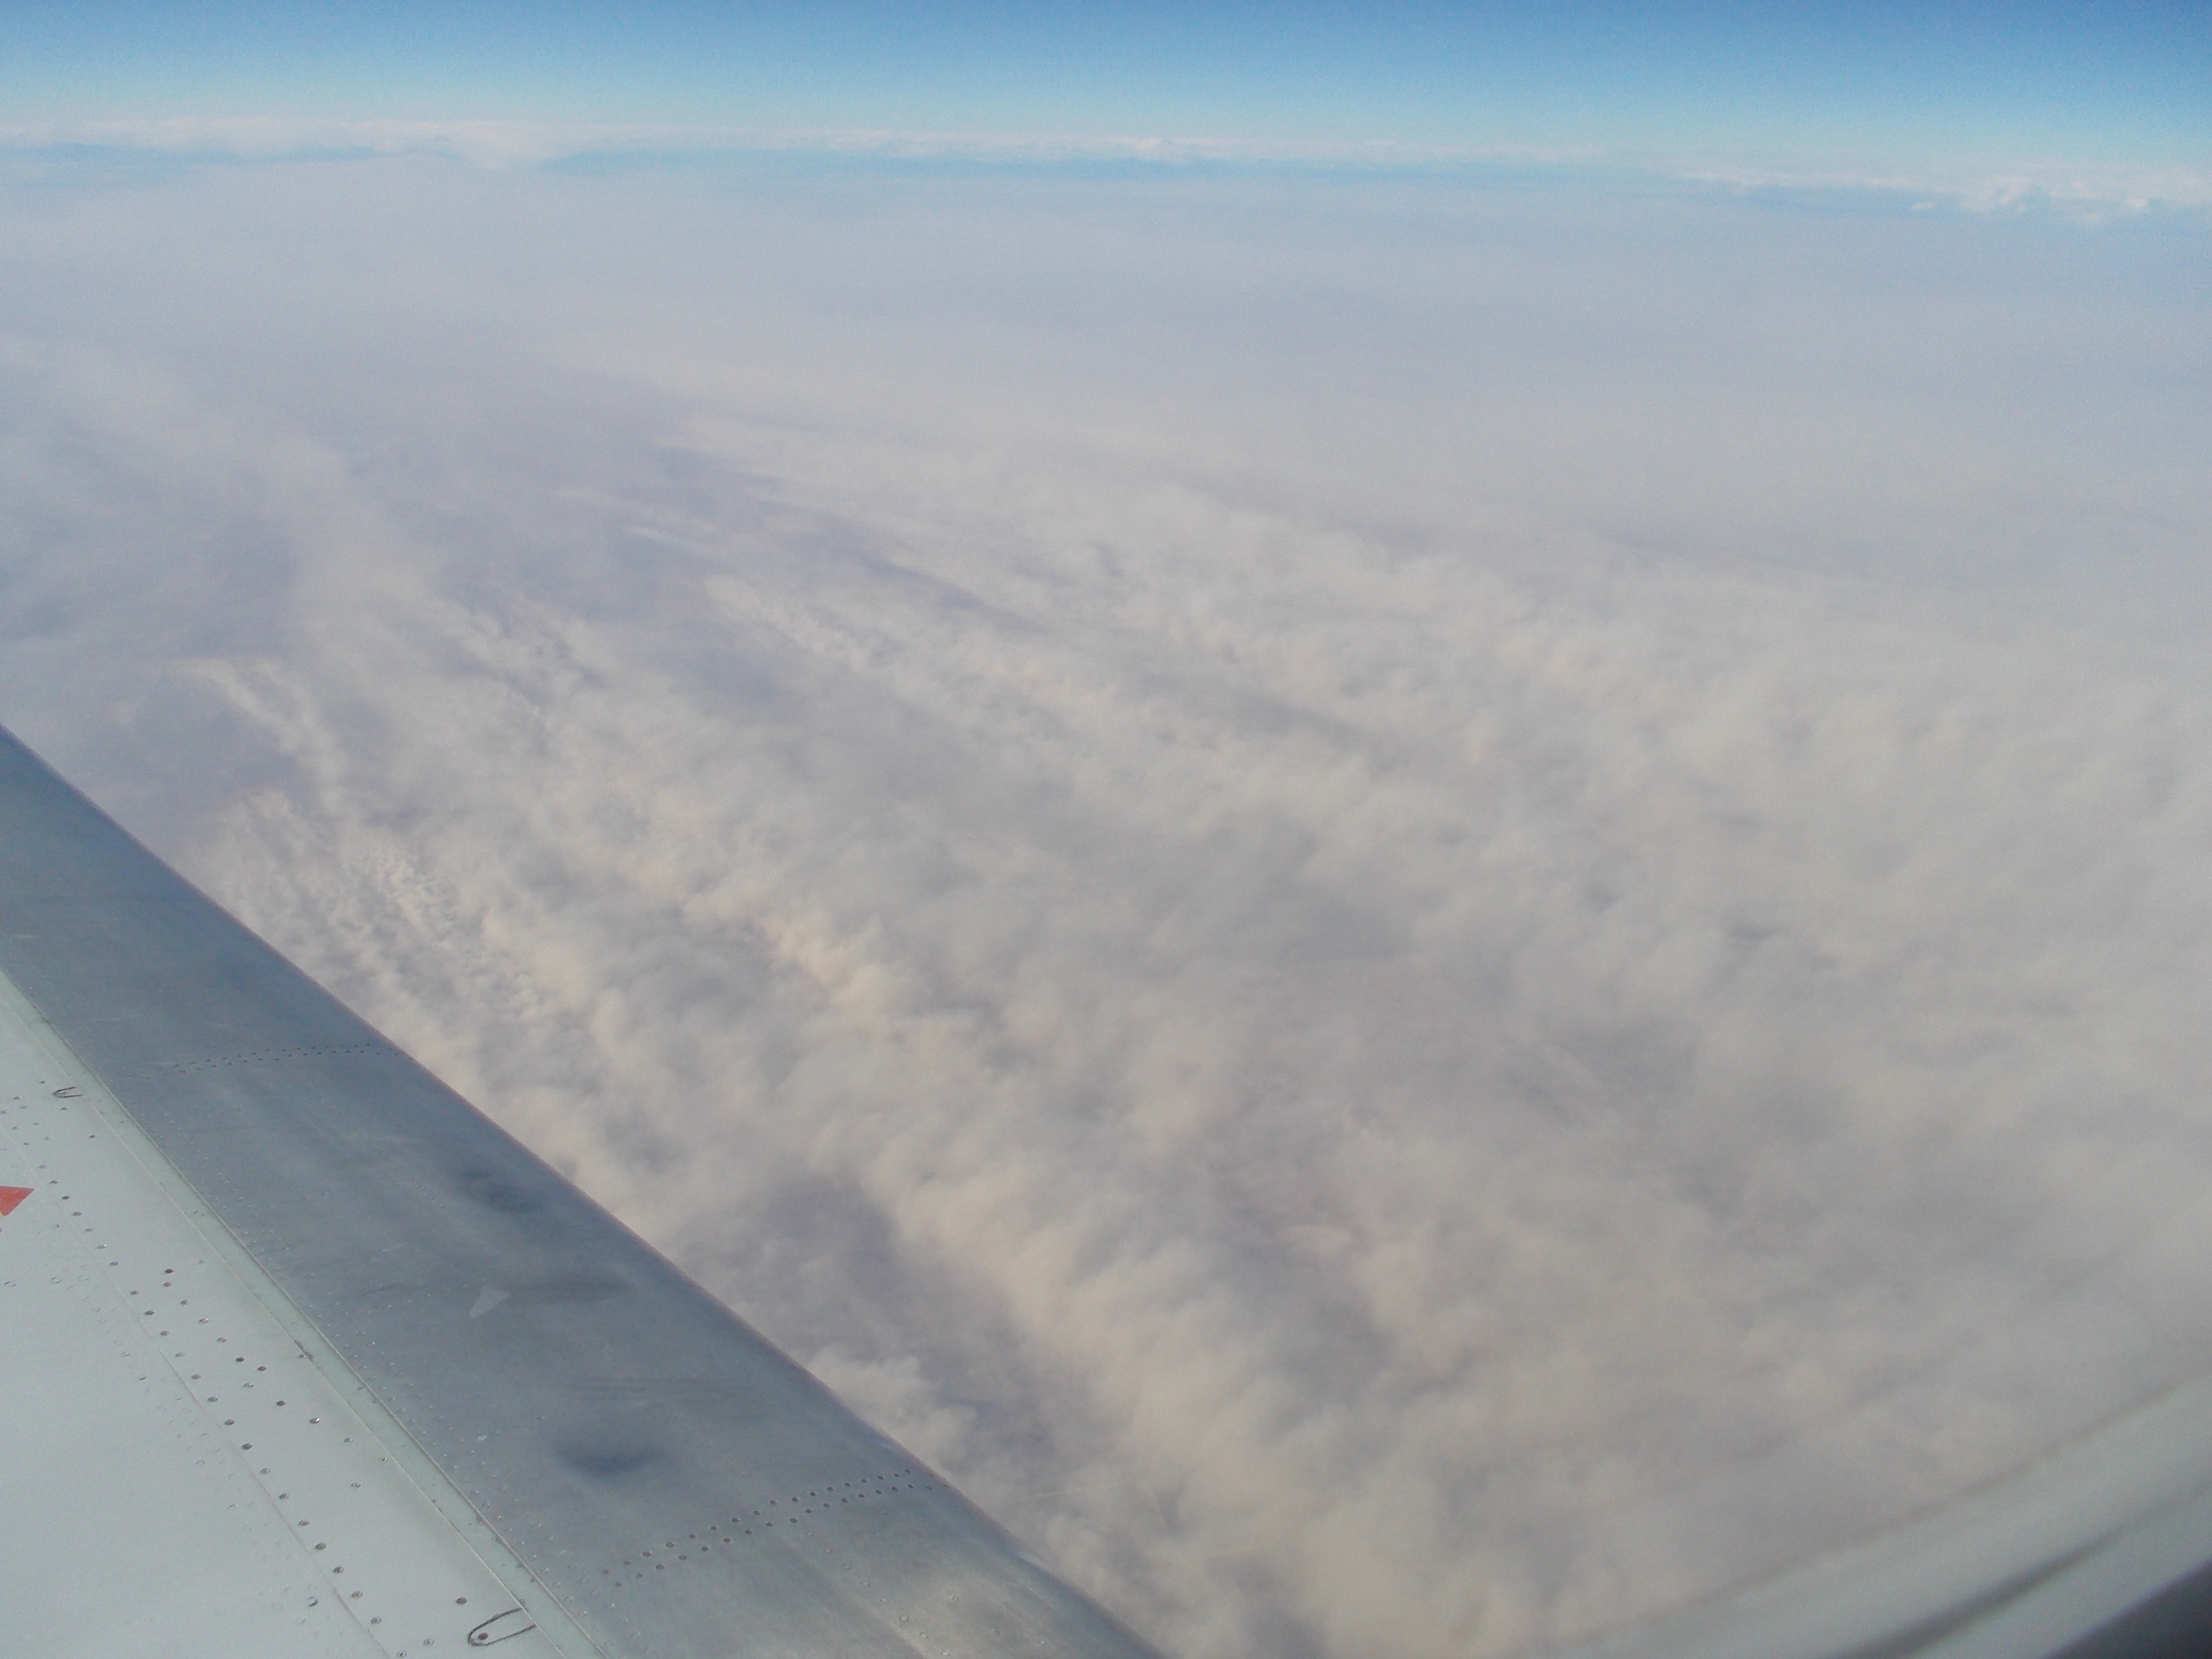
A closer view using 375-meter resolution (projected onto a 1-km AWIPS grid) Suomi NPP VIIRS 0.64 µm visible channel and the corresponding false-color Red/Green/Blue (RGB) image at 19:23 UTC or 12:23 PM local time (below) revealed the banded structure of the blowing dust cloud, which was verified by a photo taken around 19:17 UTC from an aircraft over eastern Colorado by William Straka (CIMSS). Also evident on the VIIRS images was the presence of a number of aircraft dissipation trails (or “distrails”) and “hole punch clouds” across parts of central and eastern Kansas. The brighter pink color enhancement within the distrails and hole punch clouds indicated the glaciation of supercooled water droplets in those portions of the cloud deck that were penetrated by aircraft.
 image")
Suomi NPP VIIRS 0.64 µm visible channel and false-color Red/Green/Blue (RGB) image
In a comparison of a 20:33 UTC (or 1:33 PM local time) MODIS 0.65 µm visible image with the corresponding MODIS 11-12 µm IR brightness temperature difference (below), the most dense areas of blowing dust were highlighted by the lighter cyan colors.

MODIS 0.65 µm visible channel and 11-12 µm IR brightness temperature difference product
View only this post Read Less

