A comparison of AWIPS images of Suomi NPP VIIRS 0.64 µm visible channel and false-color Red/Green/Blue (RGB) images (above) showed areas of fog and stratus clouds over portions of the Pacific Northwest region of the US, the adjacent offshore waters of the Pacific Ocean, and far southwestern Canada at 20:15... Read More
Suomi NPP VIIRS 0.64 µm visible channel and false-color Red/Green/Blue (RGB) image
A comparison of AWIPS images of Suomi NPP VIIRS 0.64 µm visible channel and false-color Red/Green/Blue (RGB) images (above) showed areas of fog and stratus clouds over portions of the Pacific Northwest region of the US, the adjacent offshore waters of the Pacific Ocean, and far southwestern Canada at 20:15 UTC or 12:15 PM local time on 19 January 2013. On the false-color RGB image, snow cover appeared as darker shades of red, bare ground was varying shades of cyan, and fog and cloud features were brighter shades of white. Persistent high pressure over this region for several days led to strong temperature inversions that acted to trap the fog and stratus in lower elevations, leading to poor air quality at some locations.
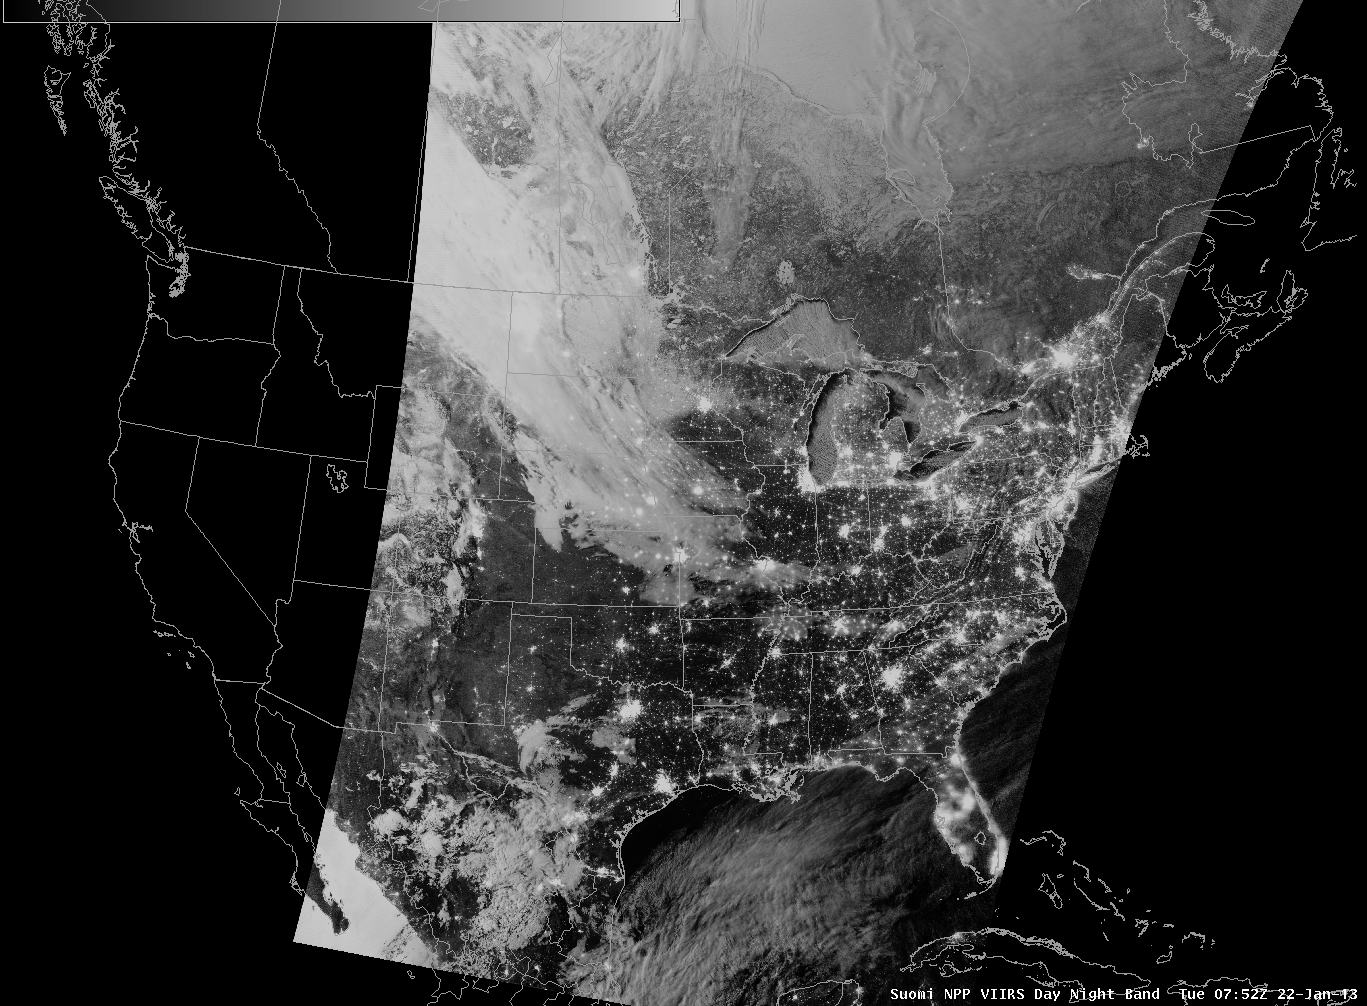
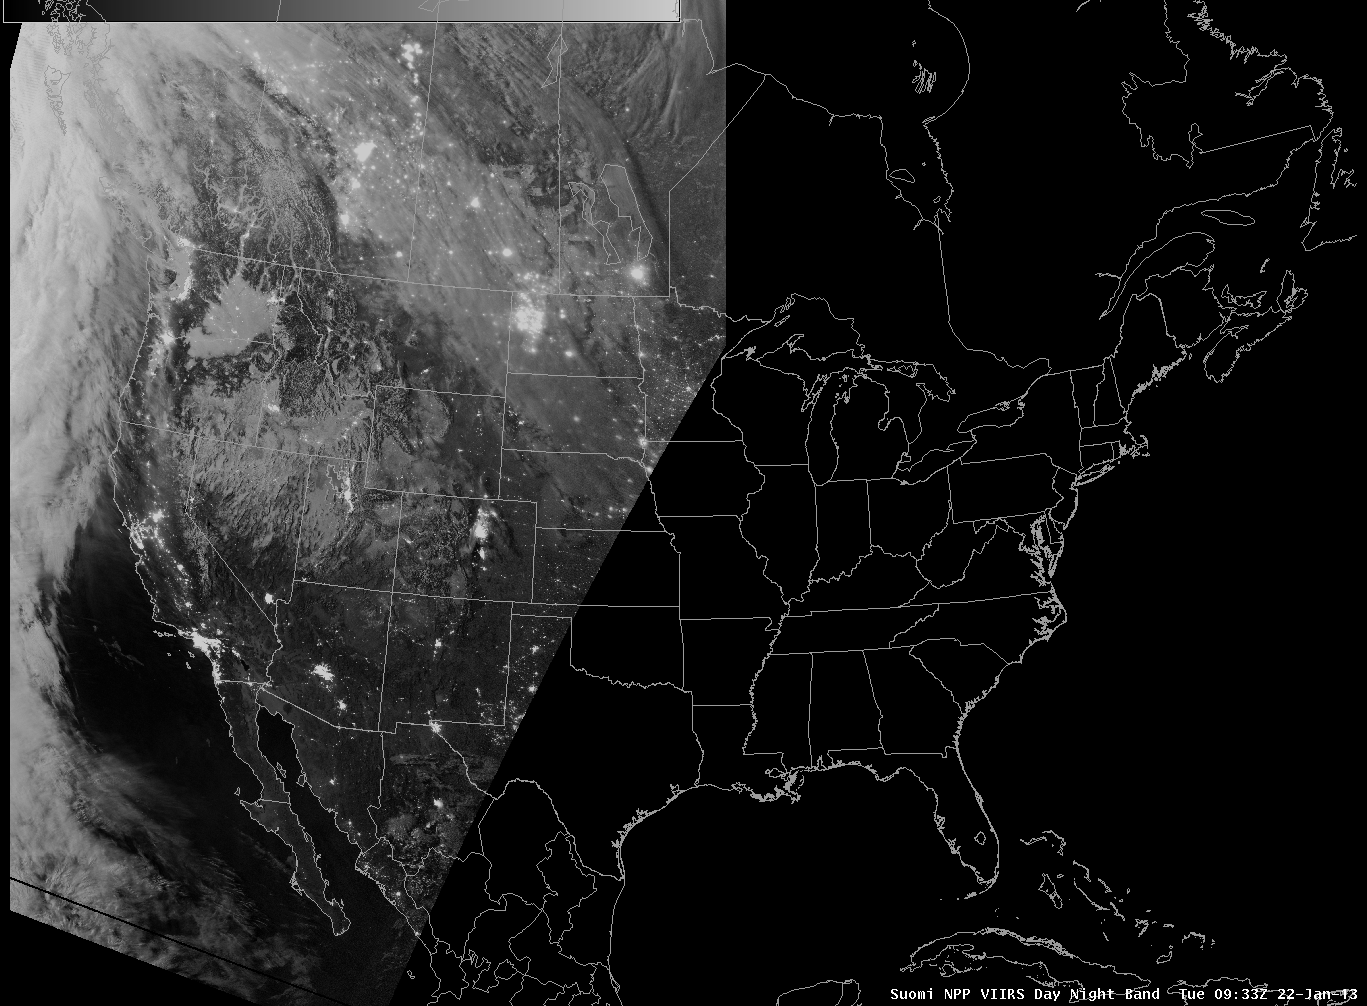
During the following night-time hours, a comparison of 1-km resolution Suomi NPP VIIRS and 4-km resolution GOES IR brightness temperature difference (BTD) “fog/stratus product” images just after 10 UTC or 2 AM local time (below) indicated that many of the fog and low cloud features seen during the previous day had persisted into the night. The higher spatial resolution of the VIIRS image revealed ship tracks in the stratus deck offshore, and helped to better define the areal coverage of inland fog/stratus features (especially those in narrow river valleys).
Suomi NPP VIIRS and GOES IR brightness temperature difference “fog/stratus product” images
Although the “fog/stratus product” has some utility in locating those particular features, it cannot discriminate between fog on the ground and elevated stratus decks. However, examples of three Fog and Low Stratus (FLS) products that blend satellite data with model fields to offer more quantitative information are shown below: (1) Instrument Flight Rules (IFR) probability, (2) Low Instrument Flight Rules (LIFR) Probability, and (3) Cloud Thickness products. For the FLS features over Washington state, there were some areas where IFR probabilities were greater than 90%, LIFR probabilities were greater than 70%, and Cloud Thickness values were 1000 feet or greater. For the FLS feature located over southeastern Washington, these products would be valuable for aviation guidance purposes (given the relatively sparse network of observations in that part of the state).
GOES-15 IFR Probability product
GOES-15 Low IFR Probability product
GOES-15 Cloud Thickness product
A sequence of GOES-15 IFR Probability product images (below; click image to play animation) indicated that the areal coverage of higher IFR probability values had been gradually increasing during the 6 hour period leading up to 10:15 UTC or 2:15 AM local time.
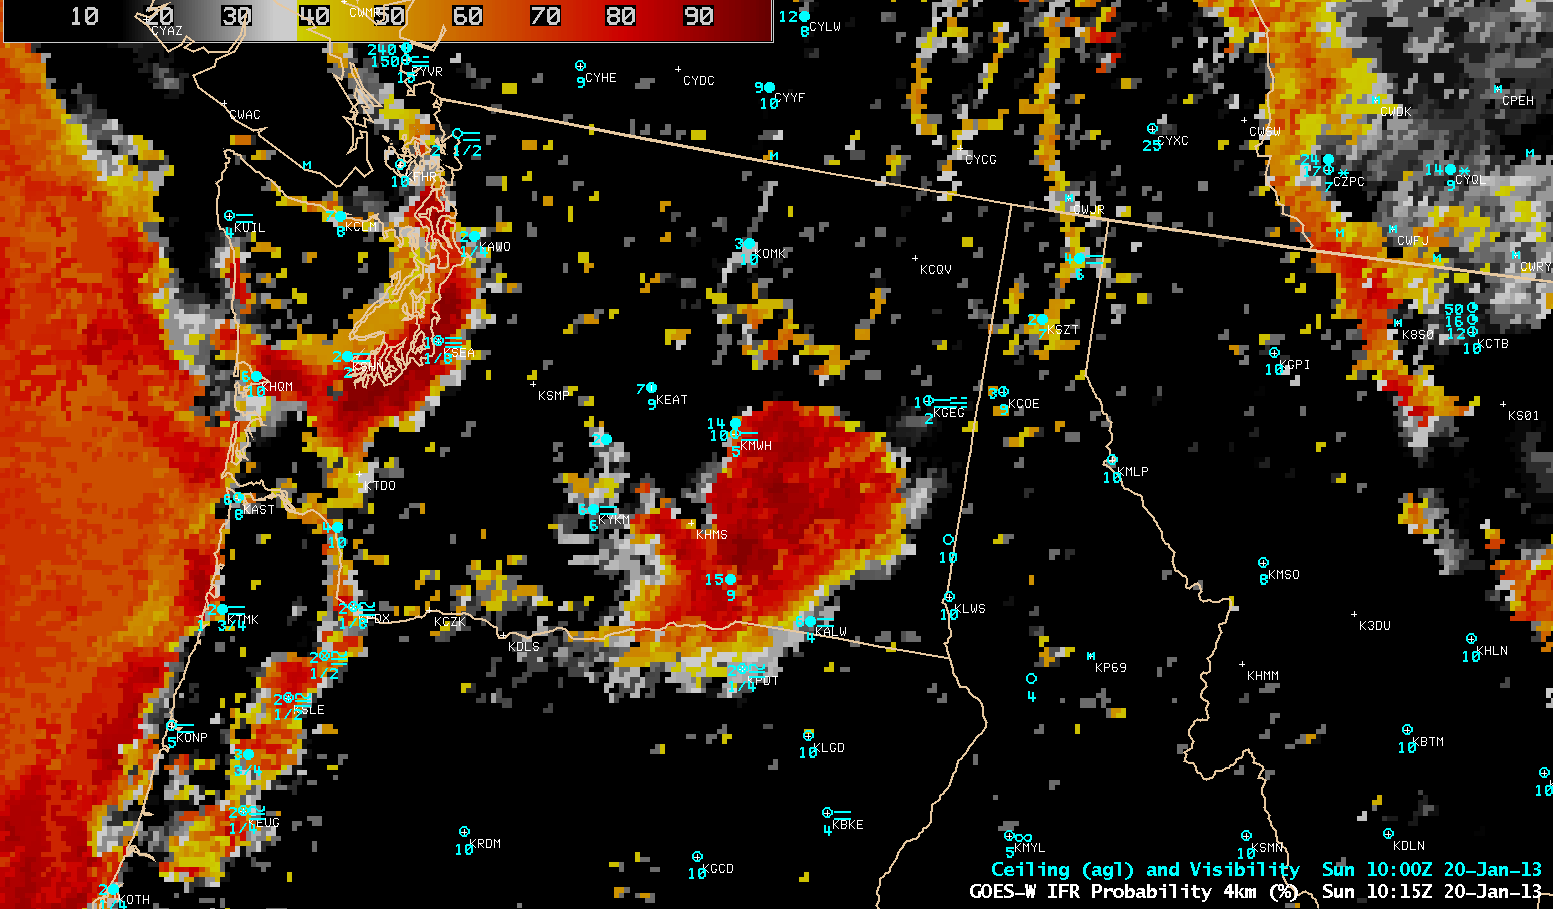
GOES-15 IFR Probability product (click image to play animation)
View only this post
Read Less


