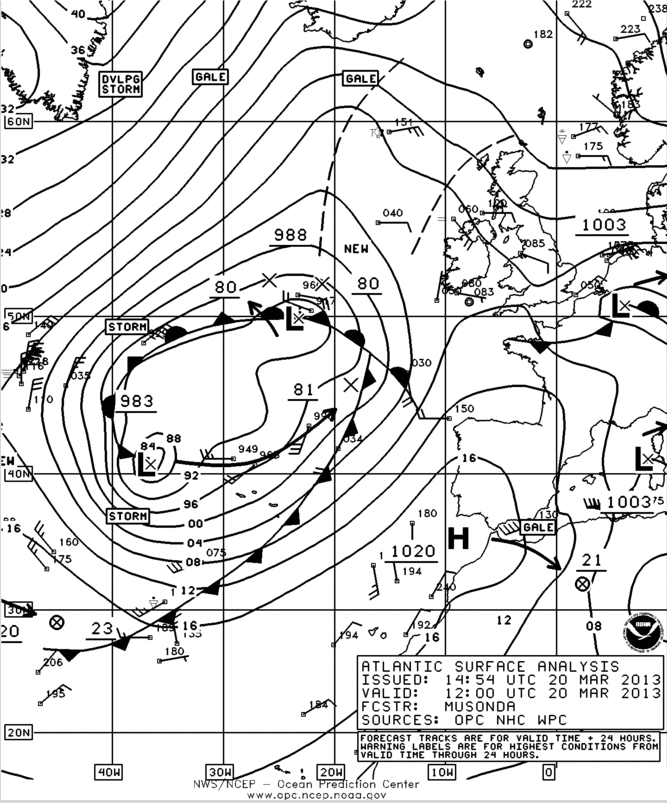
This website works best with a newer web browser such as Chrome, Firefox, Safari or Microsoft Edge. Internet Explorer is not supported by this website.

“Sting Jet” signature associated with a high wind event in Scotland

A rapidly intensifying mid-latitude cyclone (named “Cyclone Ulli” by the Europeans | surface analysis) was responsible for a high wind event as it moved over Scotland on 03 January 2012.... Read More

EUMETSAT Meteosat-9 7.35 µm water vapor channel images (click image to play animation)

EUMETSAT Meteosat-9 Water Vapor (7.35 µm) images (click image to play animation)

A rapidly intensifying mid-latitude cyclone (named “Cyclone Ulli” by the Europeans | surface analysis) was responsible for a high wind event as it moved over Scotland on 03 January 2012. A sequence of EUMETSAT Meteosat-9 Water Vapor (7.35 µm) images (above) revealed two notable signatures: (1) the formation of a pronounced area of warm/dry water vapor brightness temperatures (bright yellow to orange color enhancement) over the open water north of Ireland, which indicated a strongly forced region of rapidly descending middle-tropospheric air, and (2) a classic “Sting Jet” signature (Monthly Weather Review | Wikipedia) which then moved eastward across Scotland. Just to the south of the sting jet signature, a wind gust of 78 knots (90 mph) was recorded at Glasgow at 08:20 UTC, followed by a wind gust of 70 knots (81 mph) at Edinburgh at 08:50 UTC.  There were additional reports of wind gusts in excess of 87 knots (100 mph) at non-METAR sites in Scotland.

The Sting Jet signature can also be seen in EUMETSAT Meteosat-9 Infrared (10.8 µm) images (Animated GIF) and EUMETSAT Meteosat-9 Visible (0.635 µm) images (Animated GIF).

A comparison of 1-km resolution NOAA-19 Visible (0.63 µm) and Infrared (10.8 µm) images at 12:54 UTC (below) showed the structure of the cyclone as it was centered over the North Sea between the British Isles and Norway.

NOAA-19 0.63 µm visible channel image + NOAA-19 10.8 µm IR channel image

NOAA-19 0.63 µm visible channel image + NOAA-19 10.8 µm IR channel image

Additional images of this Sting Jet event are available on the EUMETSAT and NASA Wide World of SPoRT sites.

View only this post Read Less

Snow streaks across Illinois, Indiana, and Kentucky

 An interesting pattern of “snow streaks” across parts of Illinois, Indiana, and Kentucky was seen on a MODIS true color Red/Green/Blue (RGB) image from the SSEC MODIS Today site on 03 January... Read More

MODIS true color RGB image (viewed using Google Earth)

MODIS true color RGB image (viewed using Google Earth)


An interesting pattern of “snow streaks” across parts of Illinois, Indiana, and Kentucky was seen on a MODIS true color Red/Green/Blue (RGB) image from the SSEC MODIS Today site on 03 January 2012 — this pattern was caused by narrow cells of convective snowfall which propagated southeastward across the region on the previous day. The amount of snow on the ground was only a Trace to 1 inch, which allowed the snow streaks to quickly melt during the day.

View only this post Read Less

Wildfires burning in Chile

As a result of prolonged drought and a mid-summer heat wave across southern Chile, a number of wildfires were burning in parts of the region on 01 January – 02 January 2012 (surface analysis). GOES-12 3.9 µm shortwave IR images (above;... Read More

GOES-12 3.9 µm shortwave IR channel images (click image to play animation)

GOES-12 3.9 µm shortwave IR channel images (click image to play animation)

As a result of prolonged drought and a mid-summer heat wave across southern Chile, a number of wildfires were burning in parts of the region on 01 January02 January 2012 (surface analysis). GOES-12 3.9 µm shortwave IR images (above; click image to play animation) showed a number of fire “hot spots” (yellow to red color enhancement) between Concepcion (station identifier SCIE) and Chillan (station identifier SCCH) from the late afternoon on 01 January until the early morning hours on 02 January.

During the subsequent daytime hours, GOES-12 0.63 µm visible channel images (below; click image to play animation) revealed a long hazy smoke plume that was drifting northwestward out over the adjacent Pacific Ocean. As daytime heating increased, cumulus clouds with a few thunderstorms could also be seen developing farther inland over the higher terrain of the Andes Mountains.

GOES-12 0.63 µm visible channel images (click image to play animation)

GOES-12 0.63 µm visible channel images (click image to play animation)

Rawinsonde data from Santo Domingo (station identifier SCSN) at 12 UTC indicated that southeasterly winds existed near the top of the deep temperature inversion, between 741 hPa (2.6 km) and 700 hPa (3.1 km) — so this is likely the approximate altitude of the smoke plume seen drifting toward the northwest on the GOES-12 visible satellite imagery.

Santo Domingo, Chile rawinsonde data plot

Santo Domingo, Chile rawinsonde data plot

A high-resolution MODIS true color image of the fire smoke plume can be seen on the NASA Earth Observatory site.

View only this post Read Less

Strong winds in Scotland associated with the passage of a warm seclusion cyclone

EUMETSAT Meteosat-9 High Resolution Visible (HRV) images (above) showed the classic signature of a “warm seclusion“: a nearly cloud free eye-like structure at the center of the circulation. Surface station wind barbs (in knots) are also plotted in cyan on the images.A similar eye-like appearance was seen on Meteosat-9 water vapor... Read More

EUMETSAT Meteosat-9 High Resolution Visible (HRV) images

EUMETSAT Meteosat-9 High Resolution Visible (HRV) images

EUMETSAT Meteosat-9 High Resolution Visible (HRV) images (above) showed the classic signature of a “warm seclusion“: a nearly cloud free eye-like structure at the center of the circulation. Surface station wind barbs (in knots) are also plotted in cyan on the images.

A similar eye-like appearance was seen on Meteosat-9 water vapor channel images (below) as the mature cyclone moved just north of the British Isles on 28 December 2011.

EUMETSAT Meteosat-9 water vapor channel images

EUMETSAT Meteosat-9 water vapor channel images

Hurricane force wind gusts were observed at Tiree, Scotland (station identifier EGPU), with a peak gust of 69 knots (79 mph) at 14:20 UTC (below).

Tiree, Scotland (EGPU) surface reports

Tiree, Scotland (EGPU) surface reports

Surface analyses from the NWS/NCEP Ocean Prediction Center (below) showed the intensification and evolution of the cyclone during the day.

Ocean Prediction Center surface analyses

Ocean Prediction Center surface analyses

Warm seclusions are also sometimes observed with intense cyclones along the East Coast of the US, as in this 20 December 2009 case.

View only this post Read Less