The Area Forecast Discussion issued by the National Weather Service forecast office in Fairbanks mentioned the presence of a layer of fog and stratus over parts of the North Slope region of Alaska:
NORTHERN ALASKA FORECAST DISCUSSION
NATIONAL WEATHER SERVICE FAIRBANKS AK
1258 PM AKDT MON MAR 11 2013NORTH SLOPE…THE SUOMI NPP VIIRS SATELLITE FOG PRODUCT WAS INDICATING A DECENT LAYER OF STRATUS ALONG THE NORTH SLOPE. OBSERVATIONS ACROSS THE AREA GENERALLY INDICATED 1 TO 2 MILES IN VISIBILITY WITH FLURRIES AND FOG. THE IFR CONDITIONS ALIGN VERY WELL WITH THE HIGHER PROBABILITIES OF MODIS IFR PRODUCT. THERE ARE SOME VERY ISOLATED POCKETS OF HIGHER PROBABILITIES OF THE MODIS LIFR CONDITIONS. THESE CONDITIONS SHOULD REMAIN THROUGH TUESDAY EVENING OR WEDNESDAY MORNING AS THE SURFACE HIGH PRESSURE REMAINS WITHIN THE AREA. BY WEDNESDAY MORNING THE SURFACE PRESSURE GRADIENT BEGINS TO TIGHTEN…PROVIDING AN INCREASE IN WINDS AND PERHAPS A BREAK IN SOME OF THE FOG.
AWIPS images of the Suomi NPP VIIRS IR brightness temperature difference “fog/stratus product” (below) showed the coverage of the fog and stratus over the area.

Suomi NPP VIIRS IR brightness temperature difference “fog/stratus product”
The MODIS Instrument Flight Rules (IFR) Probability product (below) exhibited probabilities in excess of 90% (darker red color enhancement) over some areas. As mentioned in the forecast discussion, surface high pressure centered over the region was helping to maintain the presence of fog and stratus.
 Probability product")
MODIS Instrument Flight Rules (IFR) Probability product
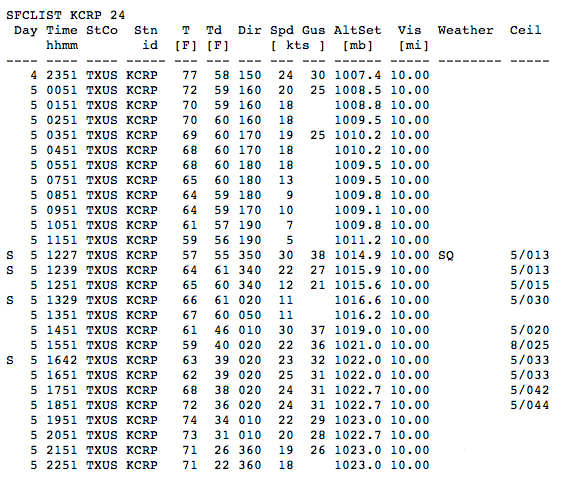
The corresponding MODIS Low Instrument Flight Rules (LIFR) Probability product (below) had some values greater that 70% (red color enhancement) over the eastern portion of the North Slope. However, you will notice that a large data gap appears in the LIFR product, in an area where IFR probabilities were high. Corey Calvert from CIMSS explained:
“Looks like the issue stems from the RAP model. The max RH in the lowest 1000′ layer is well over 90% for the area being discussed. However, the max RH in the lowest 500′ layer decreases significantly northward toward the water where is terrain is lower. Looks like the RAP is representing an elevated cloud layer with a ceiling between 500′-1000′ above sea level in that area. The high LIFR probs appear to coincide with higher terrain, therefore the lowest 500′ layer is elevated into the RAP cloud layer. The low LIFR probs (the hole in the data) match up with the lower RH values at lower terrain under the RAP cloud layer. The ceiling obs do indicate an elevated cloud layer (one station measuring 300′ and another 700′ in the area), but it’s hard to tell which is right due to the sparsity of obs. If the ceiling truly is hovering around 500′ though then this is believable representation from the products (high prob of IFR but low prob of LIFR)”.
 Probability product")
MODIS Low Instrument Flight Rules (LIFR) Probability product
These examples of new satellite products are being evaluated in an operational environment as part of the GOES-R Proving Ground, in an effort to prepare forecasters for the types of satellite data that will be available from the next generation of meteorological satellites (JPSS and GOES-R)
View only this post Read Less
")

")
