
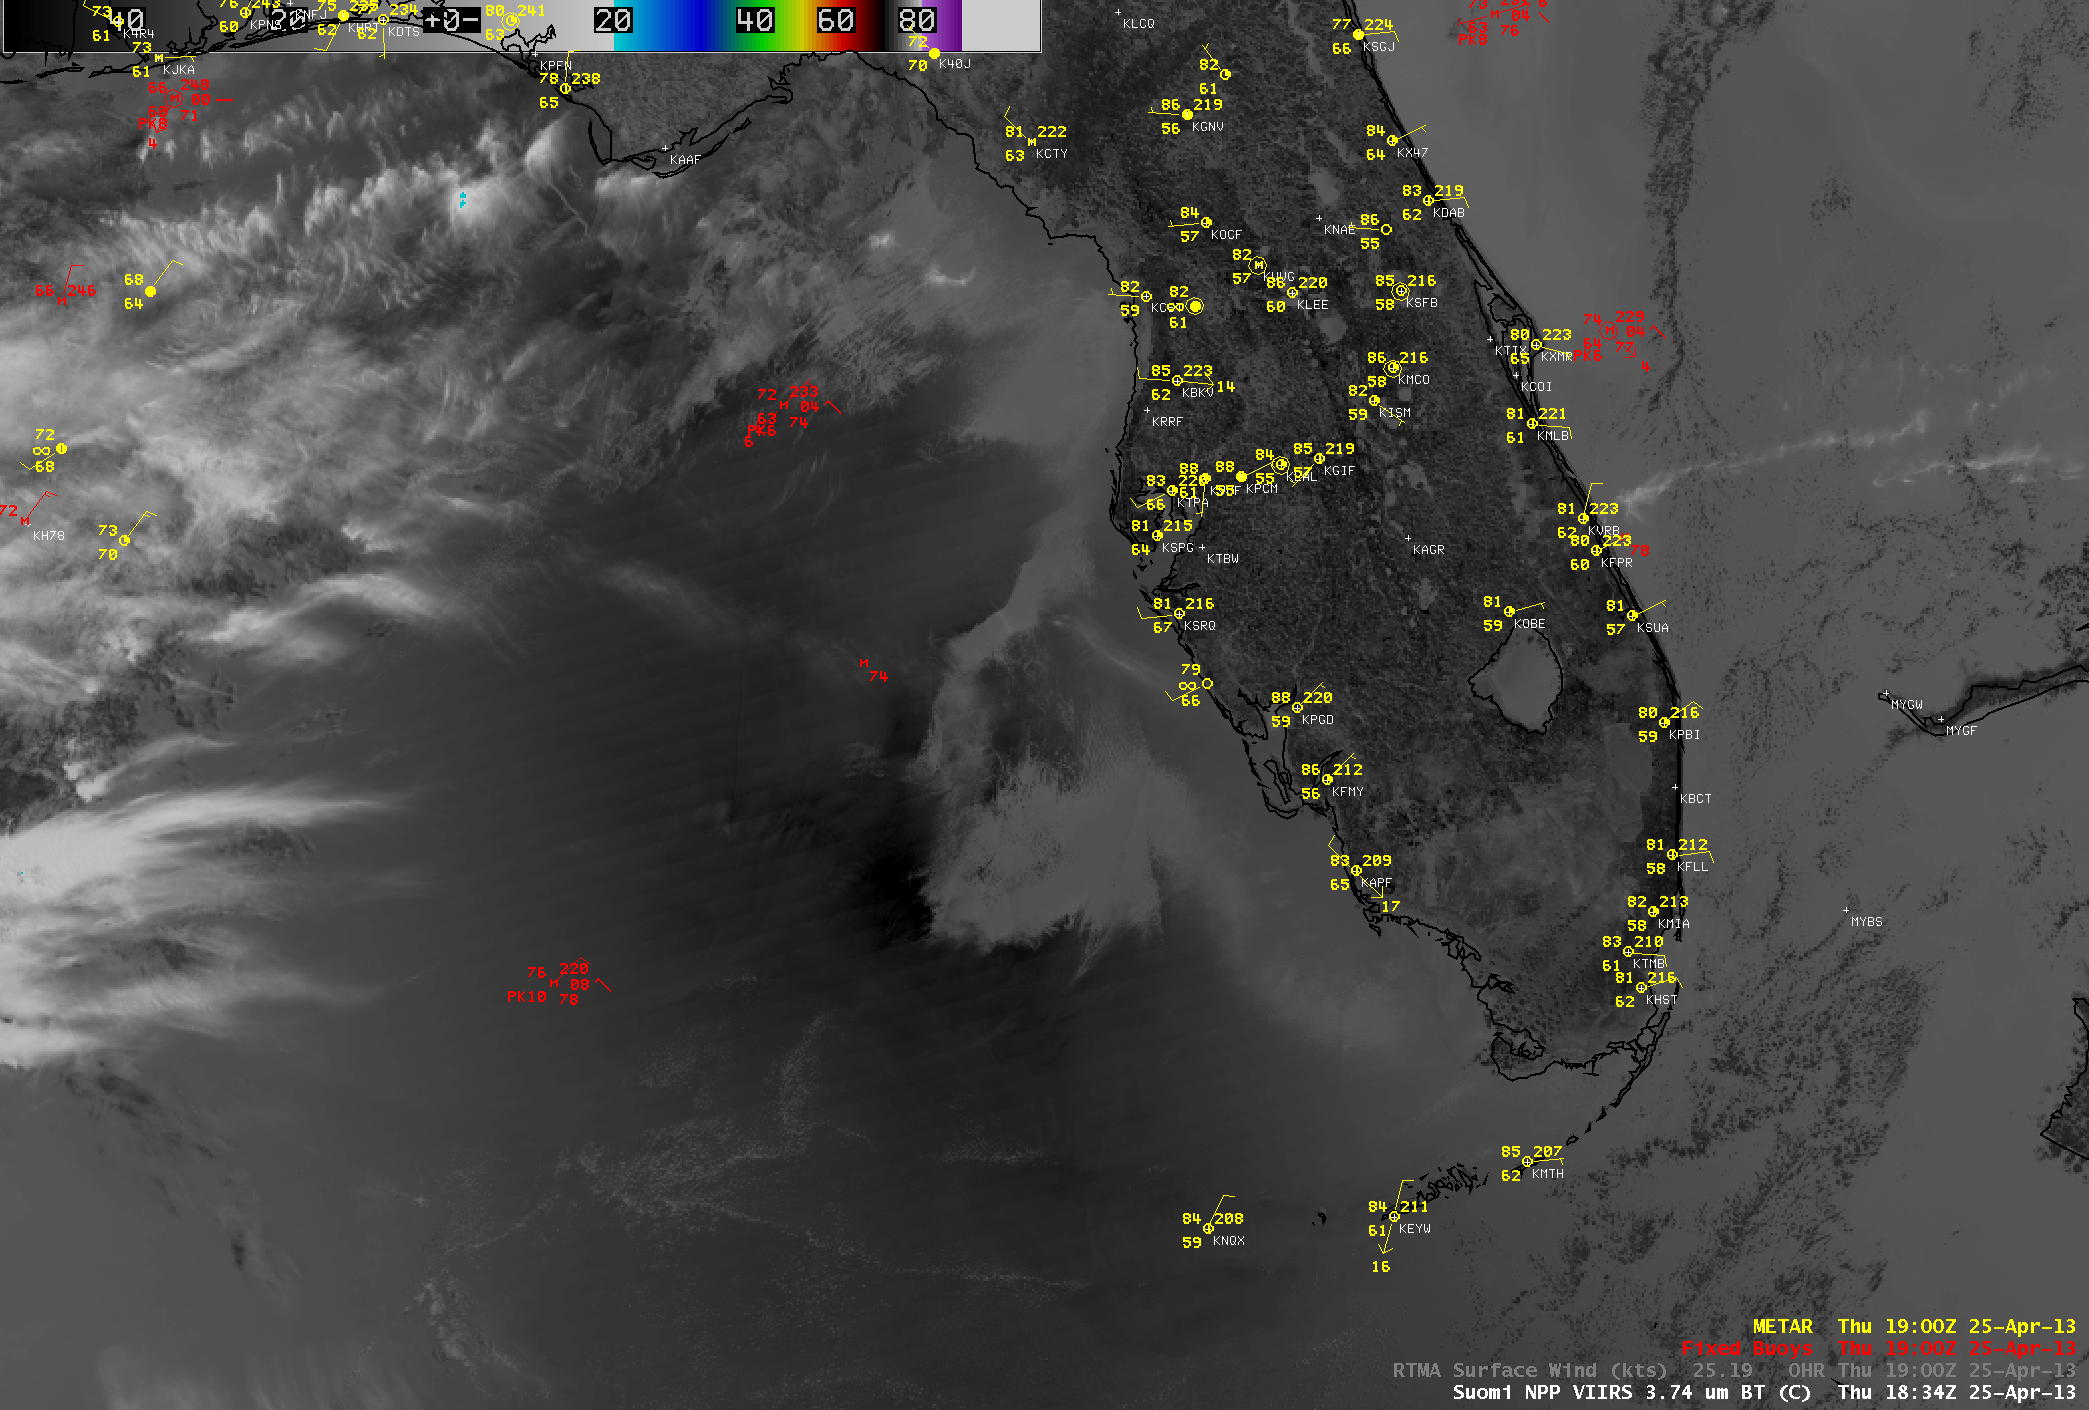
Suomi NPP VIIRS 0.65 µm visible channel image with overlays of surface reports and RTMA surface winds
An AWIPS image of 1-km resolution Suomi NPP VIIRS 0.64 µm visible channel data (above) revealed a large patch of water within the eastern Gulf of Mexico “sun glint” region that exhibited a much darker appearance than the surrounding waters off the west coast of Florida on 25 April 2013. This patch of darker water generally corresponded to a region of very light to calm winds, as verified by an overlay of the Real-Time Mesoscale Analysis (RTMA) surface winds. As explained in a previous blog post, there is often a significant amount of sun glint off the wind-driven rough water surfaces below a polar-orbiting satellite overpass — due to scattering of light these areas of sun glint make the rougher water surfaces appear brighter on visible imagery. However, in an area of calm winds, the water surface becomes very flat; this flat water surface then reflects incoming sunlight like a mirror (with all the light being reflected back in one direction — but in this case, that one direction was not directly back toward the satellite).
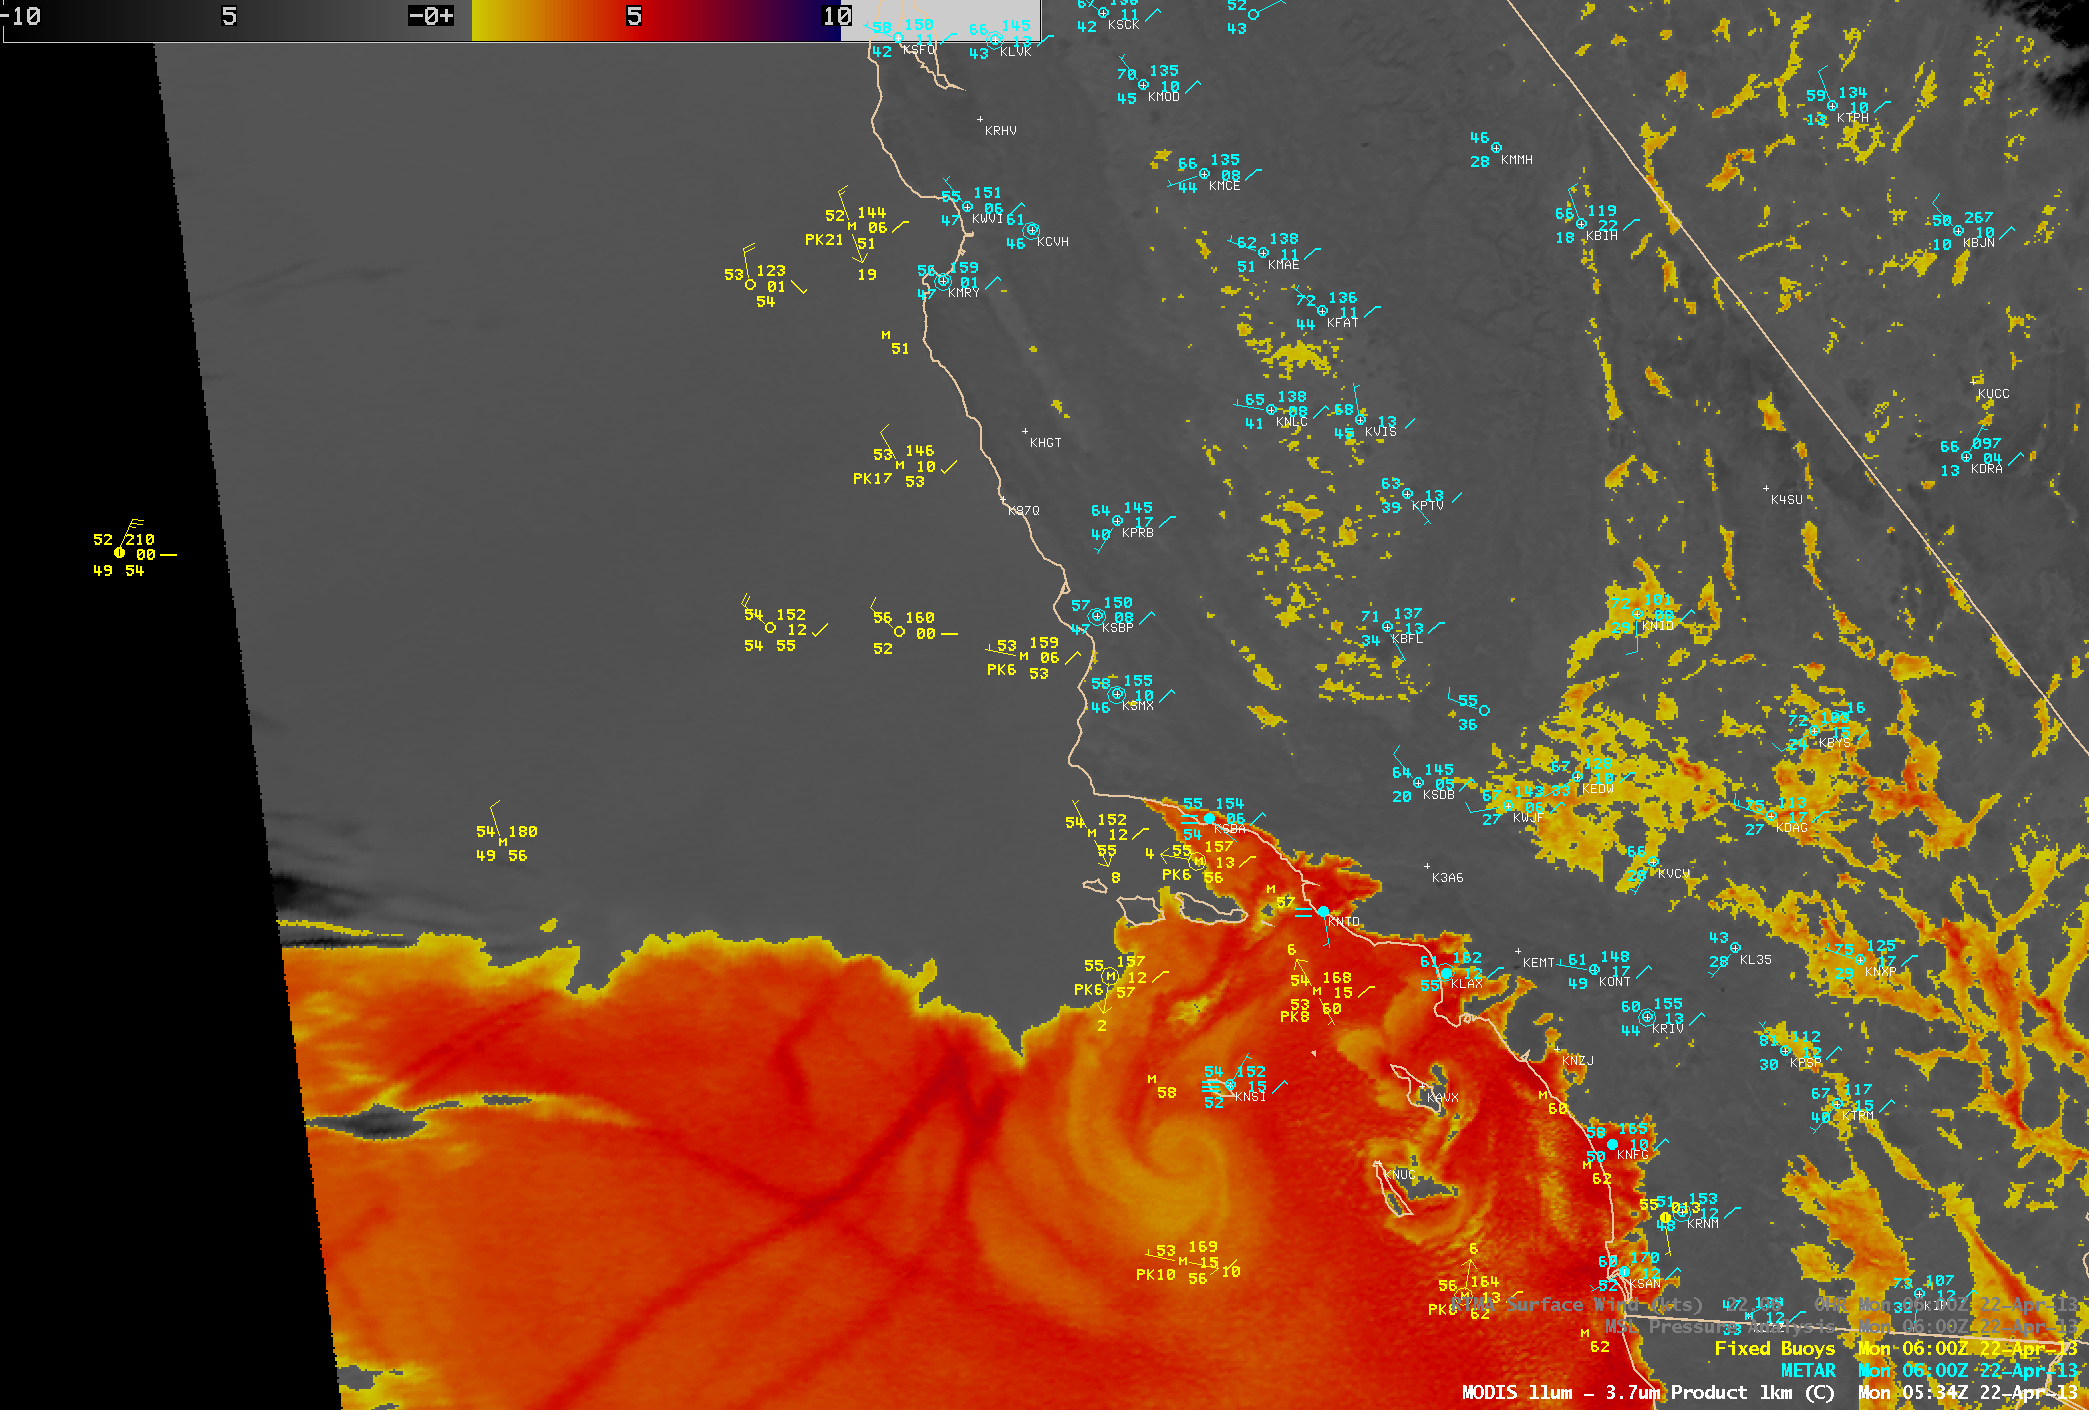
Another interesting signature of the flat water surface is seen in a comparison of 1-km resolution Suomi NPP VIIRS 3.74 µm shortwave IR channel and 11.45 µm longwave IR or “IR window” channel images (below). The shortwave IR channel is very sensitive to reflected solar radiation, and will often exhibit a much warmer, darker signal over areas of sun glint. However, note that the areas of darker water seen in the visible image above appear significantly cooler (lighter gray enhancement) on the shortwave IR image. Again, in the case of smooth, flat water in light wind regions, the incoming solar radiation is reflected back in a direction that happens to be away from the satellite sensors. Since the 11.45 µm IR channel is not sensitive to reflected solar radiation, no such signature was seen in that particular image.
Suomi NPP VIIRS 3.74 µm shortwave IR channel and 11.45 µm longwave IR or “IR window” channel images
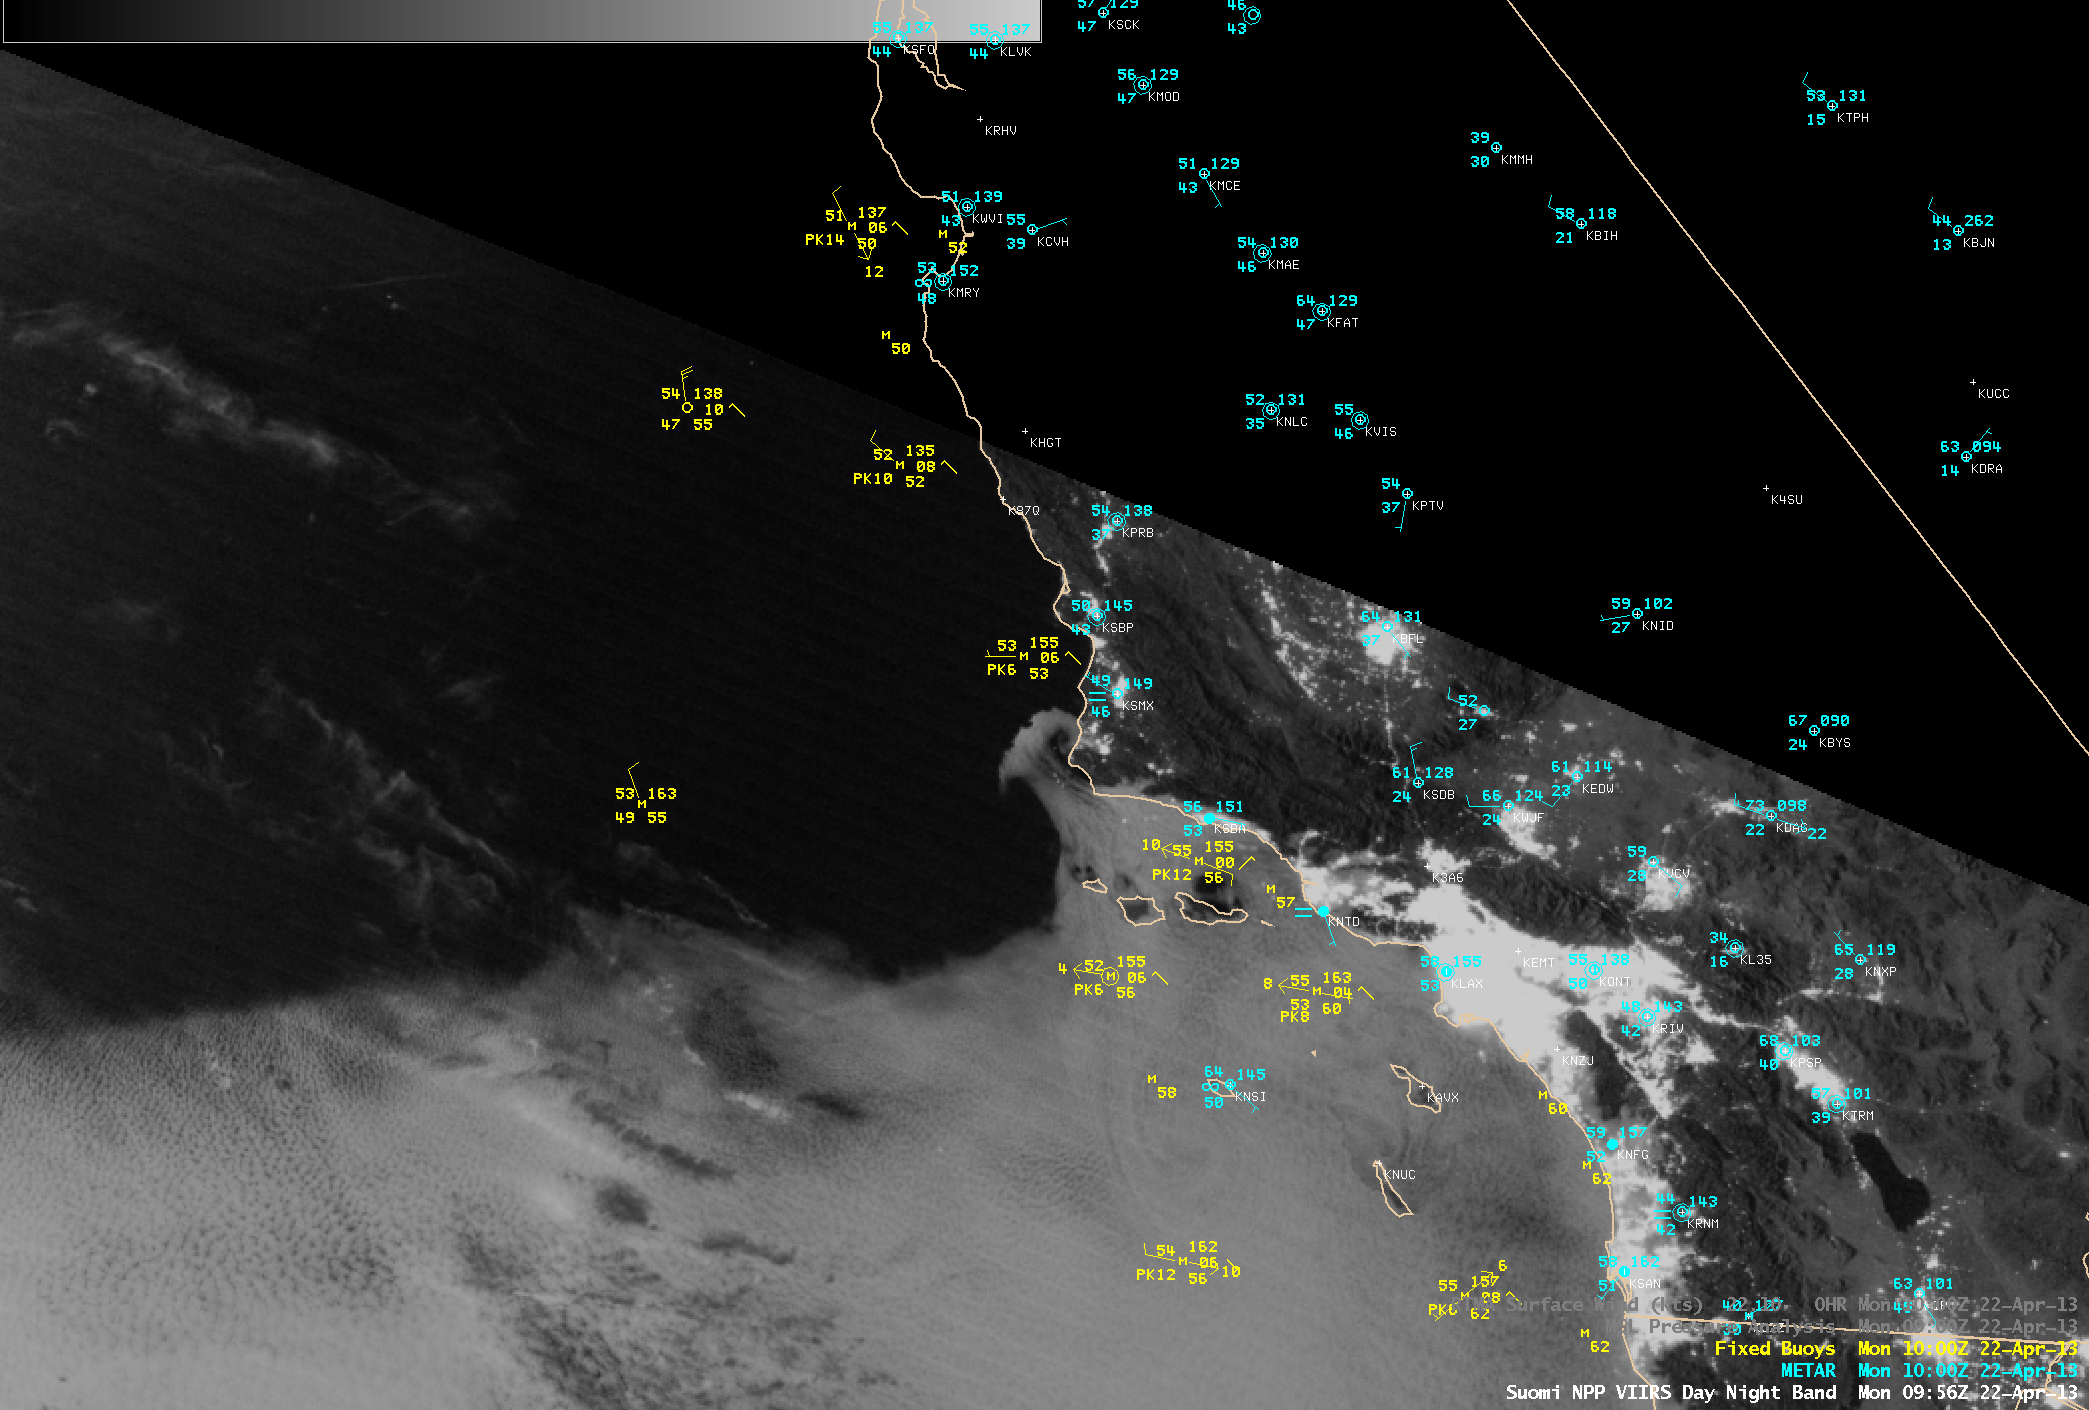
A nighttime vs daytime comparison of the 1-km resolution MODIS Sea Surface Temperature (SST) product (below) showed that the SST values over the patch of calm water increased from the low to middle 70s F at 06:58 UTC (2:58 AM local time) to the upper 70s to 80º F at 16:22 UTC (12:22 PM local time). Such an increase in SST within a relatively short 10-hour period was possible due to the fact that the presence of very light winds also allowed the skin temperature of the water surface to warm very quickly (as we have previously seen over Lake Michigan).

MODIS Sea Surface Temperature product
‘
View only this post Read Less
")
")
")
 Probability product (click image to play animation)")

")
")
")
