Severe weather occurred over the southern Plains/lower Mississippi Valley on Sunday 27 April 2014 (SPC storm reports | GOES-13 IR image animation). How did the NOAA/CIMSS ProbSevere product perform with these storms? Three examples are presented below.NOAA/CIMSS... Read More
Severe weather occurred over the southern Plains/lower Mississippi Valley on Sunday 27 April 2014 (SPC storm reports | GOES-13 IR image animation). How did the NOAA/CIMSS ProbSevere product perform with these storms? Three examples are presented below.
NOAA/CIMSS ProbSevere estimates the likelihood that a growing convective storm will first produce severe weather within the next sixty minutes. The Product uses Rapid Refresh model environmental parameters (Most Unstable CAPE, and Environmental Shear), satellite (GOES-13 only, at present) observations of cloud growth and glaciation, and MRMS radar estimates of Maximum Expected Size of Hail (MESH). A convective tower that grows rapidly (as observed by satellite), for example, will be more likely to spawn severe weather in the next 60 minutes than one that grows more slowly. Similarly, as radar intensities increase, so too do the probabilities. The goal of this product is to increase the lead time for a warning by up to several radar scans.
![MRMS Radar and ProbSevere readouts, 21:10, 21:22 and 22:08 UTC on 27 April 2014 [Click to enlarge]](https://cimss.ssec.wisc.edu/satellite-blog/wp-content/uploads/sites/5/2014/04/DallasStorm_0427_2014loop.gif "MRMS Radar and ProbSevere readouts, 2110, 2122 and 2208 UTC on 27 April 2014 [Click to enlarge]")
MRMS Radar and ProbSevere readouts, 21:10, 21:22 and 22:08 UTC on 27 April 2014 [Click to enlarge]
The image above shows the radar at 21:10, 21:22 and 22:08 UTC, and also values used in the computation of the ProbSevere product, for a hail-producing storm just south of Dallas. The readout shows the most unstable CAPE and Environment Shear (averaged within the radar object that is outlined), the maximum satellite growth and the maximum glaciation rate that the radar object experienced, and also the MESH. In this case, MUCAPE is 4300-4400 J/kg and Environmental Shear is around 50 kts. The maximum satellite growth for the object being tracked is 1%/minute (% meaning percent of the depth of the troposphere) measured at 20:15 UTC (a time when the radar may or may not have been detecting the developing storm). This moderate growth rate stays attached to this growing convective feature at later times. The ProbSevere exceeded 50% at 21:10 UTC, the first warning was issued at 21:22 UTC and the first report of 1″ hail was at 21:45 UTC. (This storm later produced baseball-sized hail). The storm had moderate growth rates, but very large values of MUCAPE and Shear enhanced the probabilities. Glaciation Rate is reported as N/A, which typically means development under a pre-existing cirrus shield. That was the case over Dallas, as shown in
this animation of visible imagery from GOES-13.
![As above, but at 21:20, 21:30 and 22:14 UTC 27 April 2014 [Click to enlarge]](https://cimss.ssec.wisc.edu/satellite-blog/wp-content/uploads/sites/5/2014/04/MississippiStorm_0427_2014loop.gif "As above, but at 2120, 2130 and 2214 UTC 27 April 2014 [Click to enlarge]")
As above, but at 21:20, 21:30 and 22:14 UTC 27 April 2014 [Click to enlarge]
The storm above, over northwestern Mississippi, showed strong satellite growth rates (2.4% per minute) and strong glaciation rates. Probabilities exceeded 50% at 21:14 UTC (just before the 21:20 UTC image shown above) and the first warning was issued at 21:30 UTC, with the first report at 22:31 UTC. This storm produced hail, wind and a tornado.
![As above, but at 23:00, 23:08, 23:20 and 23:26 UTC 27 April 2014 [Click to enlarge]](https://cimss.ssec.wisc.edu/satellite-blog/wp-content/uploads/sites/5/2014/04/KSStorm_0427_2014loop.gif "As above, but at 2300, 2308, 2320 and 2326 UTC 27 April 2014 [Click to enlarge]")
As above, but at 23:00, 23:08, 23:20 and 23:26 UTC 27 April 2014 [Click to enlarge]
A third storm that affected the Kansas City metropolitan area is shown above. ProbSevere exceeded 50% at 23:00 UTC, the first warning was issued at 23:26 UTC and the first hail report occurred 23:31 UTC. Satellite growth for this storm is initially strong (1.5% per minute at 21:25 UTC), but the tracked object linked to that strong growth eventually were lost (Satellite Growth values were lost at 23:20 UTC) and probabilities decrease slightly; they remain relatively high because of the favorable environment and radar observations.
For all three examples above, the probabilities were highest with the convective system that produced the severe weather. The combination of the three components (Rapid Refresh, Radar, and Satellite) is key to the probability. Each individual component has strengths but the combination of predictors is what yields a skillful model with meaningful lead-time.
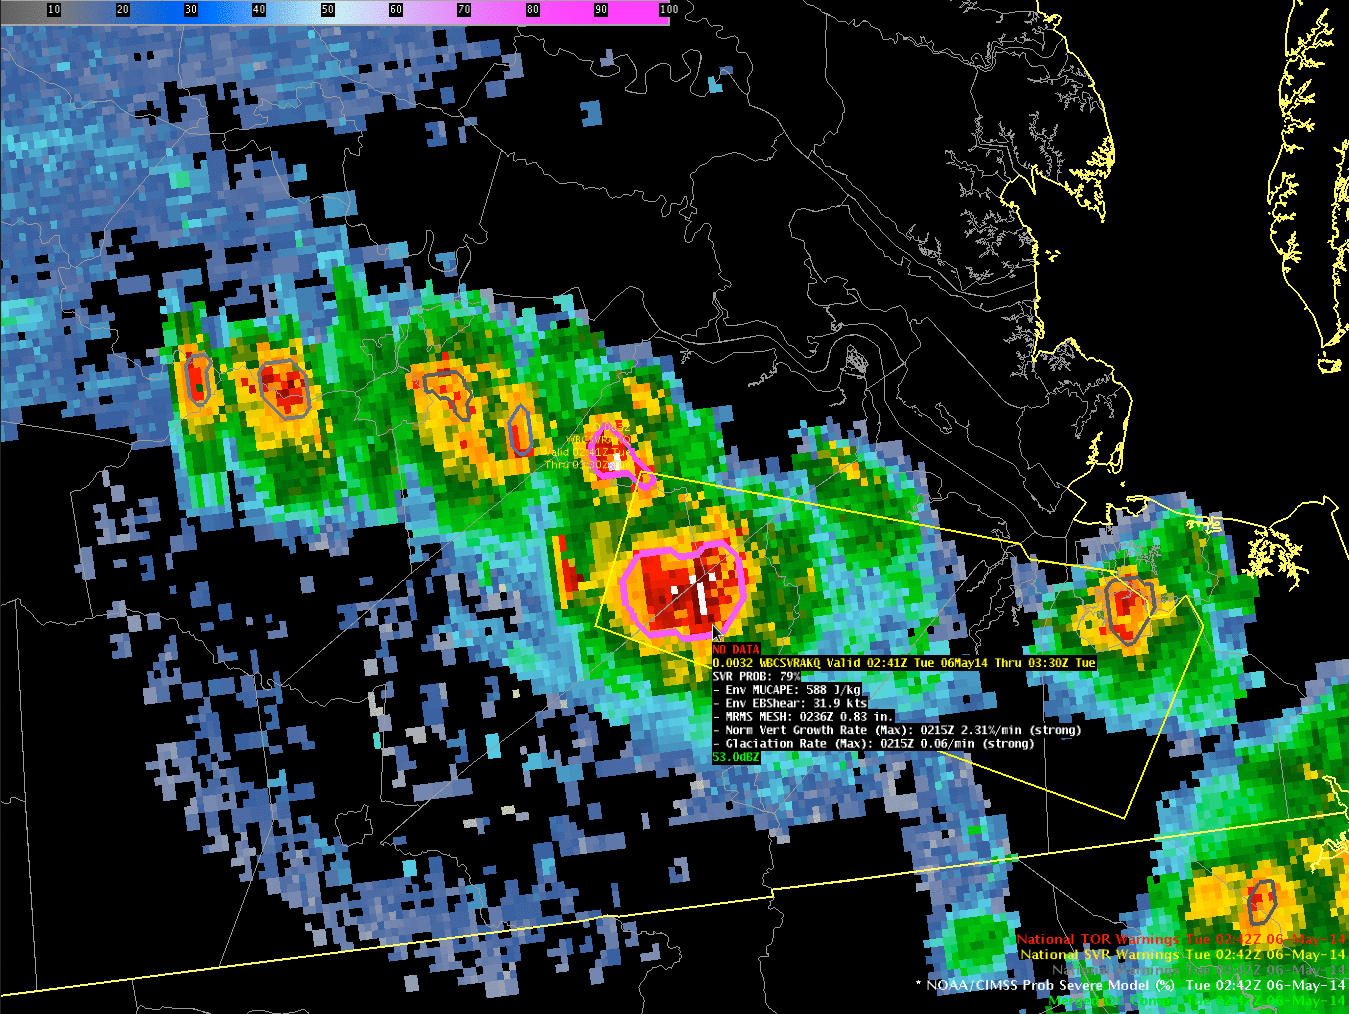
Severe weather continued on April 28th, including fatal storms in Mississippi. The image below, however, is for a thunderstorm that formed in Missouri outside the region of SPC’s Slight Risk issued at 1300 UTC, and near the edge of the Slight Risk issued at 1630 UTC.
![As above, but at 17:20, 17:22, 17:26 and 17:38 UTC 28 April 2014 [Click to enlarge]](https://cimss.ssec.wisc.edu/satellite-blog/wp-content/uploads/sites/5/2014/04/MO_storm_17z_28April2014.gif "As above, but at 17:20, 17:22, 17:26 and 17:38 UTC 28 April 2014 [Click to enlarge]")
As above, but at 17:20, 17:22, 17:26 and 17:38 UTC 28 April 2014 [Click to enlarge]
The ProbSevere for the developing cell is 24% at 17:20 UTC, with Strong Normalized Vertical Growth Rate (2.3%/min) and weak glaciation (0.01/min) observed at 1655 UTC. At 17:22 UTC, new satellite observations have been incorporated (from the 17:15 UTC scan): the Normalized Vertical Growth Rate is now 3.4%/min; in addition, Glaciation (0.17/Min) is also now strong. As a result, ProbSevere increases to 73%. The Severe Thunderstorm Warning was issued 15 minutes later, at 17:37 UTC, 2 minutes after the first report of severe hail with this storm (in Holts Summit MO, in
Callaway County).
The ProbSevere product will be evaluated at the Hazardous Weather Testbed to be held in Norman OK in May.
View only this post
Read Less


