Convection developed along the edge of warm air moving northward into Wisconsin early in the morning on May 7th. The Day 1 Outlook from the Storm Prediction Center showed the region to be in a Slight Risk.The NOAA/CIMSS ProbSevere model, which fuses together information from GOES-derived cloud products, Multi-Radar Multi-Sensor (MRMS) data, and Rapid Refresh (RAP)... Read More
Convection developed along the edge of warm air moving northward into Wisconsin early in the morning on May 7th. The Day 1 Outlook from the Storm Prediction Center showed the region to be in a Slight Risk.
The NOAA/CIMSS ProbSevere model, which fuses together information from GOES-derived cloud products, Multi-Radar Multi-Sensor (MRMS) data, and Rapid Refresh (RAP) NWP data, picked up on these convective storms on the north side of a baroclinic zone. The environment was characterized by 1000-2000 J kg-1 of MUCAPE and adequate effective bulk shear (~30-40 kts). The instability was elevated, as the surface airmass reflected a cool easterly flow. (Click here to see the DVN and GRB soundings from 1200 UTC 7 May)
Very early Wednesday morning (1000-1100 UTC), a storm developed in west-central Wisconsin moving eastward. ProbSevere pegged the storm at 25% probability of producing severe weather, given the environment, strong normalized vertical growth rate (inferred from IR-derived data), and moderate maximum expected size of hail (MESH). As the MESH increased over 1.0”, ProbSevere increased to about 70%. By 1026 UTC, the probability was 74%, and 1 minute later the National Weather Service (NWS) issued a severe thunderstorm warning. The warning was issued 5 minutes after ProbSevere’s first probability > 50%. This storm later weakened and decreased in probability, but then picked up again and produced 1.0” hail in Clark county at 1218 UTC, all the while maintaining a warning.
MRMS Radar returns and NOAA/CIMSS ProbSevere objects and NWS-issued Severe Thunderstorm Warning, times as indicated (Click to enlarge)
Other storms developed near Richland County in Wisconsin around 1400 UTC. A strong satellite vertical growth signal could not be computed for these storms because of thick cirrus overhead from decaying convection to the north. ProbSevere nevertheless had high probabilities (due to a favorable environment and large MESH) prior to these storms being warned. The eastern of the two storms showed a ProbSevere value exceeding 50% thirteen minutes before the first NWS warning; ProbSevere for the western storm exceeded 50% 26 minutes before the first NWS warning. Both storms dropped severe hail in Richland county (Storm Report) — 1.25″ diameter hail at 1443 UTC for the eastern storm (4 minutes after the NWS warning), 2.0″ diameter hail at 1442 UTC with the western storm (coincident with its first warning). A storm southeast of these two in Sauk county had a high probability of severe (> 70%) by 1442 UTC, also because of large MESH, good MUCAPE and effective shear, but it was never warned and never produced any severe reports (until it coalesced later with the other storms into a convective line)
MRMS Radar returns and NOAA/CIMSS ProbSevere objects and NWS-issued Severe Thunderstorm Warning, times as indicated (Click to enlarge)
Lastly, a storm west of Milkwaukee quickly developed and was monitored by ProbSevere. By 1454 UTC, the storm’s probability of severe jumped from 7% to 24% (at the start of the animation) because its normalized vertical growth rate became very strong (see the visible and IR loops).
MRMS Radar returns and NOAA/CIMSS ProbSevere objects and NWS-issued Severe Thunderstorm Warning, times as indicated (Click to enlarge)
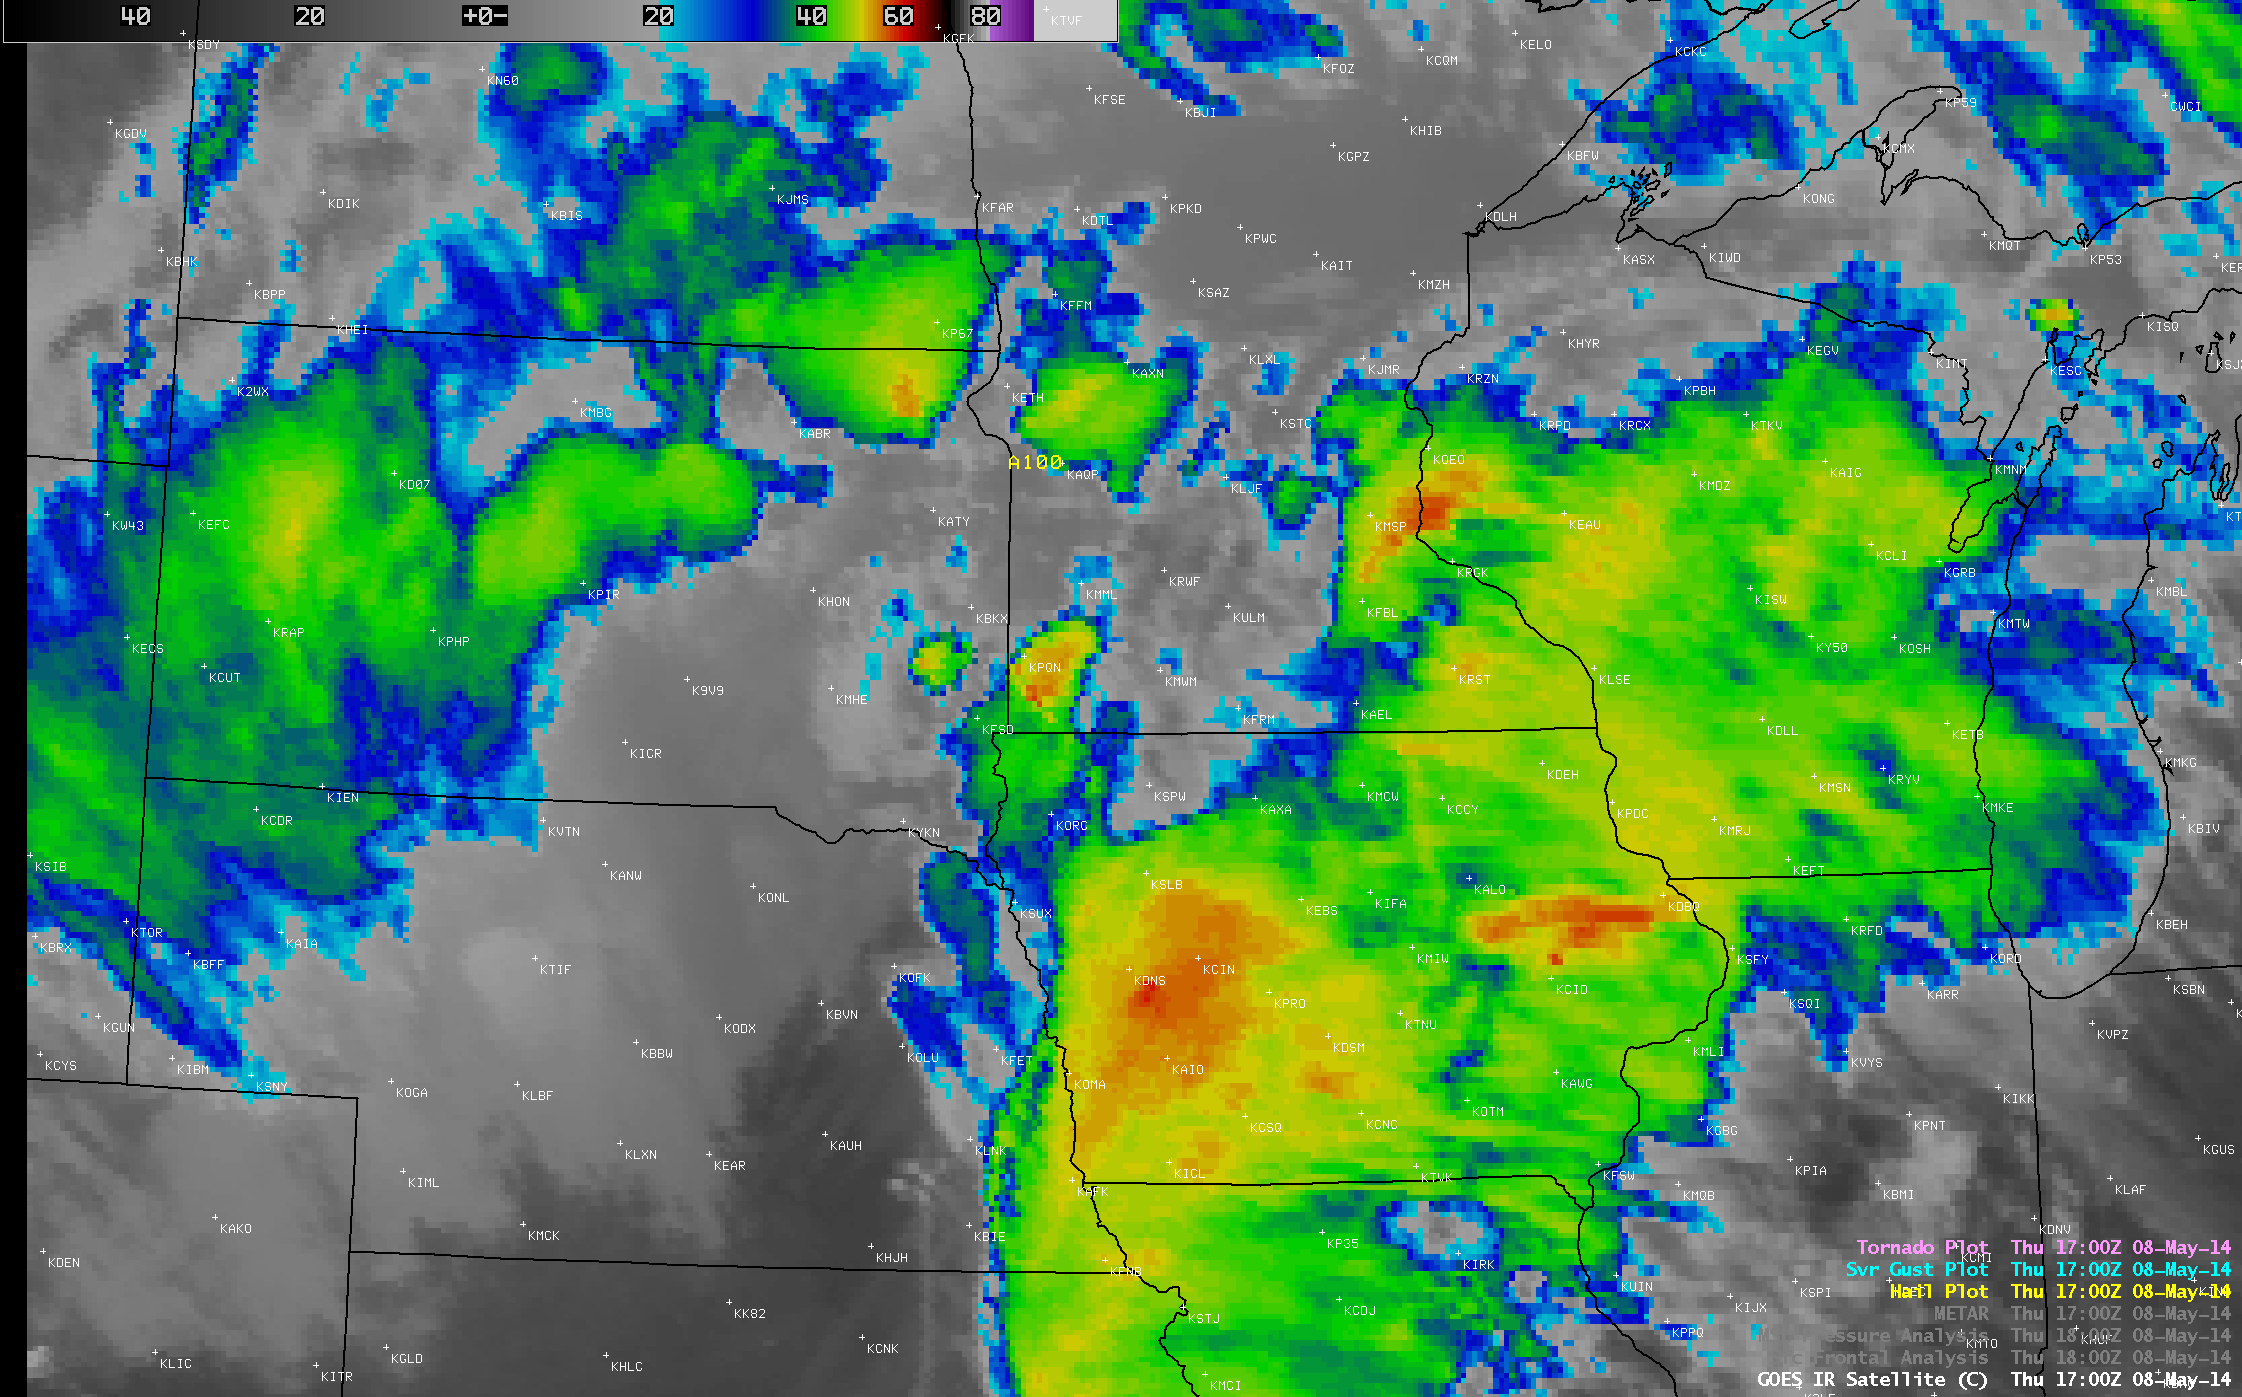
AWIPS 10.7 µm imagery,below, shows the evolution of the storms as viewed from GOES-East. The first storm, over central WI at 1030 UTC, shows considerable electrical activity but overshooting tops are not detected. The storms over Richland/Sauk Counties around 1400 UTC, and near Milwaukee around 1500 UTC do show overshooting tops.
MRMS Radar returns and NOAA/CIMSS ProbSevere objects and NWS-issued Severe Thunderstorm Warning, times as indicated (Click to enlarge)
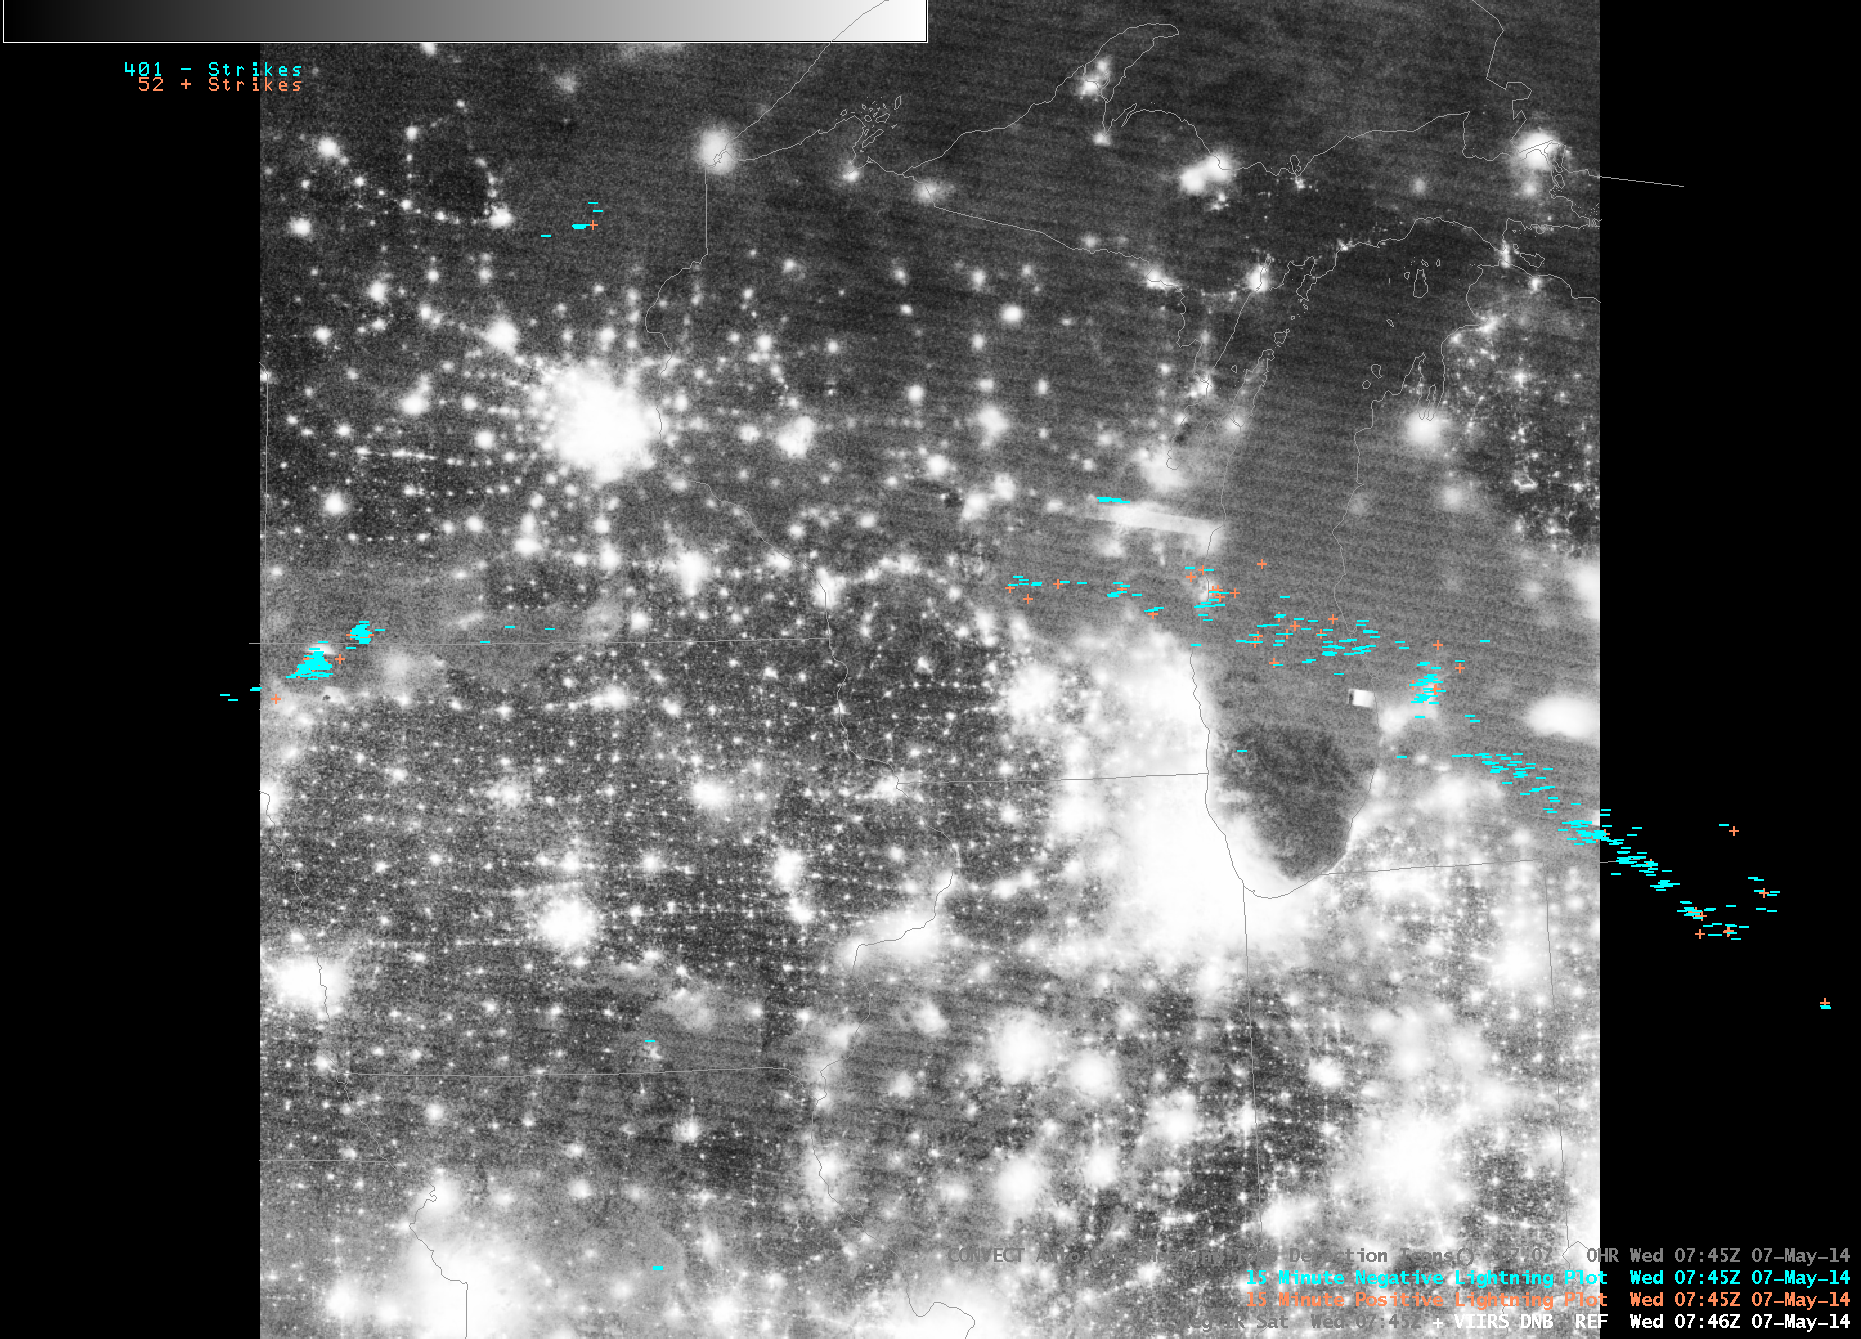
VIIRS and AVHRR both overflew these systems around 0730 UTC. The toggle of imagery below shows the great detail in the cloud-top that is available with 1-km resolution as from VIIRS and AVHRR. In addition, the Day/Night band can be used at night (especially when the lunar illumination is low, as was the case on 7 May) to detect lightning, characterized as streaks of white in the Day/Night band imagery. One such streak is visible near Manitowoc, WI.
POES AVHRR 10.7 µm imagery at 0736 UTC, Suomi/NPP VIIRS imagery (11.0 µm and Day/Night Band) at 0746 UTC, and GOES-East 10.7 µm imagery at 0745 UTC (Click to enlarge)
The NOAA/CIMSS ProbSevere product is being evaluated at the Hazardous Weather Testbed. Additional examples can be found at the HWT Blog.
View only this post
Read Less

![GOES-13 0.63 um visible channel images: Standard 15-minute interval (left), RSO (center), and SRSOR (right) [click image to play animation]](https://cimss.ssec.wisc.edu/satellite-blog/wp-content/uploads/sites/5/2014/05/140508_g14_visible_standard_rso_srso_MN_tornadoes_anim.gif)


