
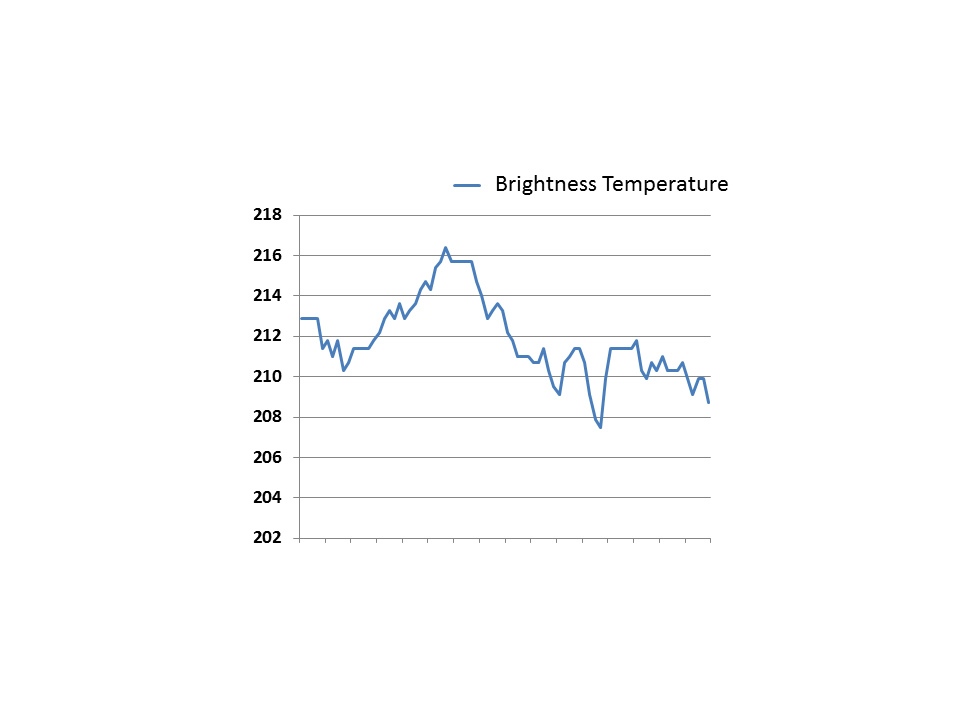
Suomi NPP VIIRS and POES AVHRR IR brightness temperature difference “fog/stratus product” images
An AWIPS comparison of nighttime Suomi NPP VIIRS and POES AVHRR IR brightness temperature difference “fog/stratus product” images (above) exhibited signals of fog and/or stratus forming in river valleys straddling the West Virginia and Virginia border on 13 May 2014.
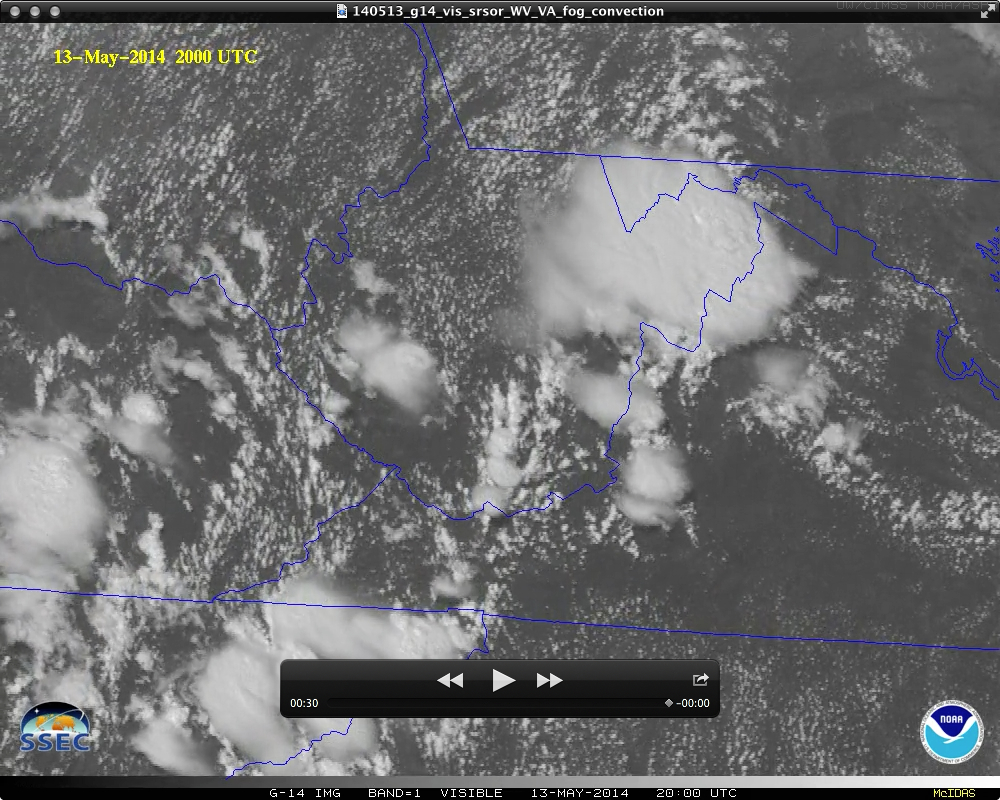
The GOES-14 satellite continued to be operated in Super Rapid Scan Operations for GOES-R (SRSOR) mode, providing images at 1-minute intervals. Early morning 0.63 µm visible channel images (below; click image to play an MP4 animation; also available as a QuickTime movie) showed the narrow fingers of river valley fog/stratus, which began to burn off as heating and mixing increased during the morning hours. There was then a rapid transition to the formation of cumulus clouds across the region, some of which became organized areas of deep convection that produced hail and damaging winds (SPC storm reports).

GOES-14 0.63 µm visible channel images (click to play MP4 animation)
A 3-panel comparison showing the difference between standard or routine 15-minute interval, 5-7 minute interval Rapid Scan Operations (RSO), and 1-minute interval SRSO GOES-14 0.63 µm visible channel images (below; click image to play an MP4 animation; also available as a very large Animated GIF) demonstrated the clear advantage of higher temporal resolution for monitoring the rate of dissipation of river valley fog/stratus features, as well as subsequent convective initiation and development.

GOES-14 0.63 µm visible channel images: Standard, RSO, and SRSOR scan strategies (click to play MP4 animation)
Consecutive overpasses of the Suomi NPP satellite provided a look at the rapid rate of convective cloud development on VIIRS 0.64 µm visible channel images (below).

Suomi NPP VIIRS 0.64 µm visible channel images, with surface observations and frontal boundaries
On a 18:59 UTC MODIS 11.0 µm IR channel image (below), the coldest cloud-top IR brightness temperature was -78º C near the West Virginia/Virginia border.
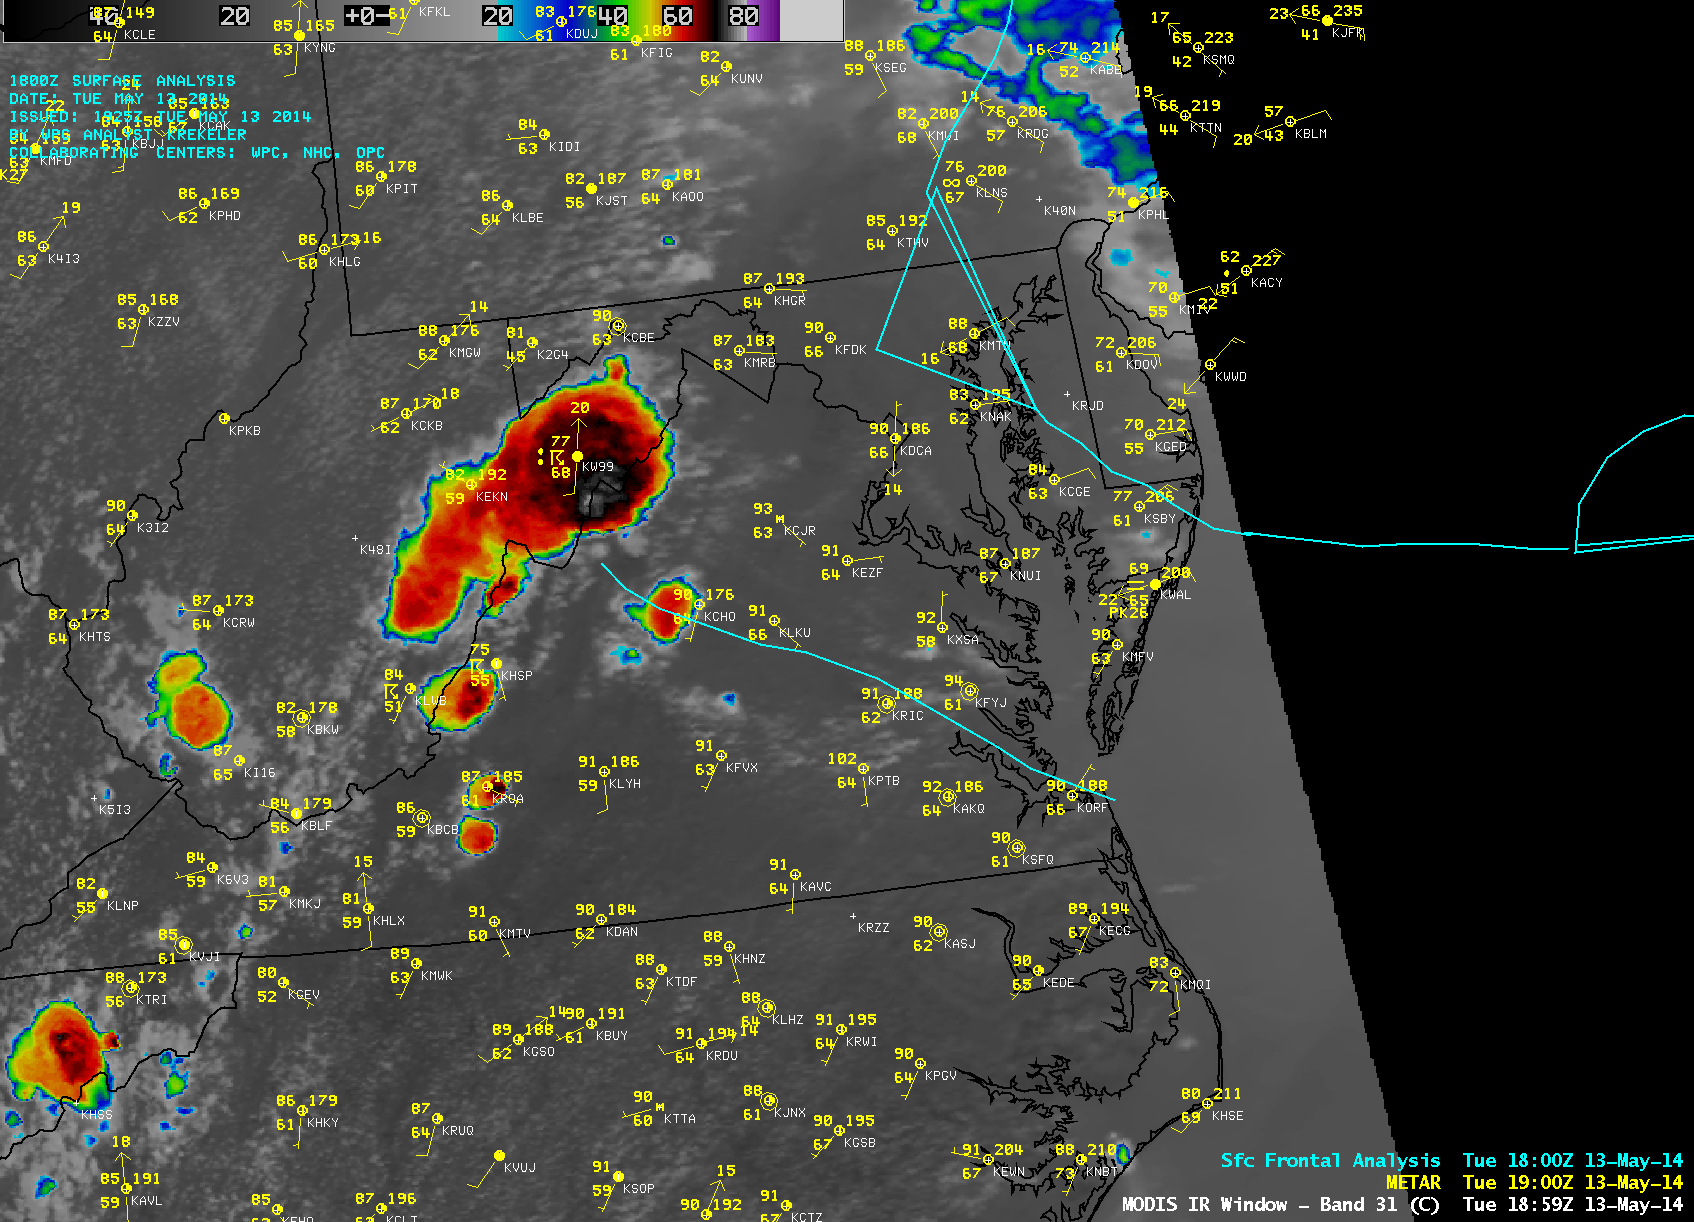
MODIS 11.0 µm IR channel image
View only this post Read Less


