GOES-15 0.62 µm visible channel images (click to play animation)
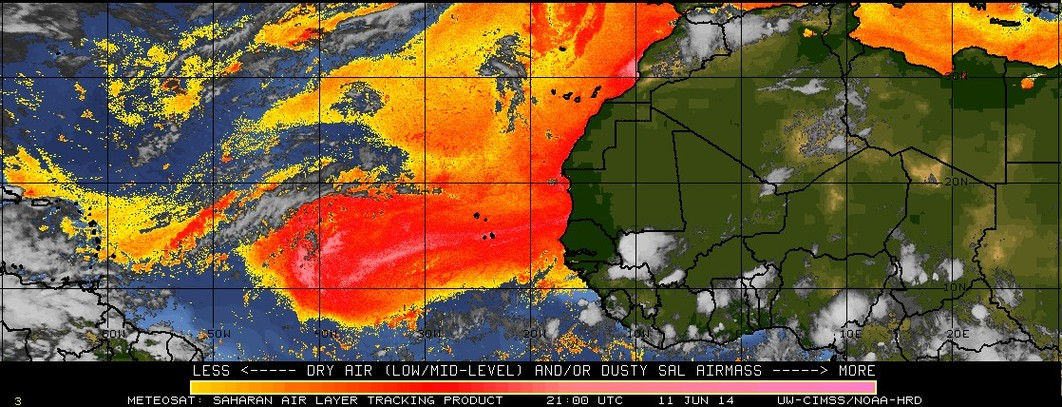
Tropical Storms Douglas (center of the image) and Elida (right-hand side of the image) have formed in the tropical Pacific to the west of Mexico. From the animation above (click here for an animation of the 10.7 µm imagery), Elida is in an environment of northerly/northwesterly shear: the strongest convection is forming south of the low-level circulation. This should in the short term inhibit significant strengthening. Douglas is moving into a region of cooler Sea-surface temperatures and is therefore weakening (SST imagery was captured here). Note, for example, how strong convection is not forming in the center of Douglas’ circulation.
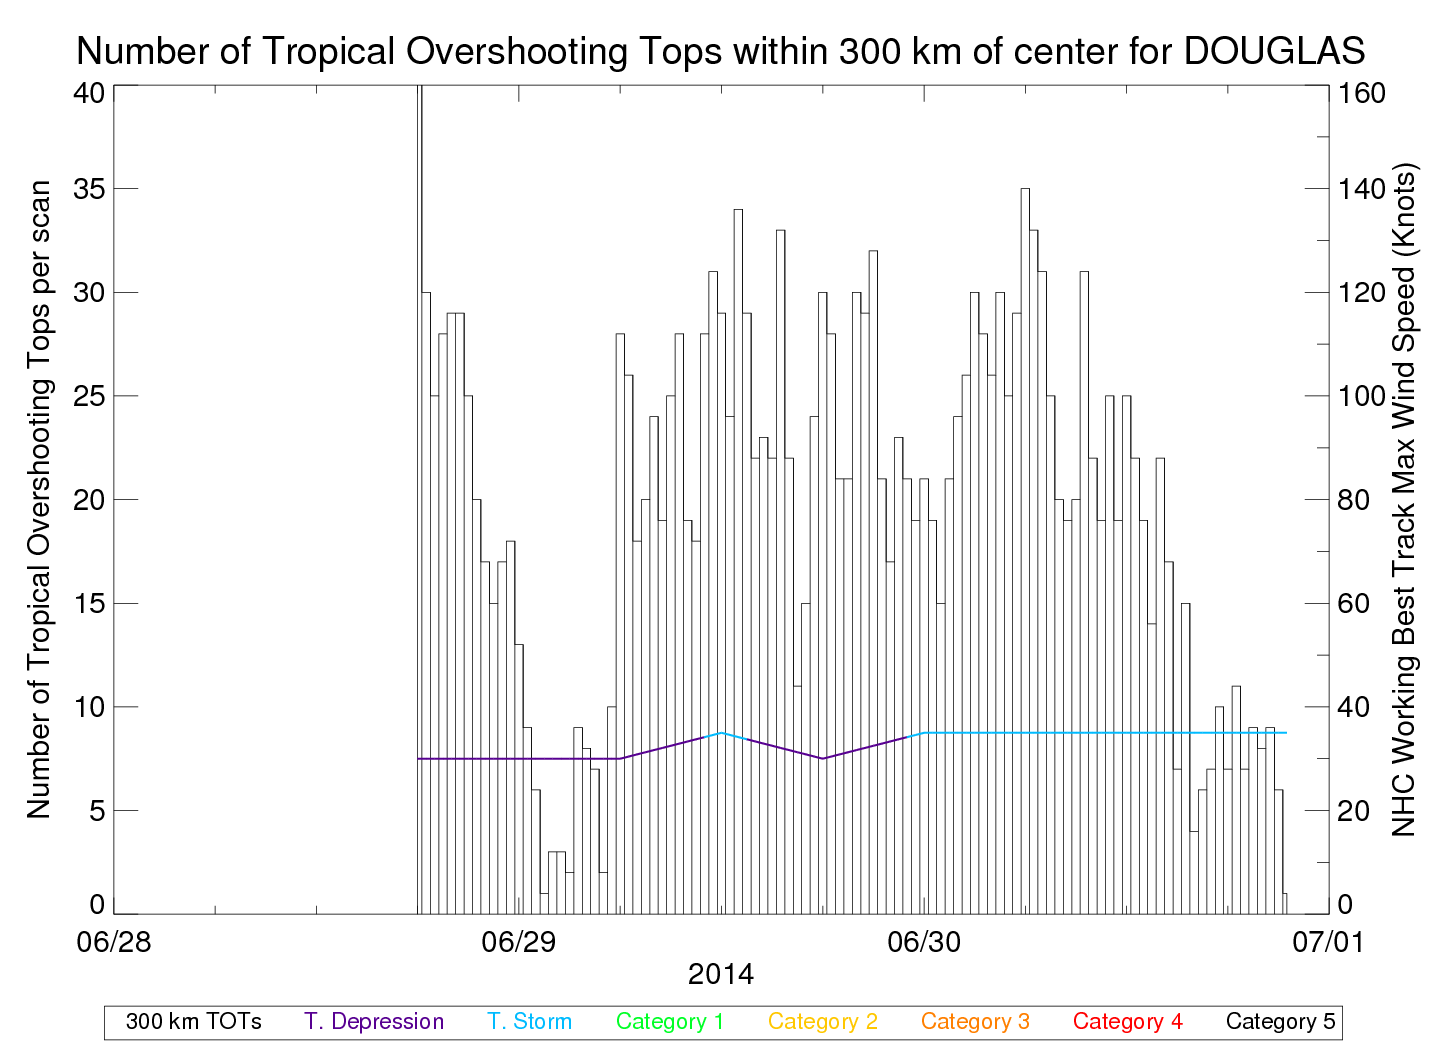
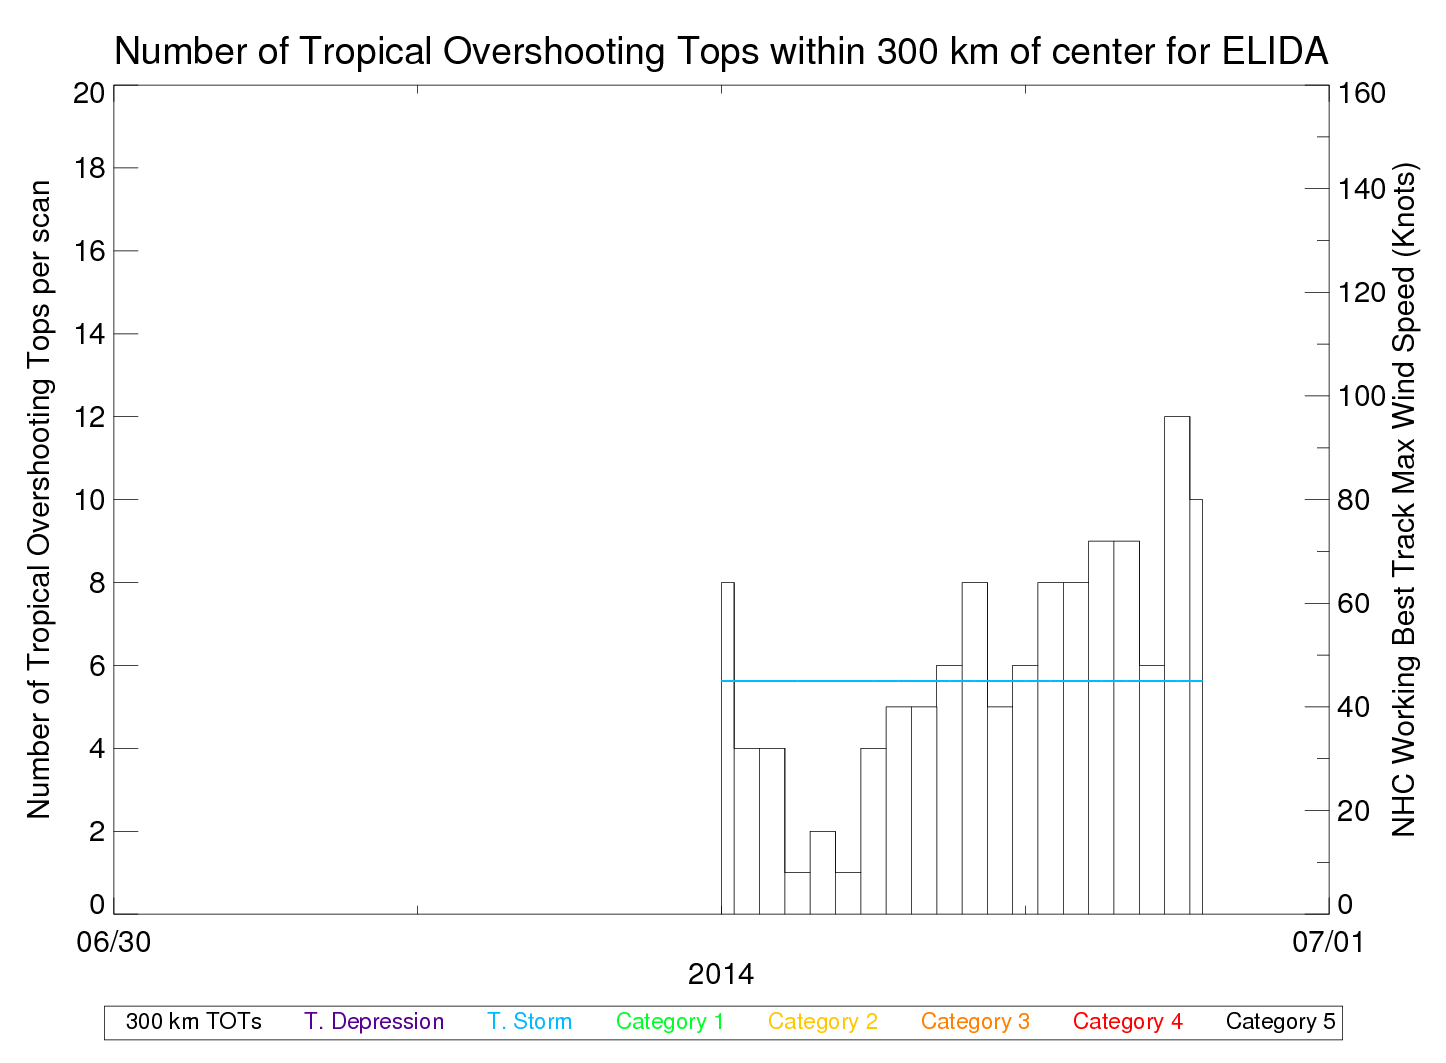
One observation that can be related to the vigor of a tropical cyclone is the number of overshooting tops (OTs) within the storm circulation. This website displays OTs for any active storm. The still image below shows the OTs detected over Douglas and Elida at 2130 UTC on 30 June. It is uncommon for a storm to weaken significantly in the short term when OTs persist. There are more OTs over Elida than over Douglas in this image. Here are time series for the number of OTs with Douglas and with Elida.
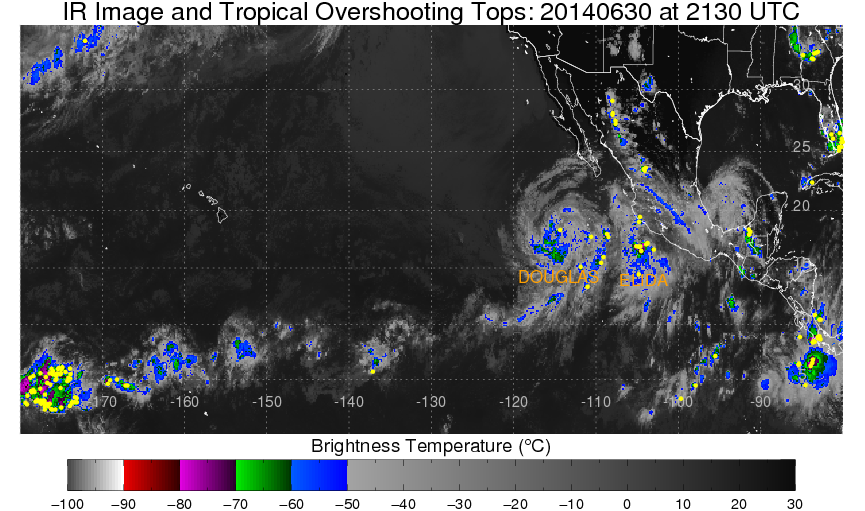
GOES-15 Automated Overshooting Tops detected over the eastern Pacific (click to enlarge)
View only this post Read Less


