
Unusual twin tornadoes (click here for a summary of photos/videos from the Capitol Weather Gang) formed in northeastern Nebraska (Storm Reports from SPC) late in the afternoon of the 16th of June 2014. How did satellite data anticipate the development and progression of the severe convection? GOES-13 Sounder data painted a picture of... Read More
Unusual twin tornadoes (click here for a summary of photos/videos from the Capitol Weather Gang) formed in northeastern Nebraska (Storm Reports from SPC) late in the afternoon of the 16th of June 2014. How did satellite data anticipate the development and progression of the severe convection? GOES-13 Sounder data painted a picture of ongoing destabilization in the area. For example, the CIMSS NearCast Product, which arises from a two-layer Lagrangian Transport Model of Equivalent Potential Temperature, shows increasing stability in a forecast for 2100 UTC on 16 June in forecasts from 1800, 1900 and 2000 UTC, below.
CIMSS NearCast forecasts of Theta-e Differences between two layers, all at 2100 UTC, with initial times at 1800, 1900 and 2000 UTC (click to animate)
The NearCast output, derived from GOES Sounder data, can predict in advance where axes of instability (and more importantly, where gradients in instability; see also comments on NearCast here and here) will occur. GOES Sounder data can also be used to diagnose the present state of the atmosphere. On this particular day, GOES Sounder estimates of Lifted Index (1400, 2000 and 0000 UTC) and CAPE (1400, 2000 and 0000 UTC) all showed ongoing destabilization over the Plains.

GOES-13 Sounder DPI Analyses of Lifted Index and Convective Available Potential Energy at 1400 and 2000 UTC on 16 June and at 0000 UTC on 17 June
The products above outline the general area where convection might develop. Once the convection has developed, the NOAA/CIMSS ProbSevere product can be used to diagnose/monitor the likelihood of severe weather (large hail, strong winds, or tornadoes) developing — specifically, the likelihood of when severe weather might first occur. The animation below shows the evolution of the tornadic cell as it moved northeastward through Nebraska. Satellite predictors (Normalized Vertical Growth Rate and Maximum Glaciation Rate) for this cell were strong; both were observed at 1925 UTC, nearly an hour before the observed severe weather. ProbSevere first exceeded 50% at 1950 UTC, 13 minutes before the warning at 2003 UTC. 1-inch diameter hail was reported at 2016 UTC. The first tornado report occurred at 2040 UTC.

NOAA/CIMSS ProbSevere model
MUCAPE in the ProbSevere product above is around 4000-5000 J/kg. A special sounding at OAX (1900 UTC) shows similar CAPE values.
The Suomi NPP satellite had a timely overpass over the Great Plains at around 2000 UTC on 16 June 2014. NUCAPS Soundings from Suomi NPP are available, as plotted below, and can be used to estimate instability.
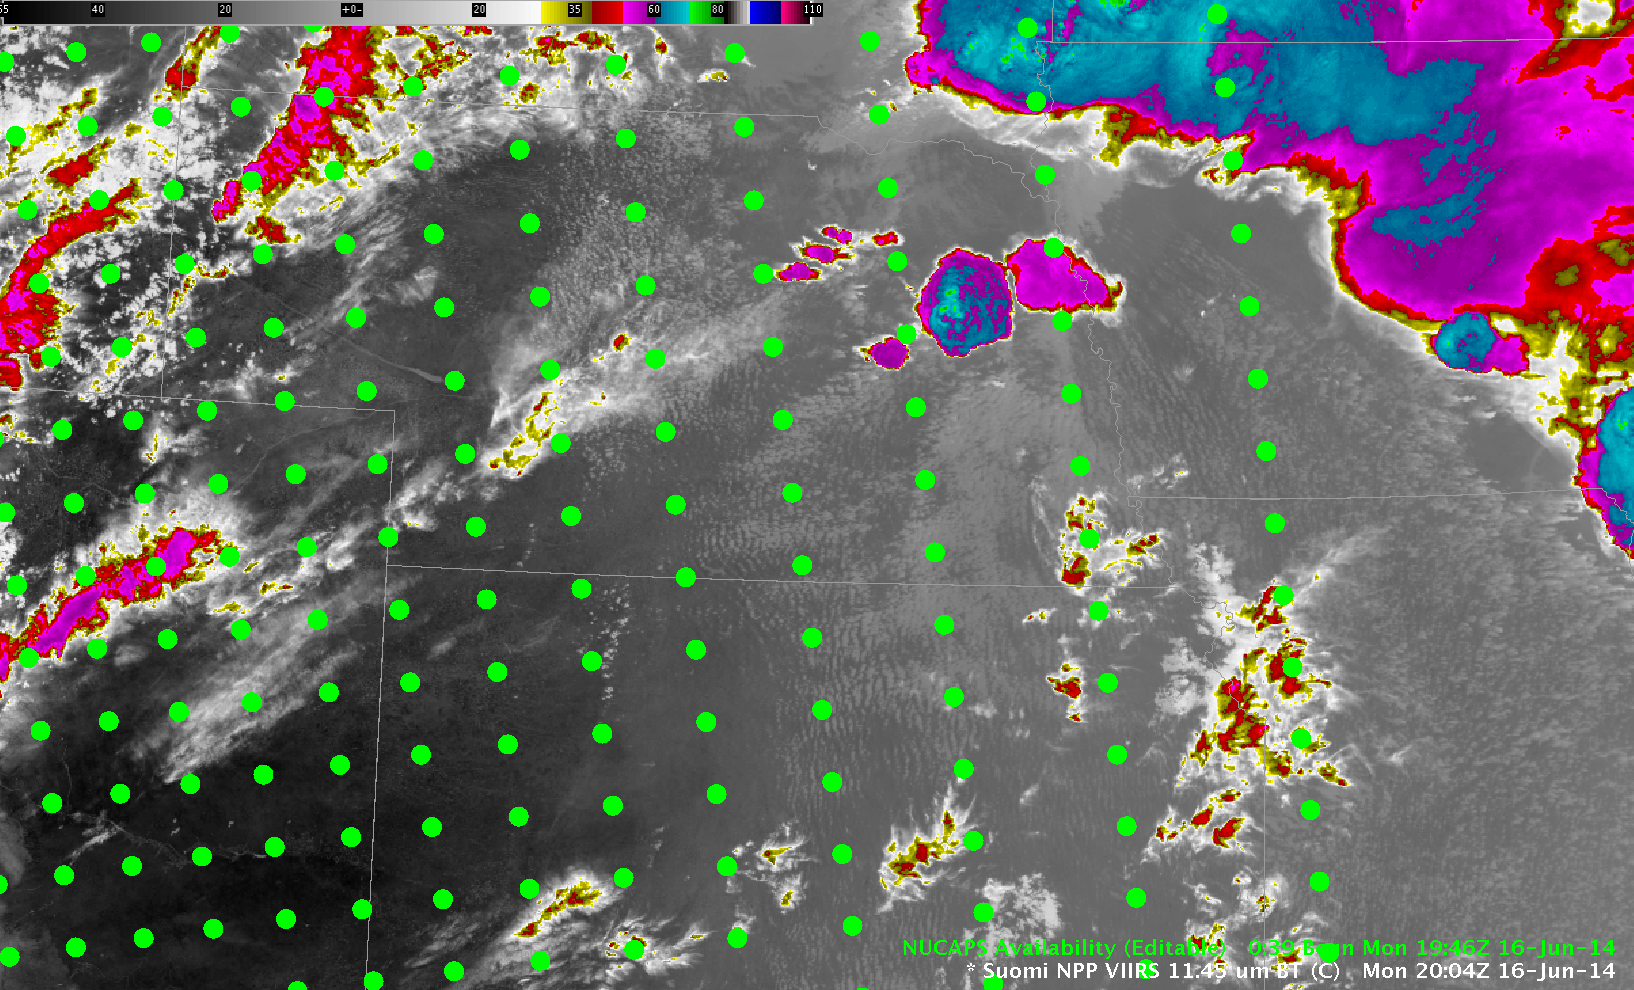
Suomi NPP VIIRS 11.45 µm imagery with NUCAPS sounding positions (Green Dots) Superimposed (Click to enlarge)
A sounding at ~42º N, ~97.8º W, below, shows CAPE values around 1000. However, note that the boundary layer temperature and dewpoint are too cool (surface temperature = 21º C) and too dry (surface dewpoint = 12º C). A benefit of the Sounding Software in AWIPS II, however, is that soundings can be easily modified. If the boundary layer is altered such that dewpoints are closer to observed METAR values (20º C), then CAPE values increase to 3000; if the temperatures are modified to be closer to observed values, CAPE increases to more than 4800.
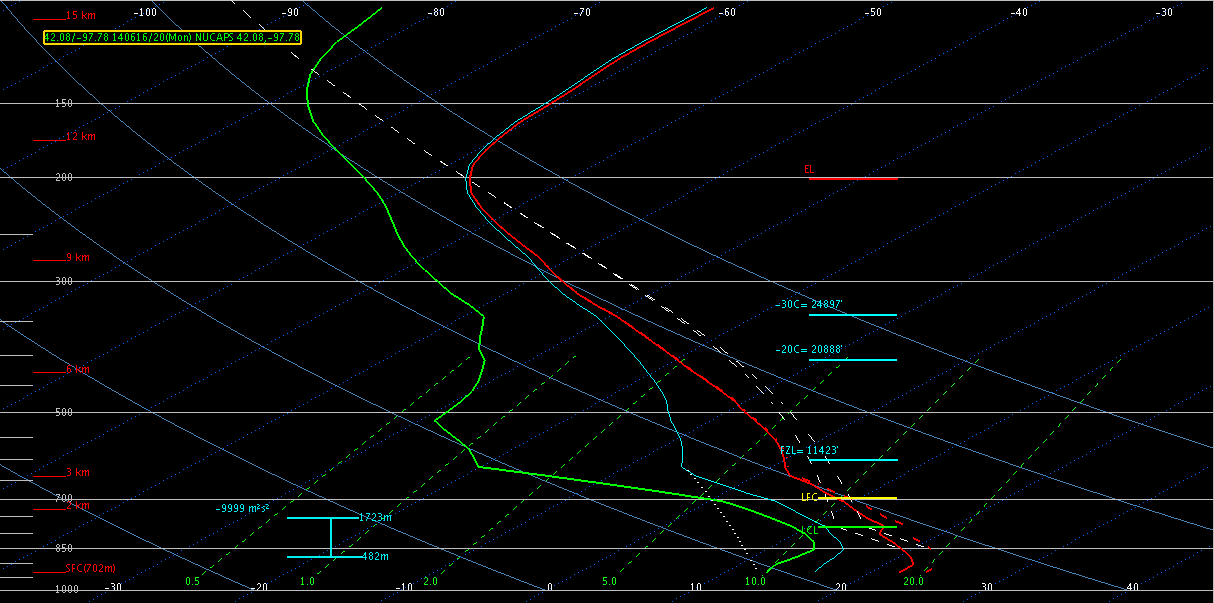
NUCAPS Sounding at 42.07 N, 97.78 W, ~2000 UTC on 16 June 2014 (Click to enlarge)
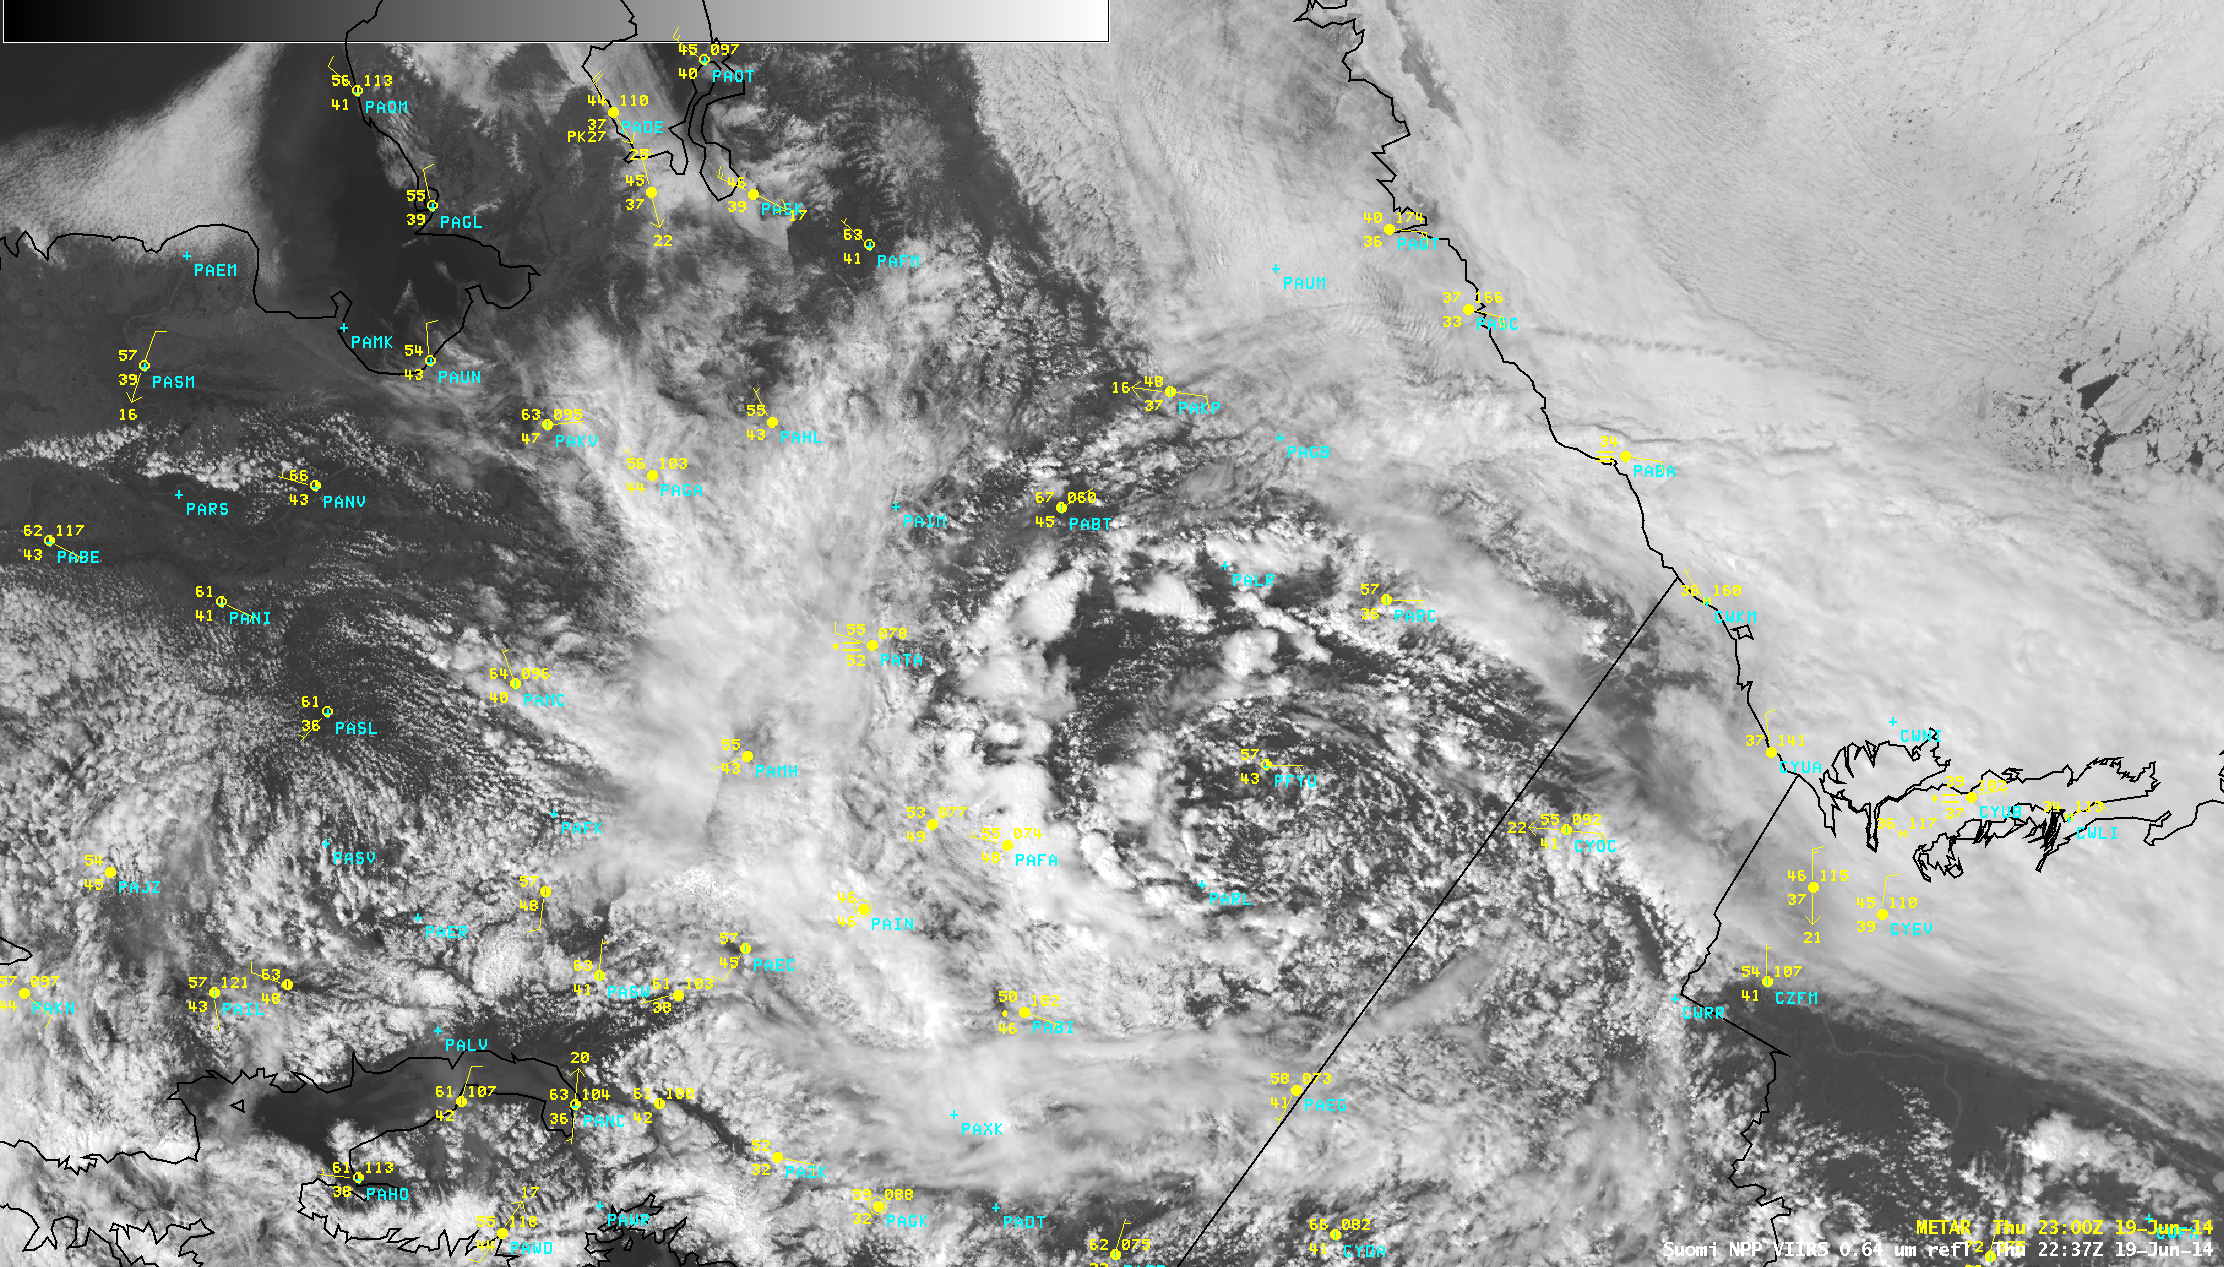
Suomi NPP VIIRS data at different wavelengths (0.64 µm visible, 1.61 µm near-IR and 11.45 µm longwave IR), below, give a view of the storm just before severe hail was observed. The 1.61 µm imagery suggests a fully-glaciated anvil, and the 11.45 µm imagery shows evidence of several isolated overshooting tops.
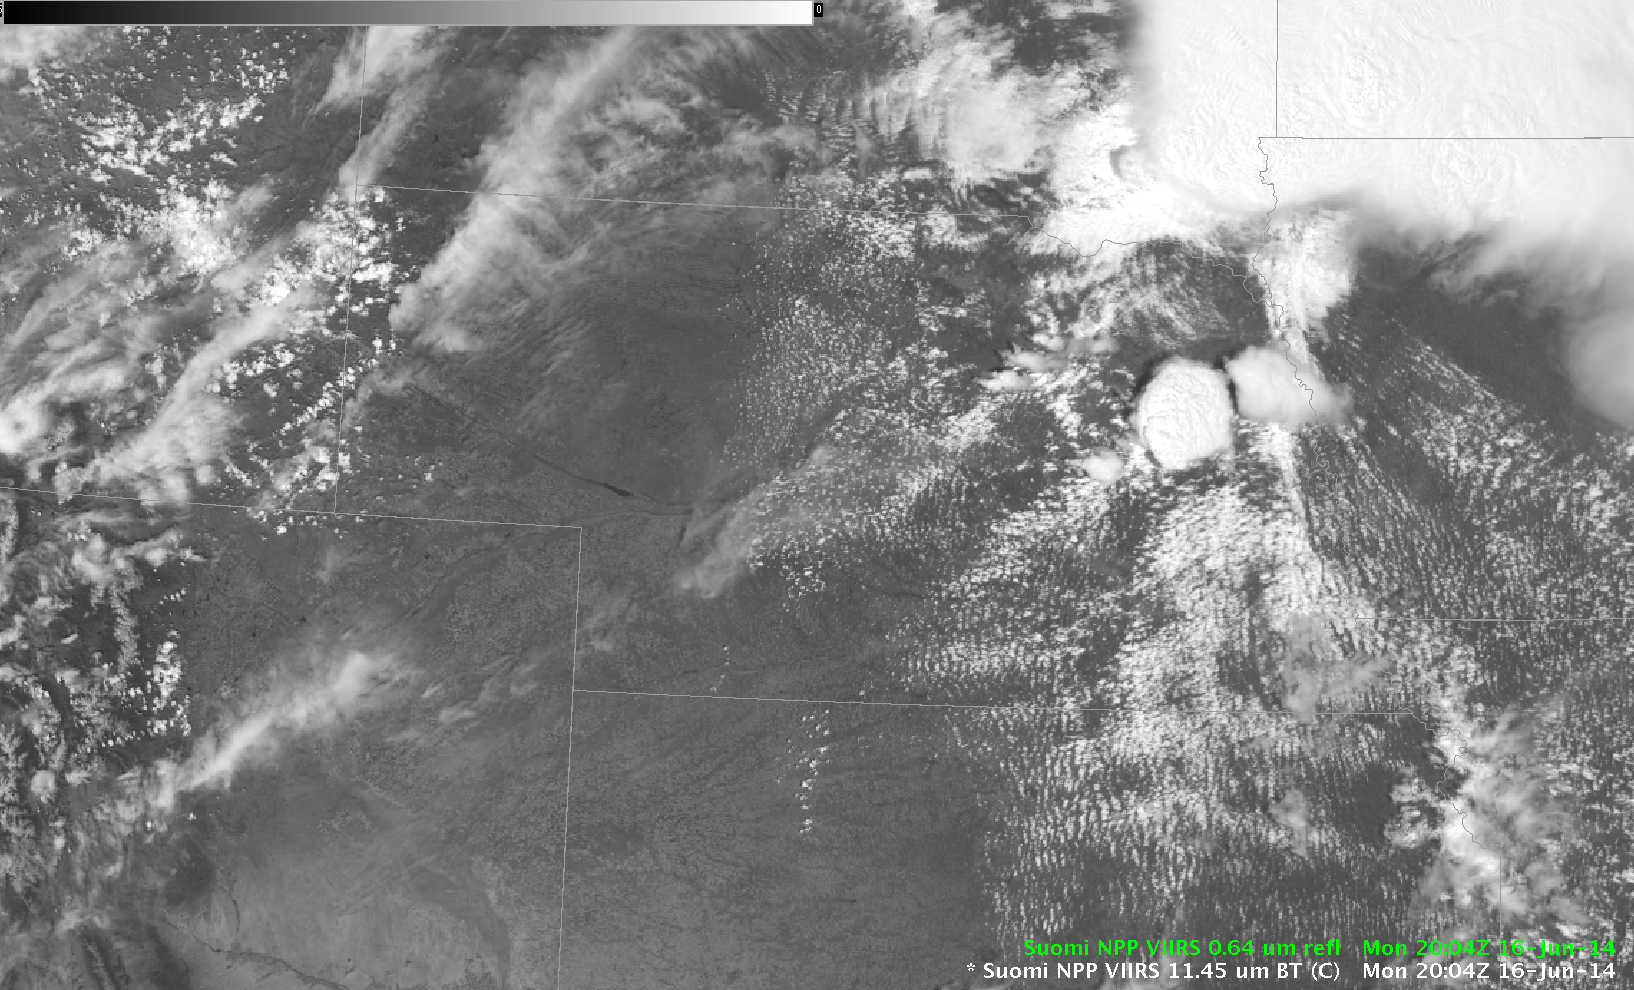
Suomi NPP VIIRS data (0.64 µm, 1.61 µm and 11.45 µm) at 2004 UTC on 16 June 2014 (Click to animate)
Click here for a visible image animation from GOES-13; here is an infrared image animation. The famous twin tornadoes in Elkhart, IN, during the Palm Sunday outbreak in 1965 can be seen here.
View only this post
Read Less


