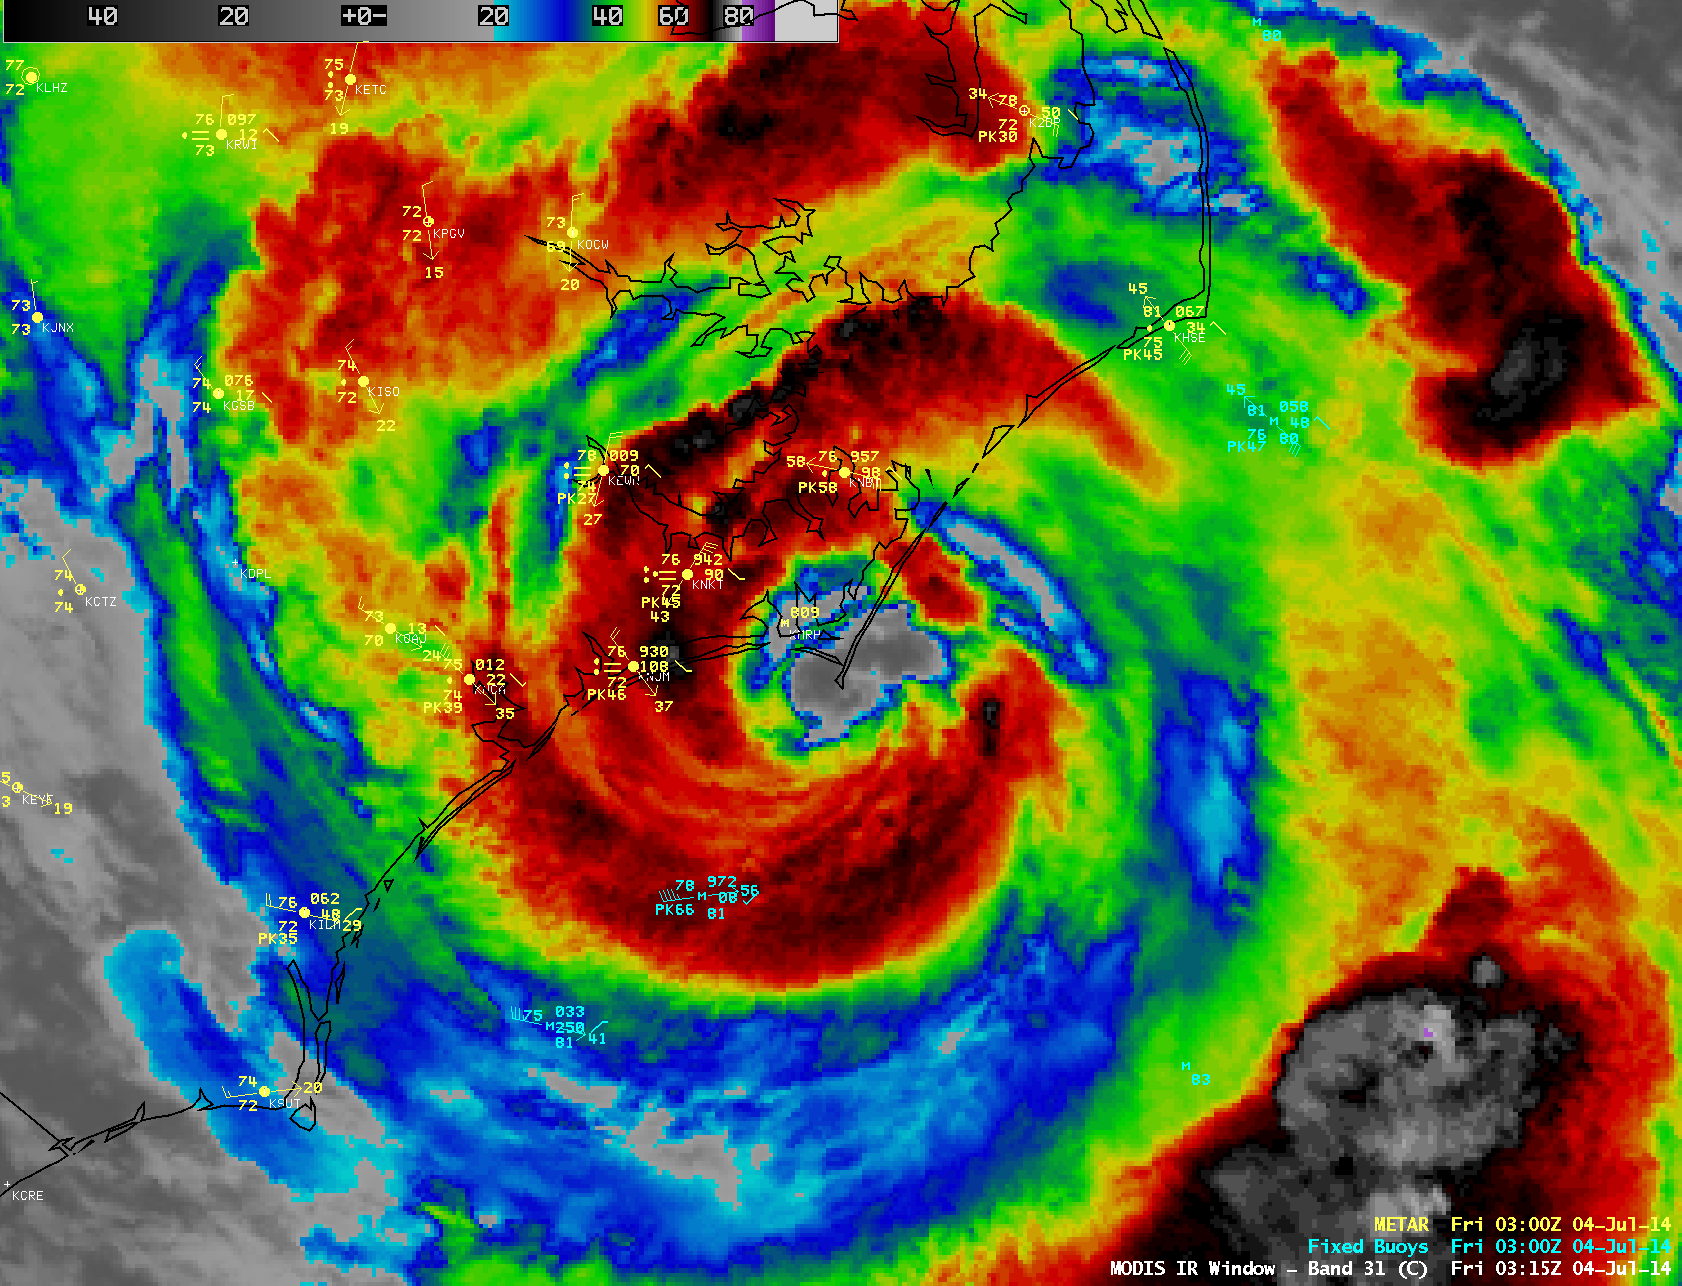
GOES-13 6.5 µm water vapor channel images with surface pressure and frontal analyses
GOES-13 6.5 µm water vapor channel images with overlays of surface pressure and frontal analyses (above) showed Category 2 Hurricane Arthur (NHC discusions | blog post) transitioning to a powerful extratropical (or “post-tropical”) storm as it moved northward over the Maritime Provinces of Canada on 05 July 2014. Impacts of Hurricane Arthur along the East Coast of the US included a peak wind gust of 101 mph at Cape Lookout, North Carolina, and over 6 inches of rainfall in eastern Maine.
A long animation of 4-km resolution GOES-13 6.5 µm water vapor channel images covering the period 00:15 UTC on 05 July to 12:15 UTC on 06 July (below; click image to play animation; also available as an MP4 movie file) showed a very pronounced area of dry air (bright yellow to red color enhancement) wrapping into the circulation of the storm. Also evident on the water vapor imagery was the subsequent development of a “sting jet” signature along the southwestern and southern flank of the storm — this feature was associated with very strong winds (peak gust of 138 km/h or 86 mph) being transported down to the surface over parts of Nova Scotia and New Brunswick (Canadian Hurricane Centre statement). The sting jet signature resembles a “scorpion tail” (22:45 UTC image); note that there is a significant parallax offset with the >50 degree satellite viewing angle of GOES-13 imagery over this region, so the sting jet signature was actually located farther to the south over Nova Scotia (where the strongest surface winds were observed). Other notable sting jet cases appear here, here and here.
GOES-13 6.5 µm water vapor channel images (click to play animation)
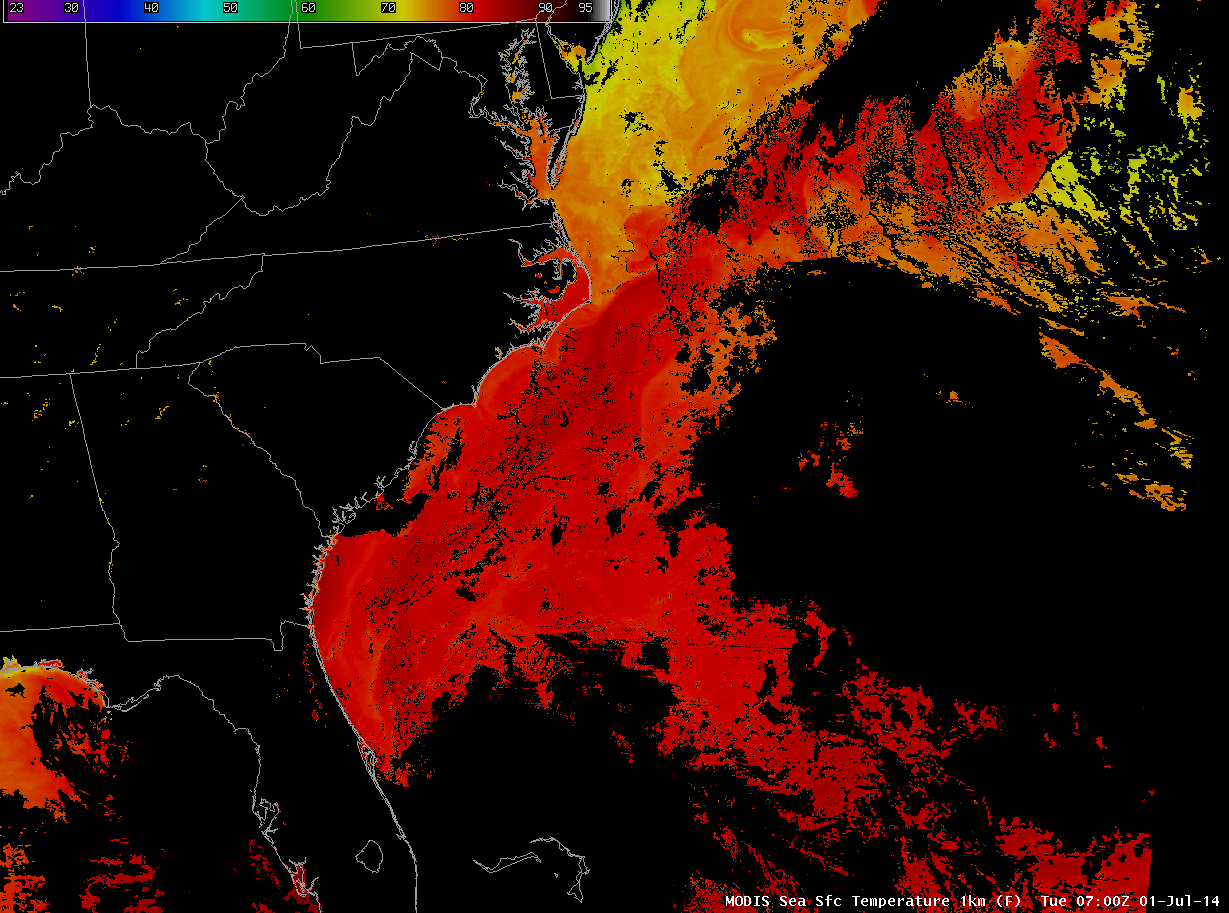
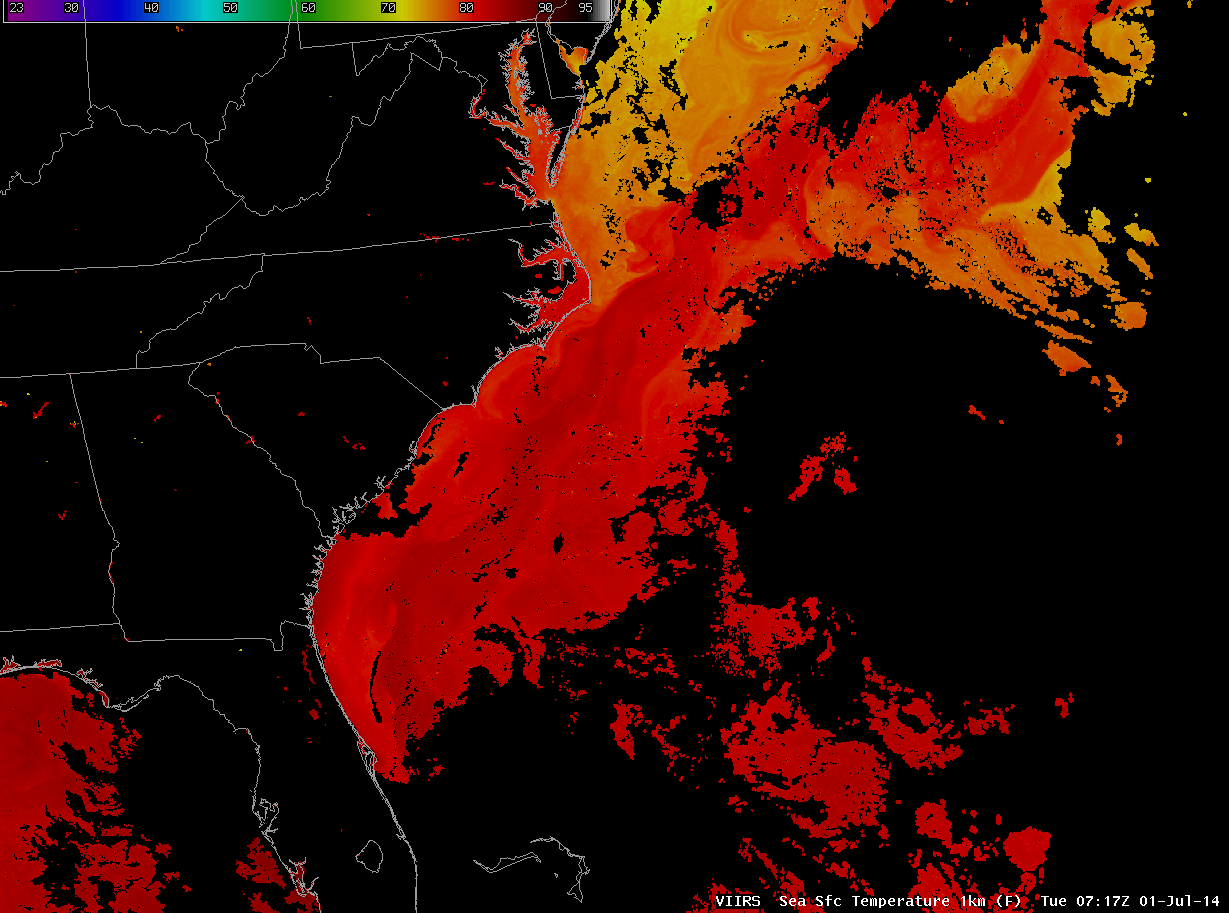
As an aside, it is interesting to examine the effect that the northeastward passage of Hurricane Arthur had on the pattern of sea surface temperatures in the far western Atlantic Ocean off the East Coast of the US. The Suomi NPP VIIRS Sea Surface Temperature (SST) product at 17:27 UTC on 05 July (below) revealed a number of filaments and eddies along the path of the tropical cyclone. A comparison with the 00 UTC 05 July Real-Time Global Sea Surface Temperature High-Resolution (RTG_SST_HR) analysis showed that even a 1/12 degree resolution model had difficulty resolving many of these subtle SST features — this helps to underscore the value of high-spatial resolution satellite imagery for making highly-accurate assessments of such fields as SST.
Suomi NPP VIIRS Sea Surface Temperature product, with a comparison to the RTG_SST_HR analysis
View only this post Read Less


