GOES-14 0.63 µm visible channel images (click to play animation)
The GOES-14 satellite was placed into Super Rapid Scan Operations for GOES-R (SRSOR) mode on 14 August 2014, providing imagery at 1-minute intervals with the goal of monitoring the western US for convection and/or wildfire activity. McIDAS images of 0.63 µm visible channel data (above; click image to play animation; also available as an MP4 movie file) showed the development of clusters of slow-moving thunderstorms in the Las Vegas, Nevada region. These storms produced strong winds (gusts estimated at 60 mph) and heavy rainfall which caused flash flooding: Boulder City in far southern Nevada (located just east of Henderson, station identifier KHND) received 0.75 inch of rain in only 30 minutes. In addition to the state boundaries and yellow station identifiers, Interstate highways are drawn in red and State highways are cyan.
Another item of interest to note on the GOES-14 visible images: Lake Mead located to the east of Las Vegas was at an all-time record low level (1080.19 feet on 12 August) since it was filled back in the 1930s. The dark blue map outline represents the boundary of the lake as recently as the mid-1990s; the current area occupied by the darker water in Lake Mead’s Overton Arm (which extends northward) is drastically smaller in size, a result of the long-term severe to extreme drought.
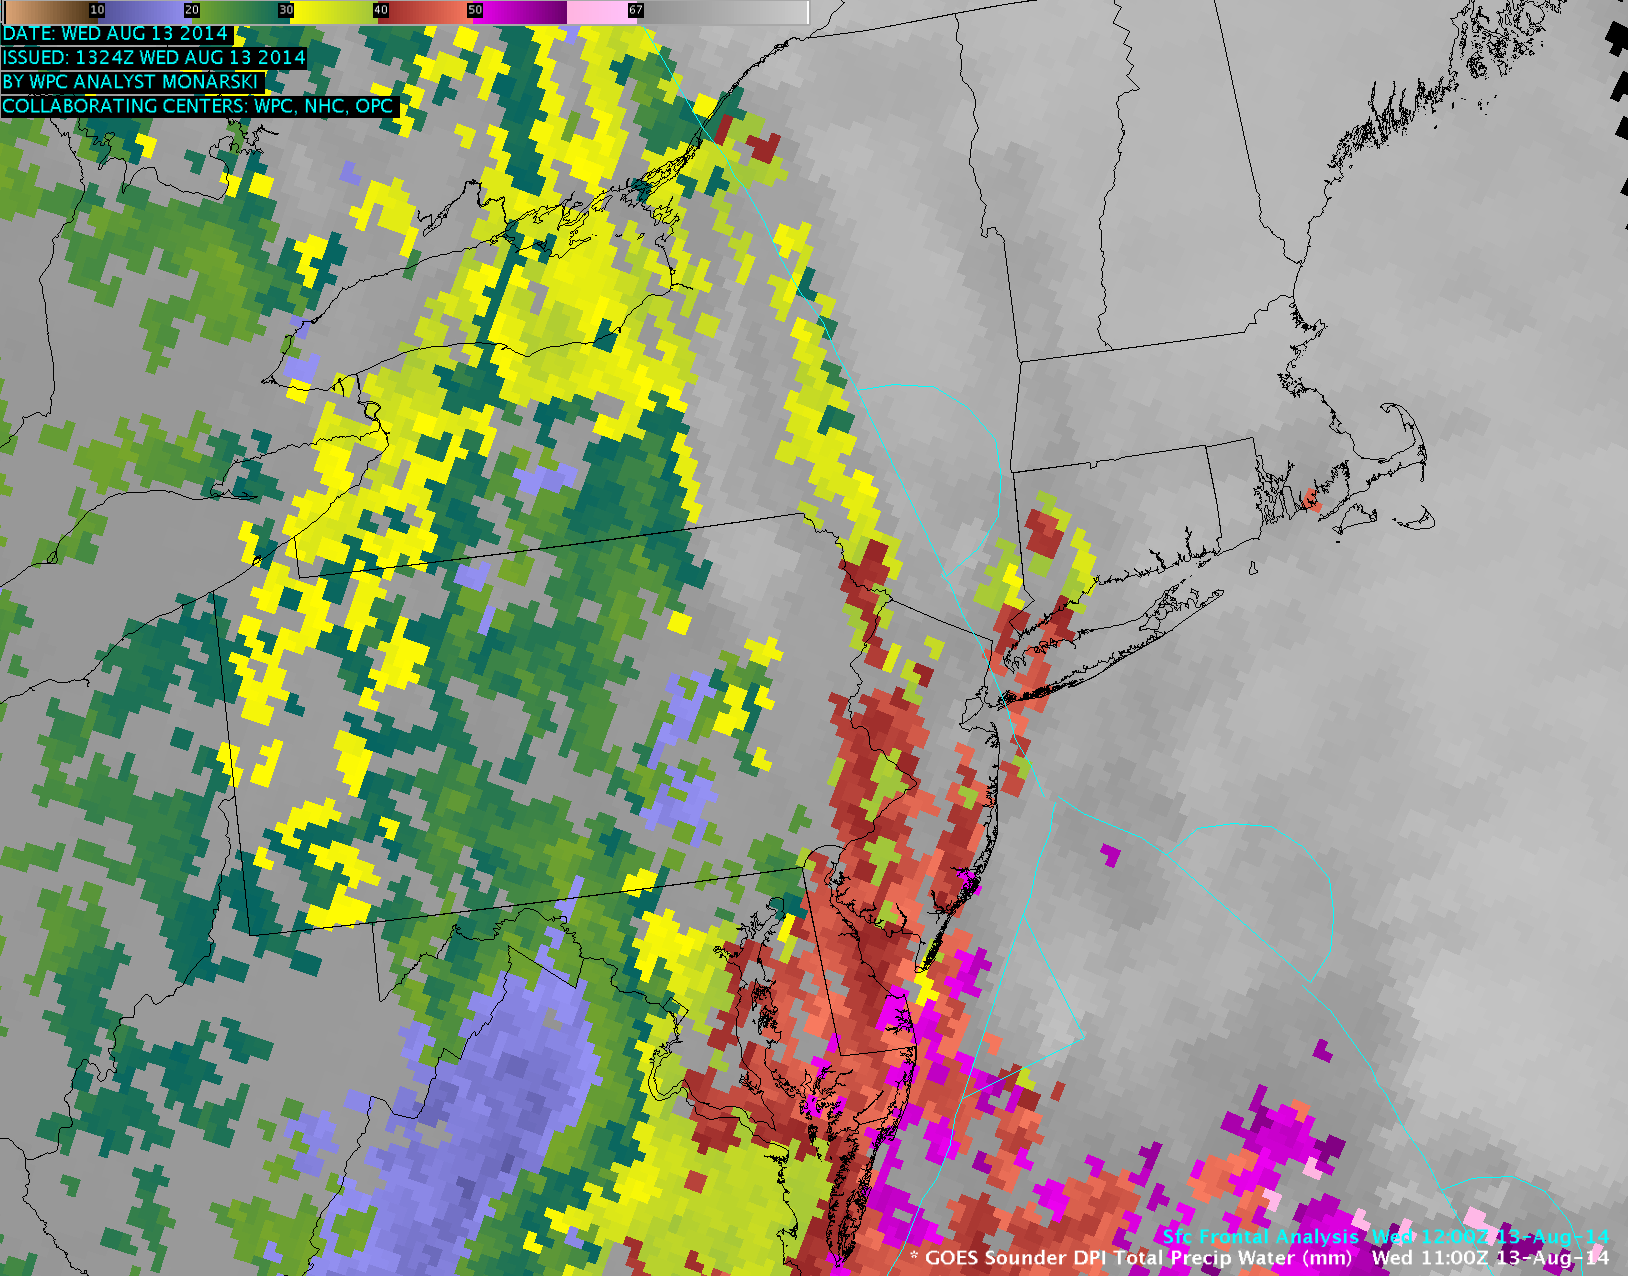
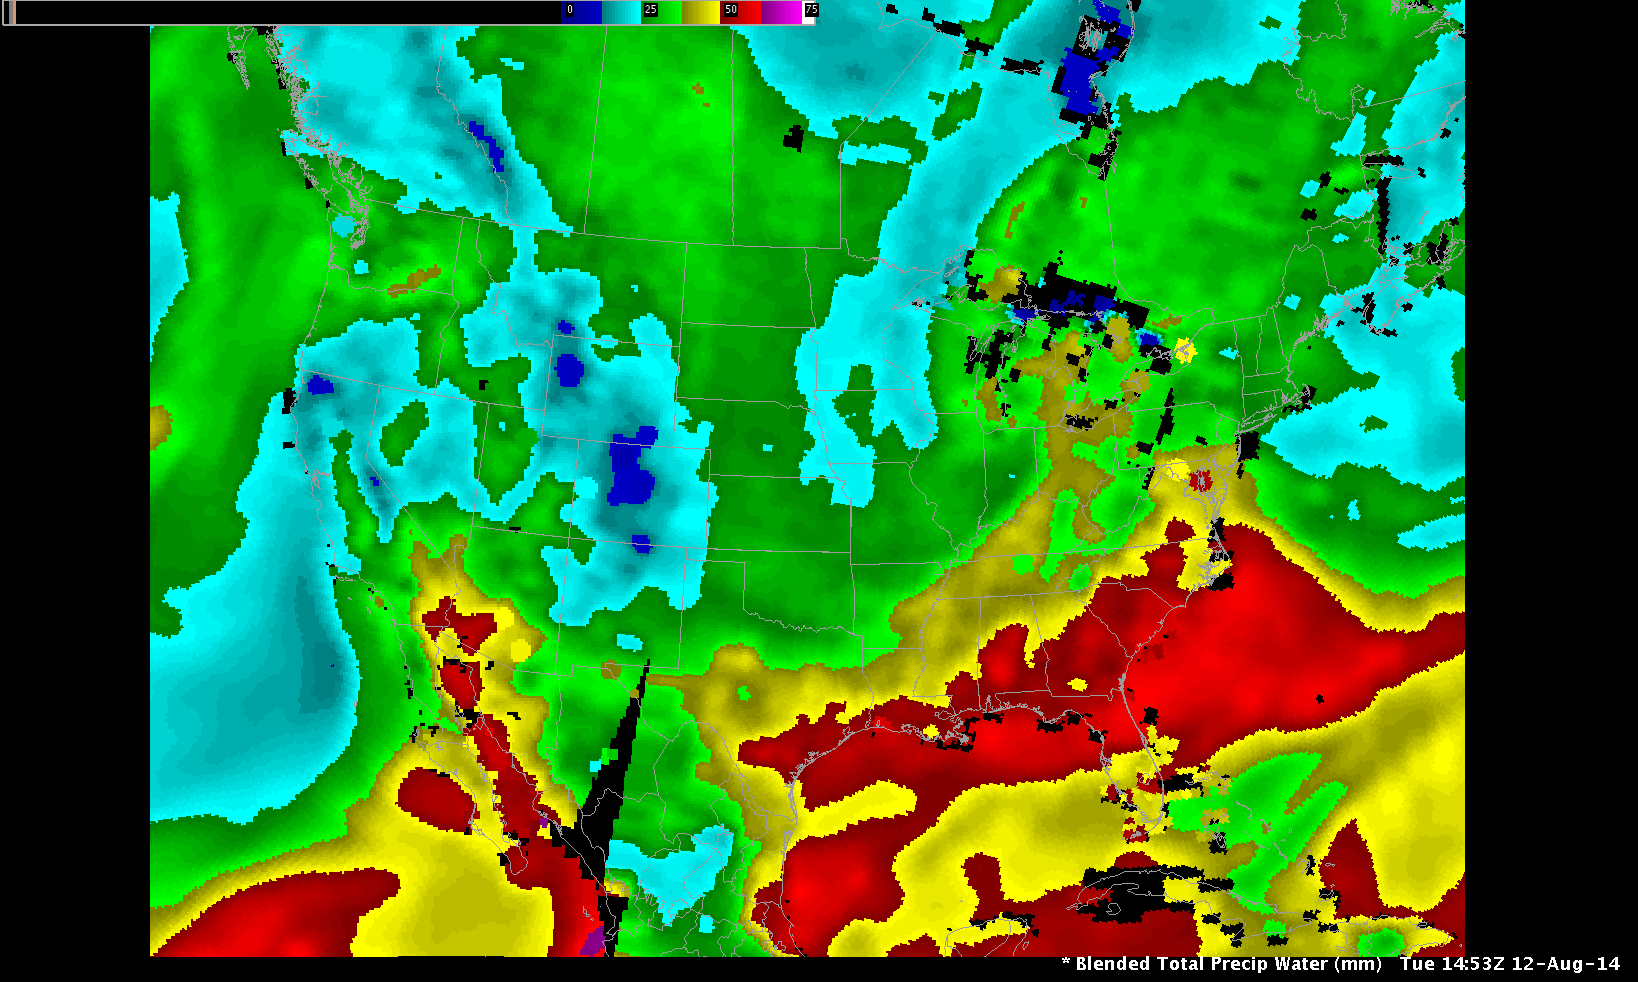
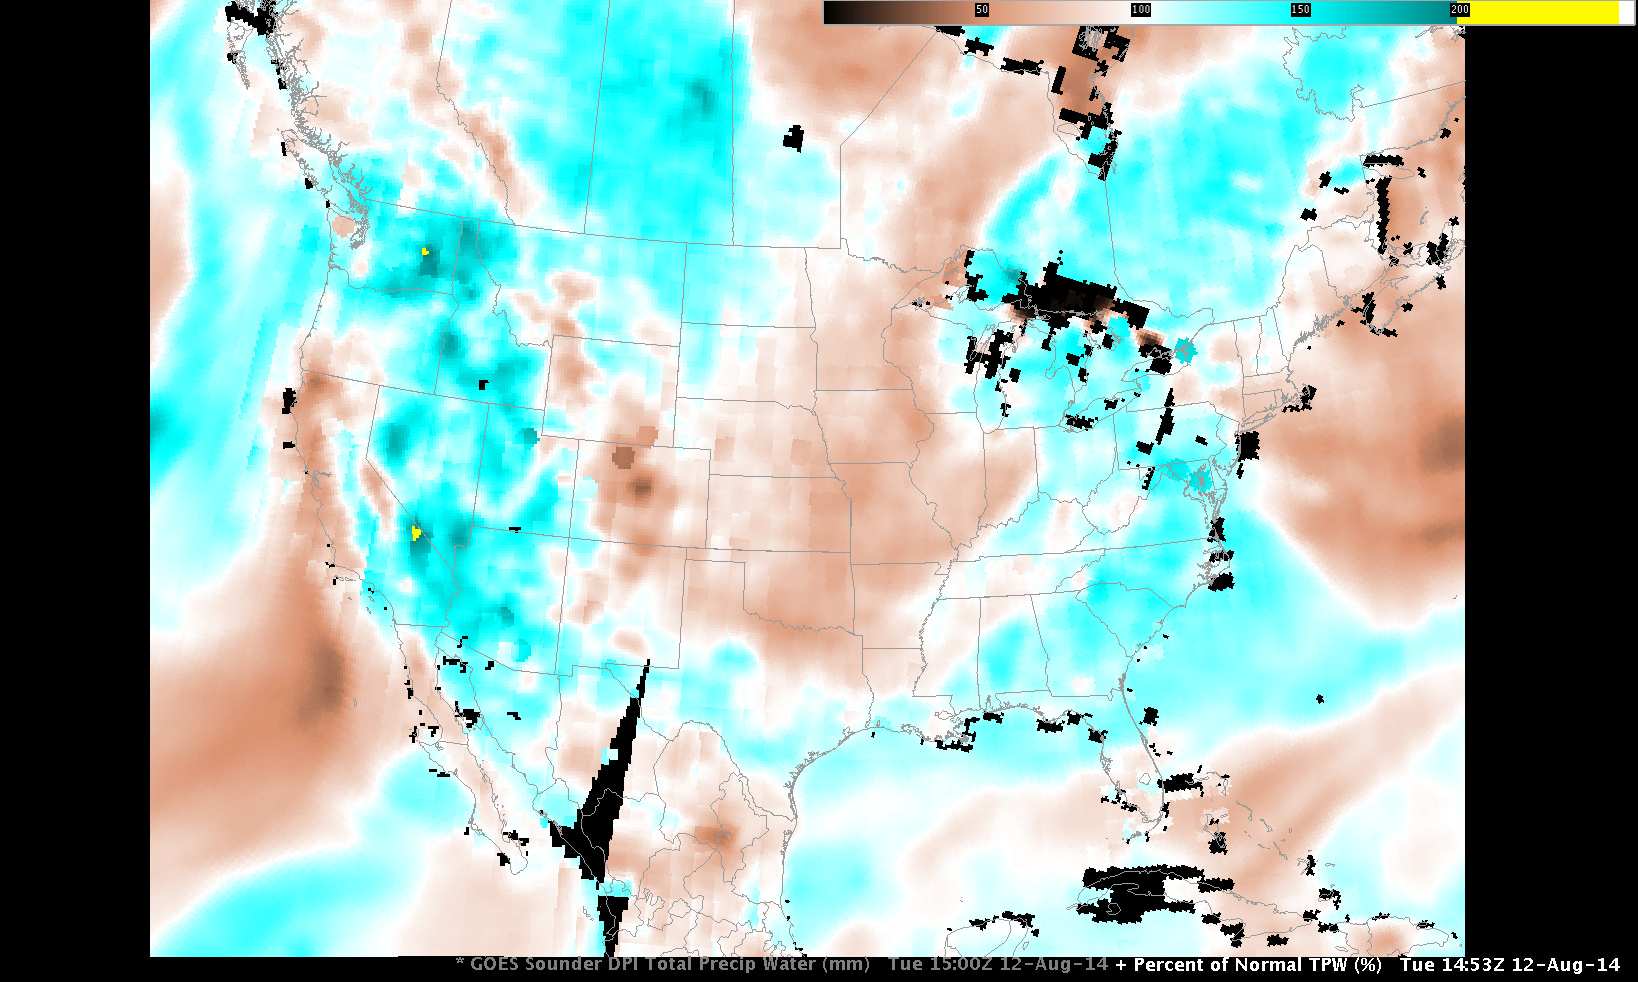
AWIPS-2 images of the GOES-15 sounder Total Precipitable Water (TPW) derived product (below; click image to play animation) showed that these thunderstorms developed along a very sharp moisture boundary that was oriented roughly southwest to northeast across the area — TPW values of 30-40 mm (1.2-1.6 inches, yellow to red color enhancement) were seen east of the boundary, with TPW values of 10-20 mm (0.4-0.8 inch, shades of blue) west of the boundary.
GOES-15 sounder Total Precipitable Water derived product images (click to play animation)
View only this post Read Less

