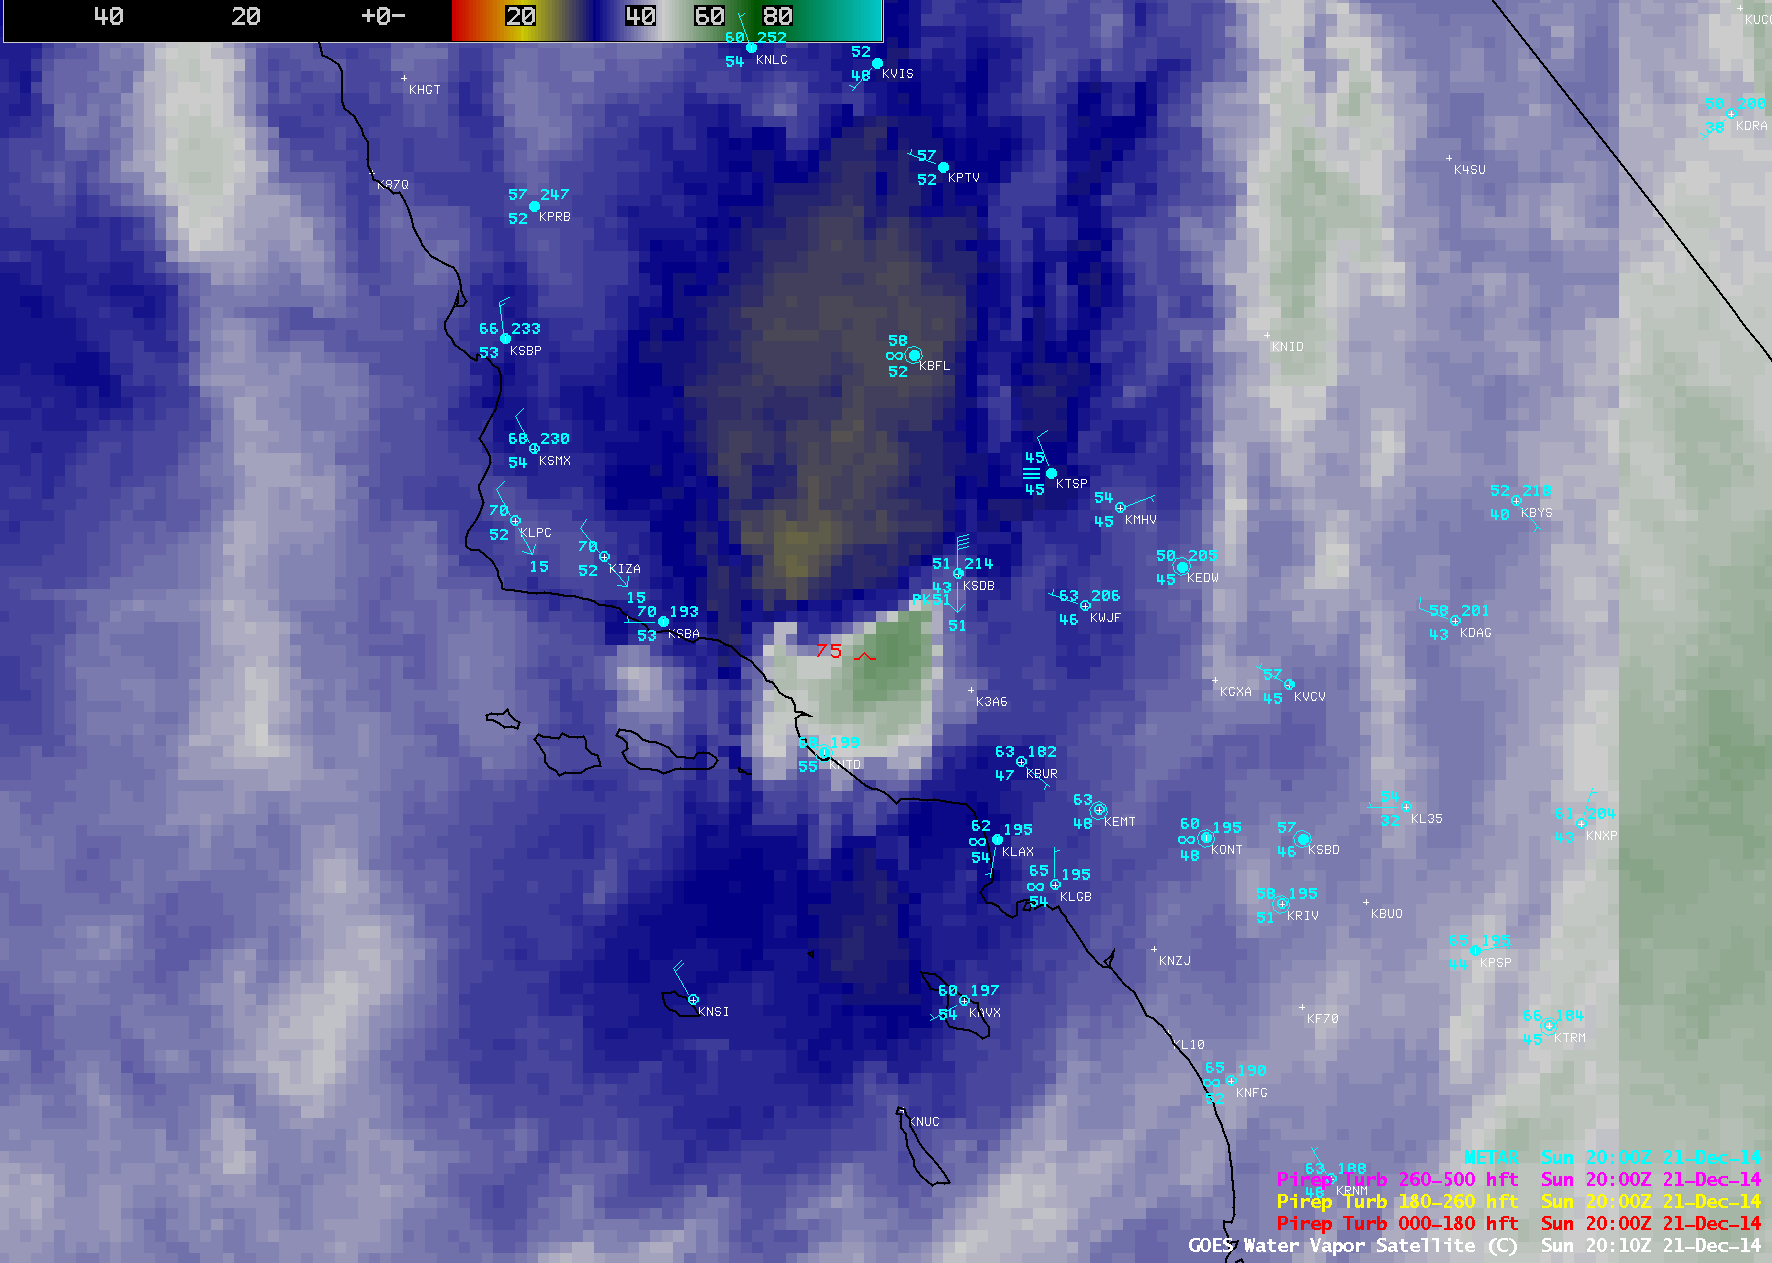

GOES-15 6.5 µm water vapor channel images click to play animation)
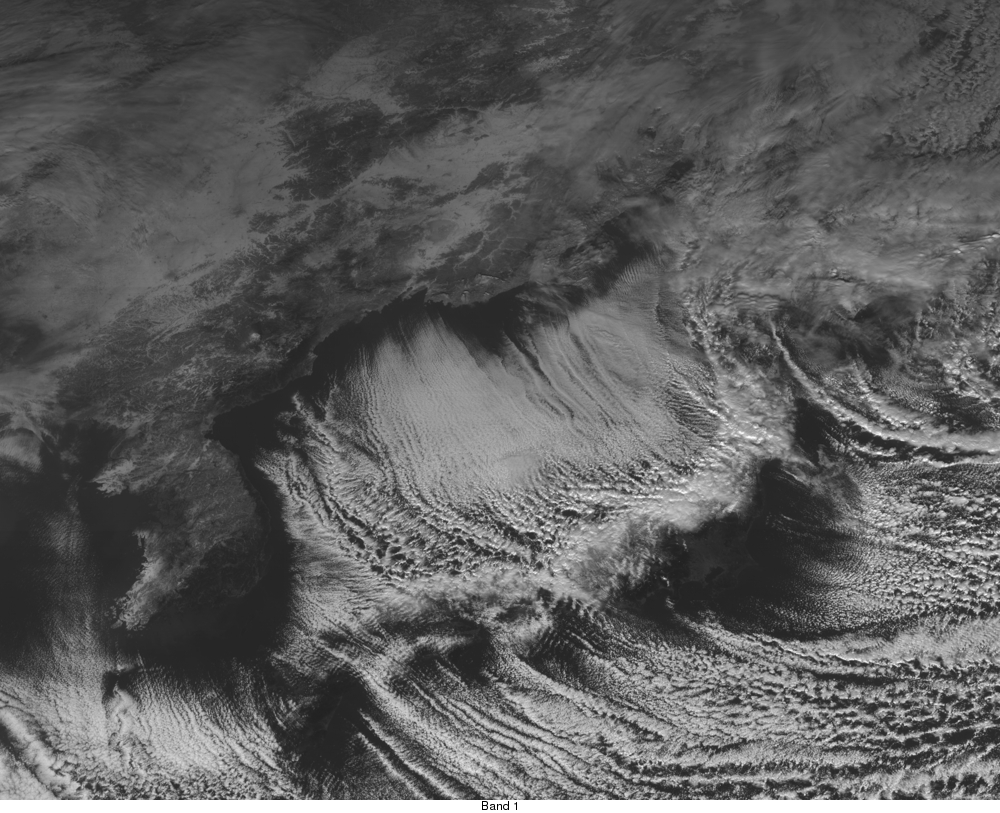
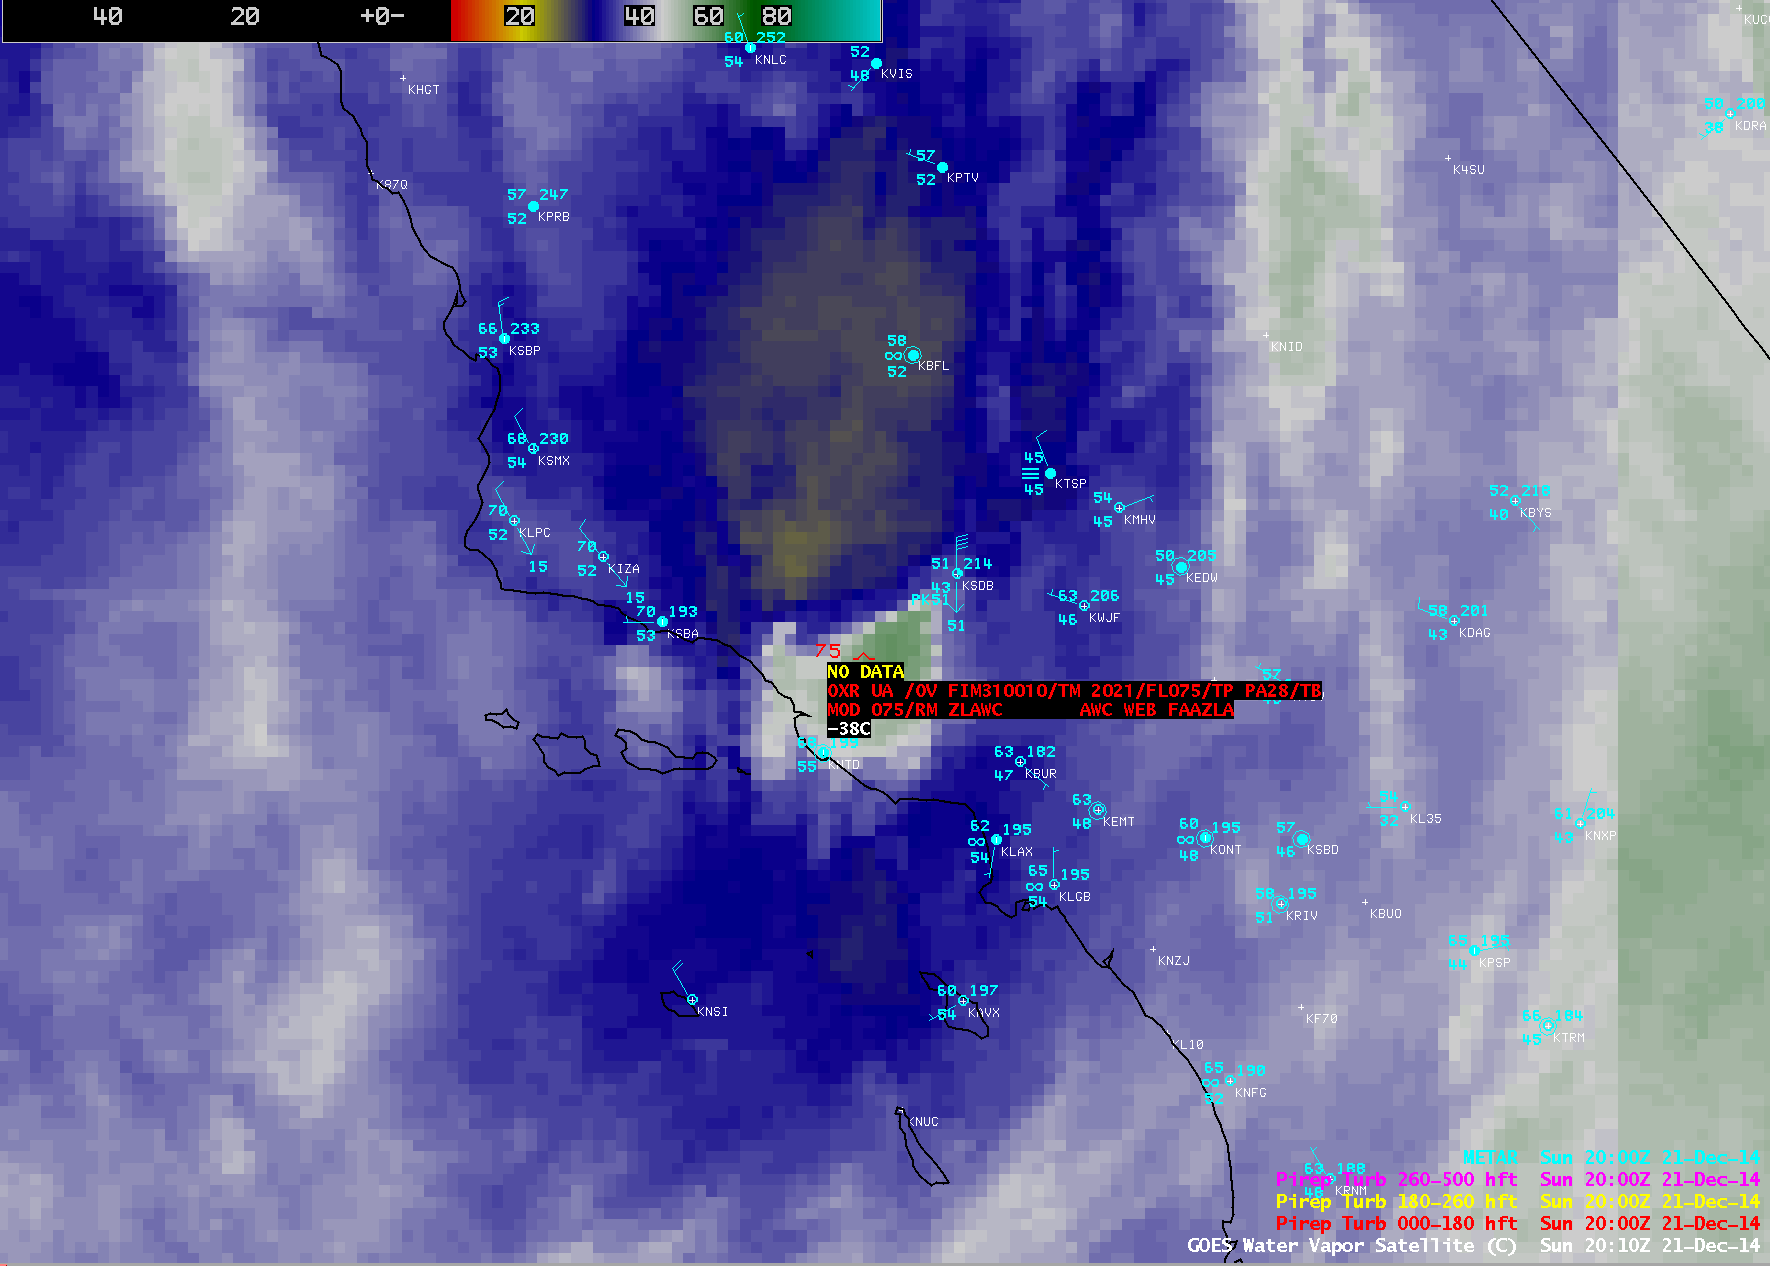
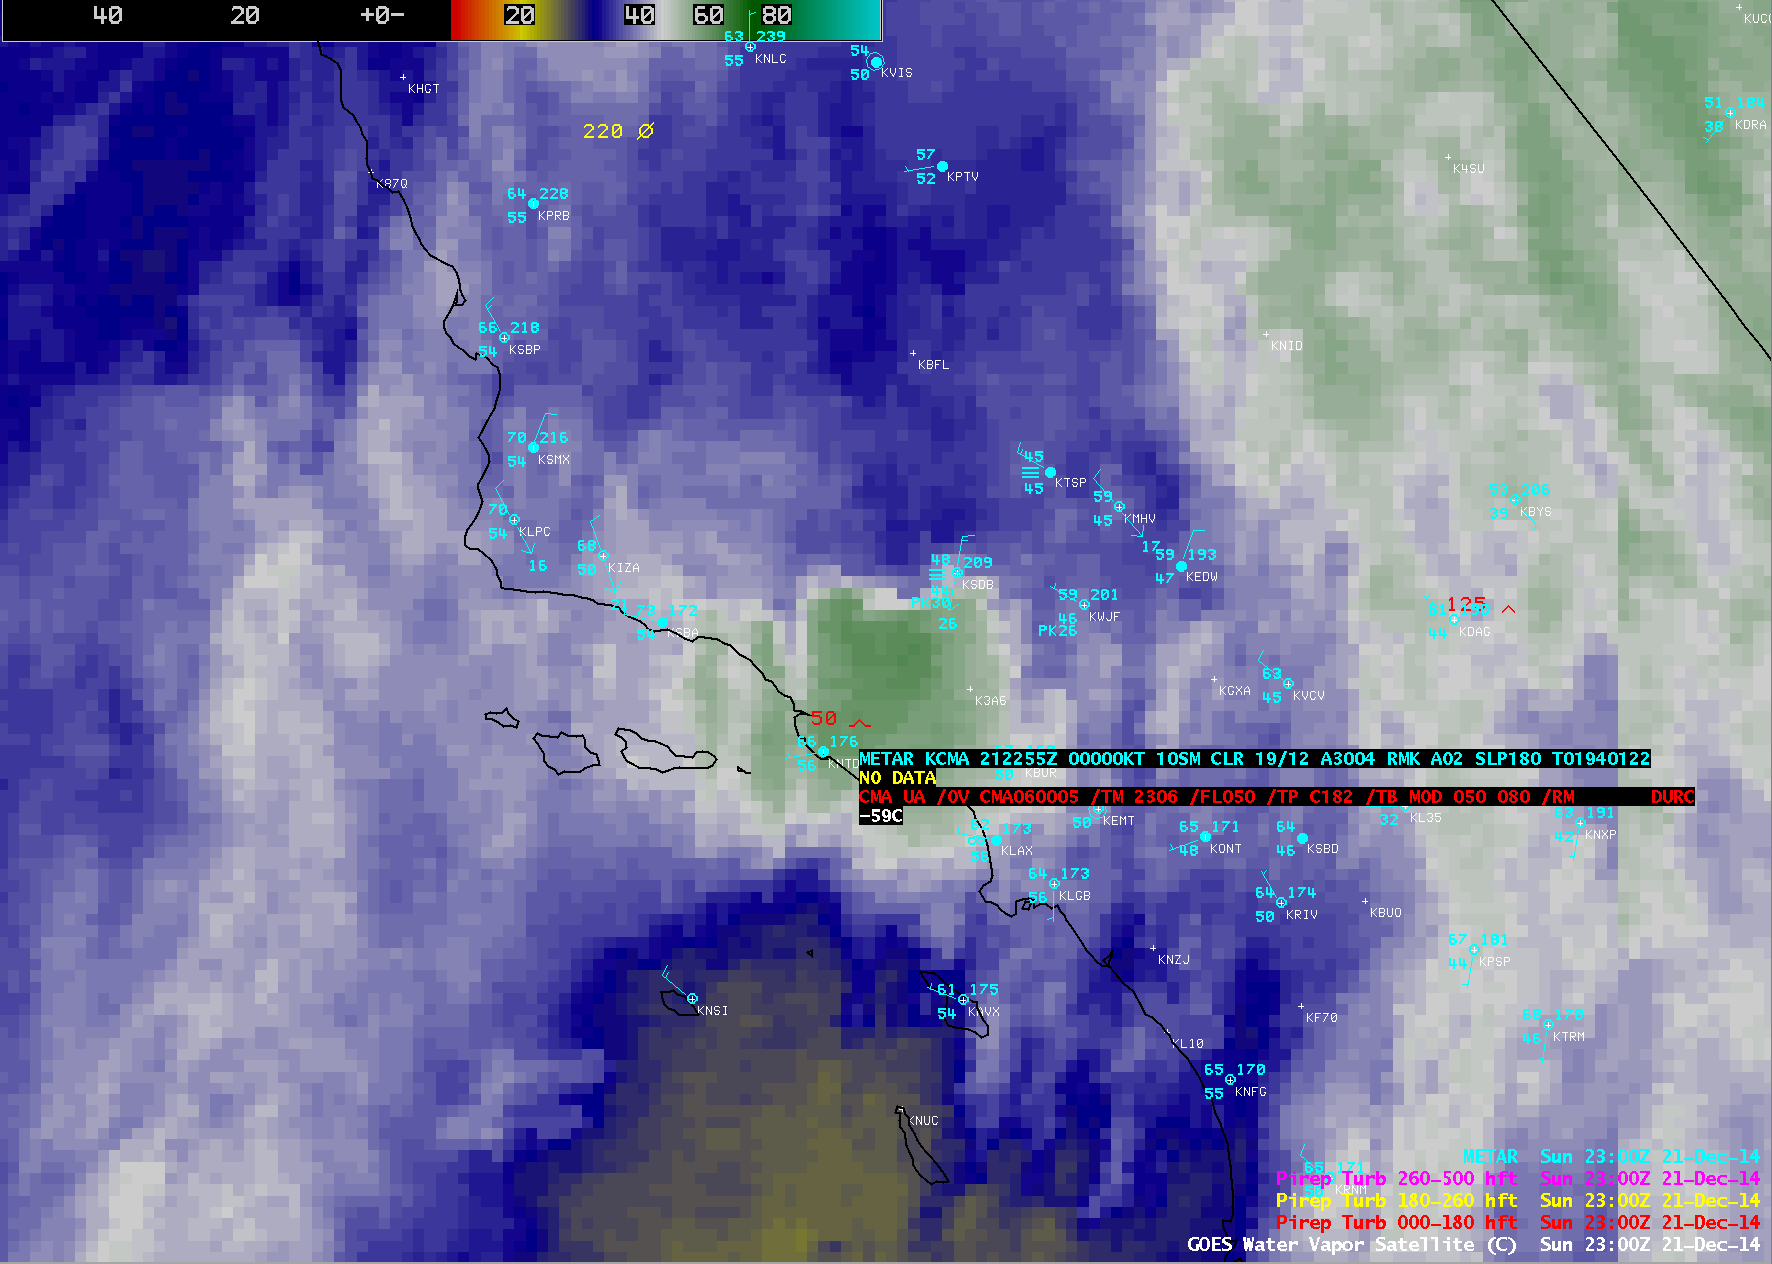
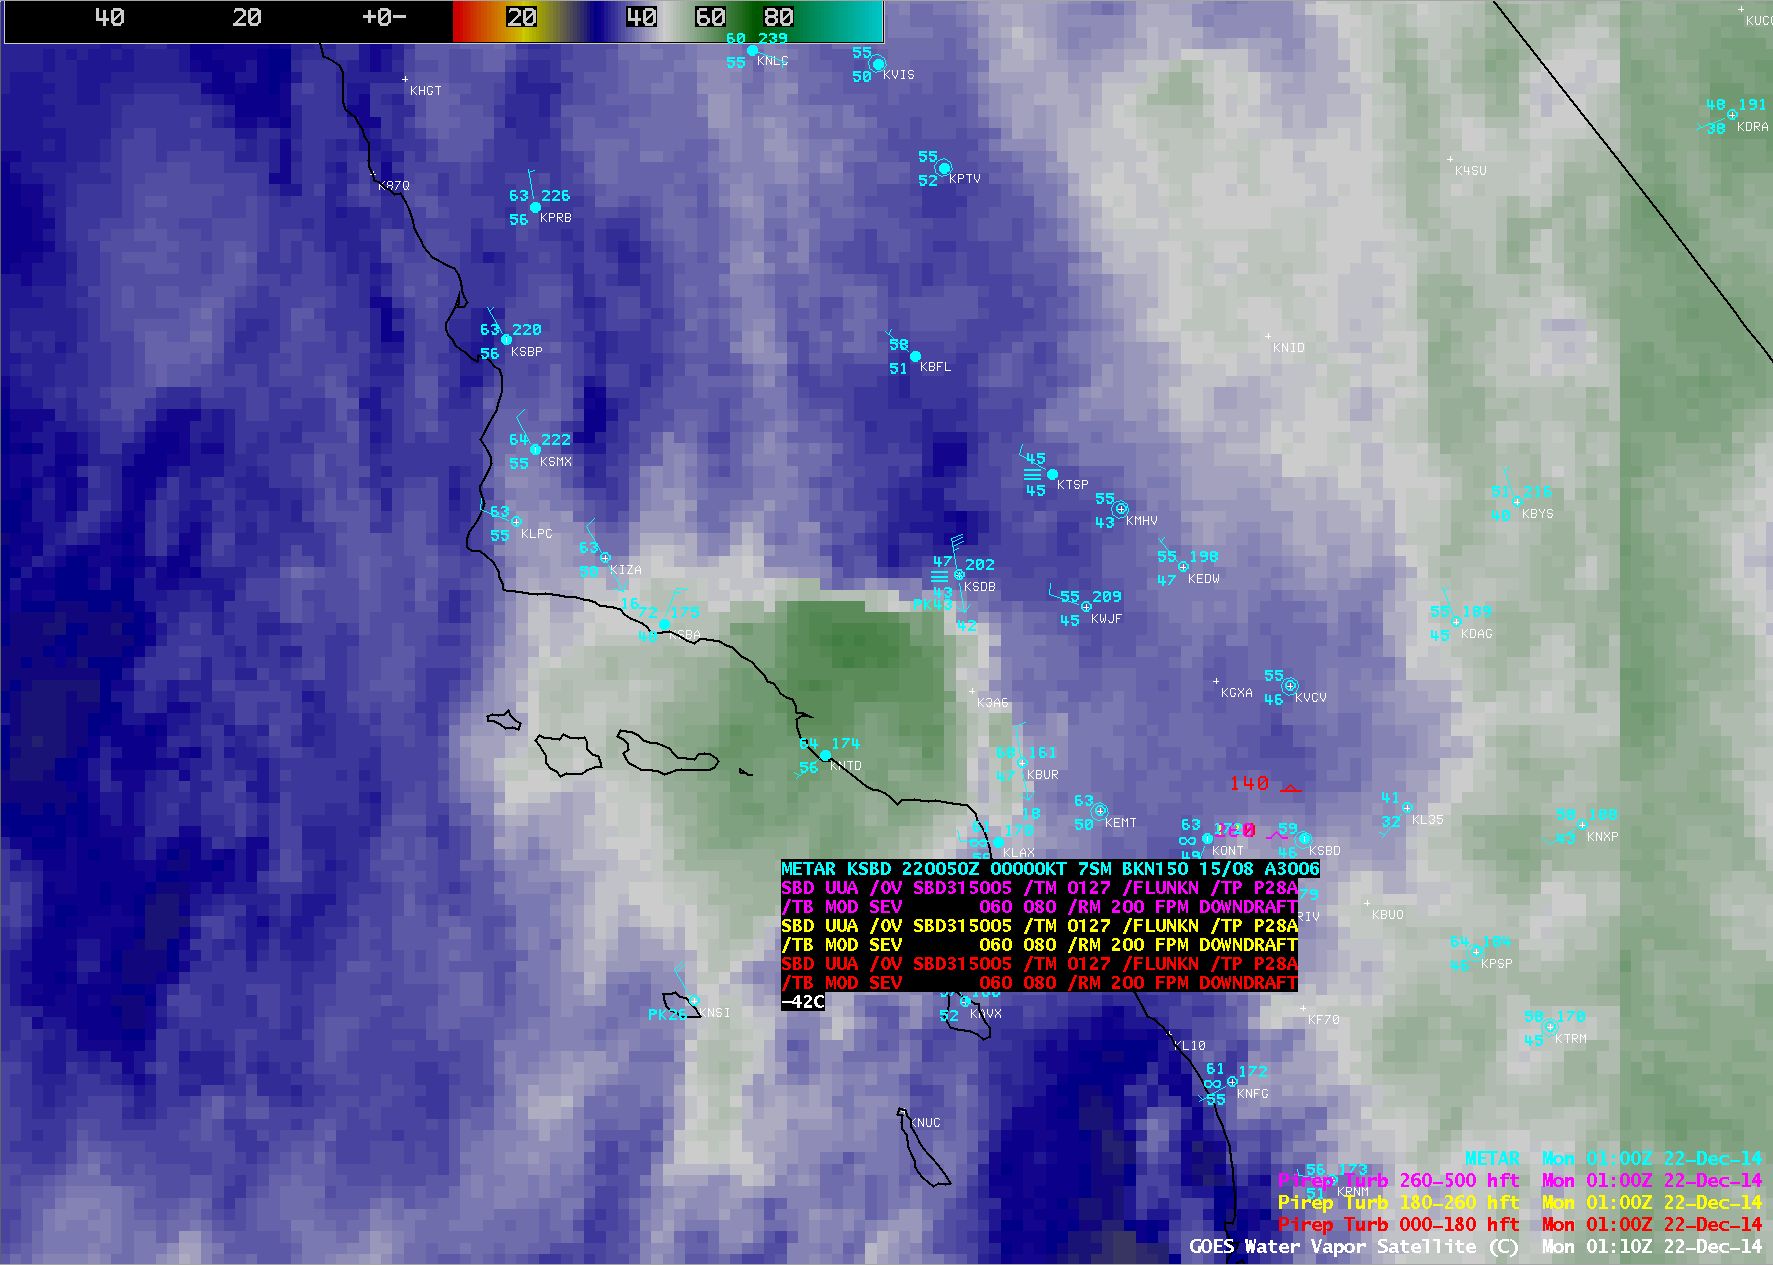
AWIPS images of 4-km resolution resolution GOES-15 (GOES-West) 6.5 µm water vapor channel data (above; click image to play animation) showed the development of a patch of mountain wave or “lee wave” clouds immediately downwind of the higher elevations of the western Transverse Ranges in southern California on 21 December 2014. These clouds developed in response to strong northerly winds interacting with the west-to-east oriented topography (12 UTC NAM 700 hPa wind and height). As seen on the plotted surface reports, at Sandberg (station identifier KSDB) the highest wind gust was 52 knots or 59 mph at 17:42 UTC — and later in the day there also a peak wind gust of 87 mph at Whitaker Peak and 86 mph at Montcito Hills. In addition, there were isolated pilot reports of moderate turbulence in the vicinity of the mountain wave cloud at 20:21 UTC and 23:06 UTC; farther to the east there was a pilot report of moderate to severe turbulence at 01:27 UTC.
A comparison of 1-km resolution MODIS 6.7 µm and 4-km resolution GOES-15 6.5 µm water vapor channel images around 21:00 UTC (below) demonstrated the advantage of higher spatial resolution (and the minimal parallax offset) of the polar-orbiter MODIS imagery for more accurate location of the mountain wave cloud.
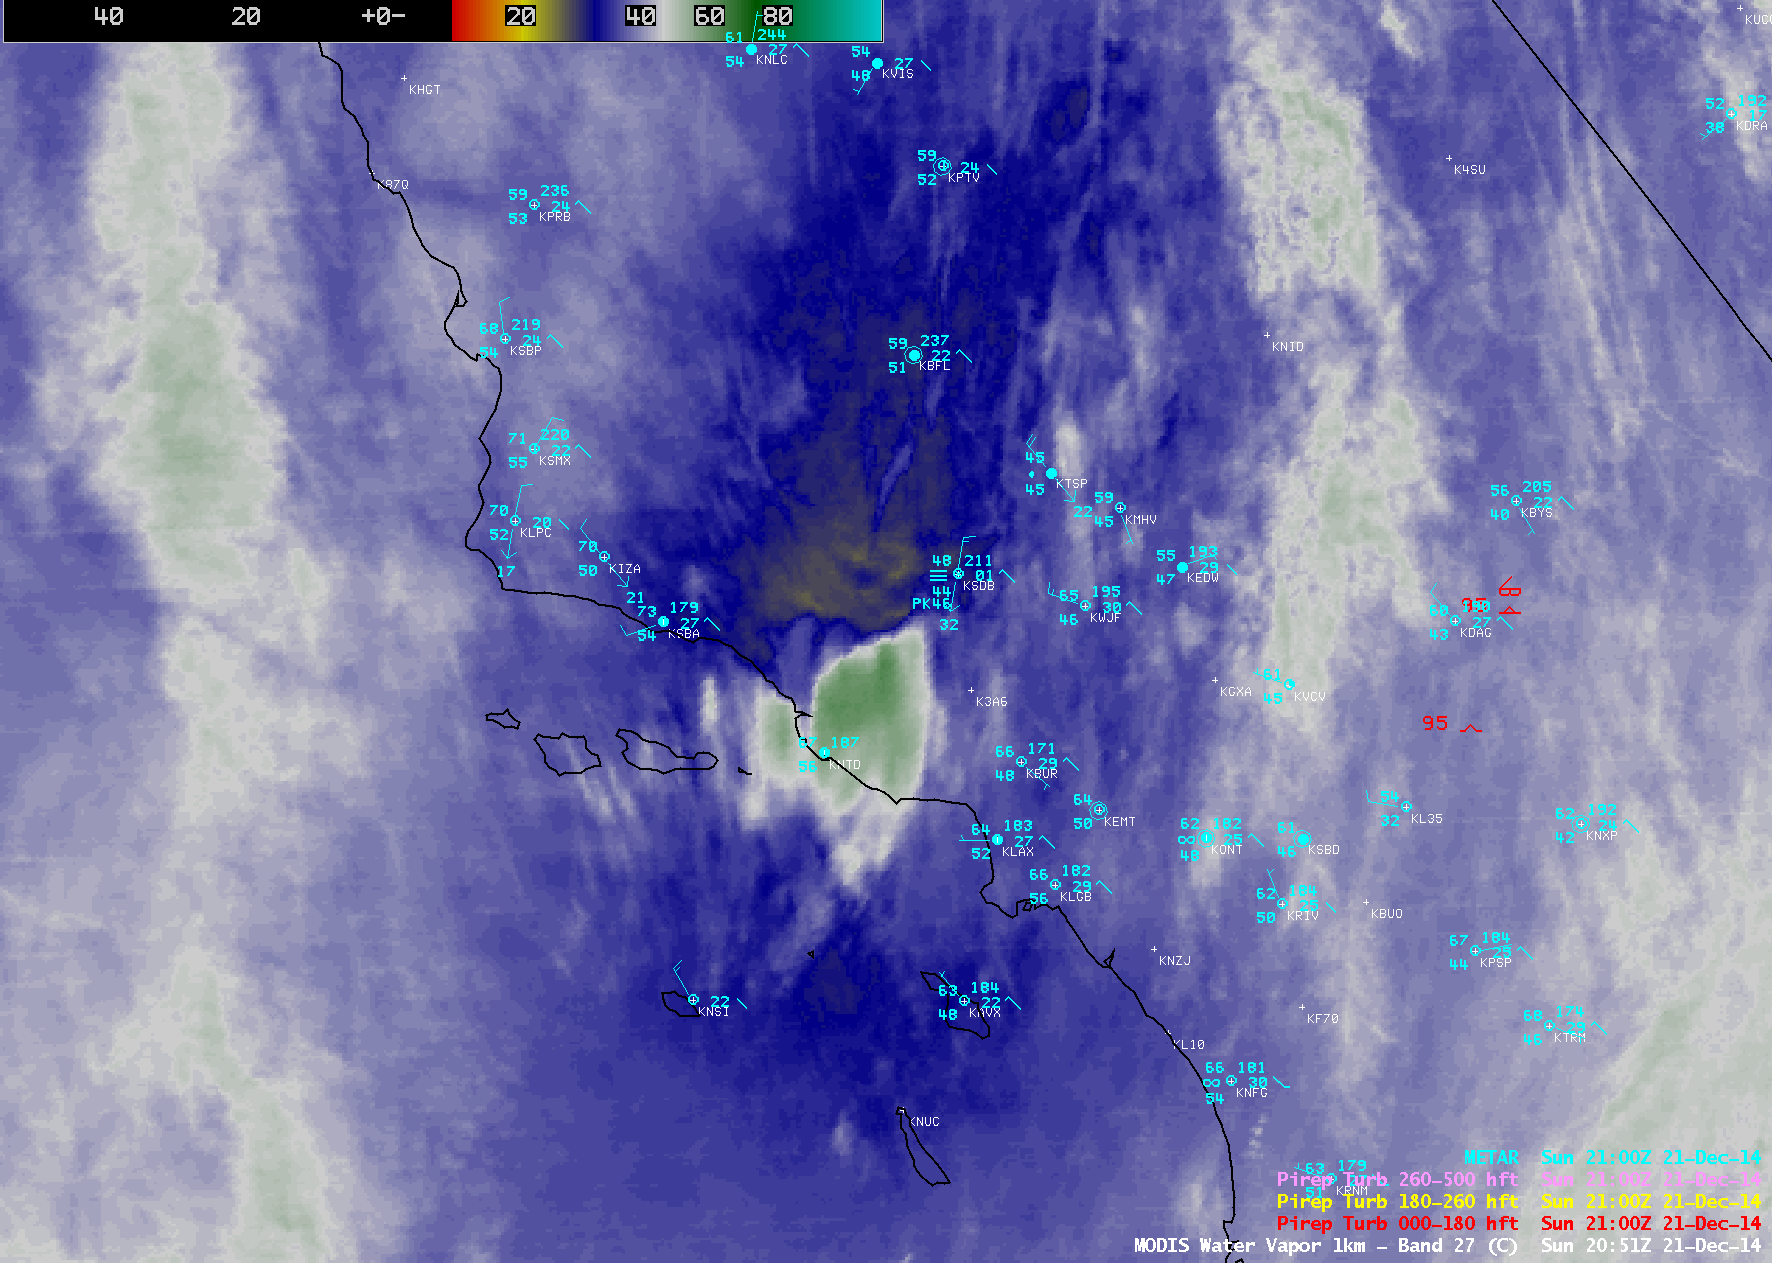
MODIS 6.7 µm and GOES-15 6.5 µm water vapor channel images
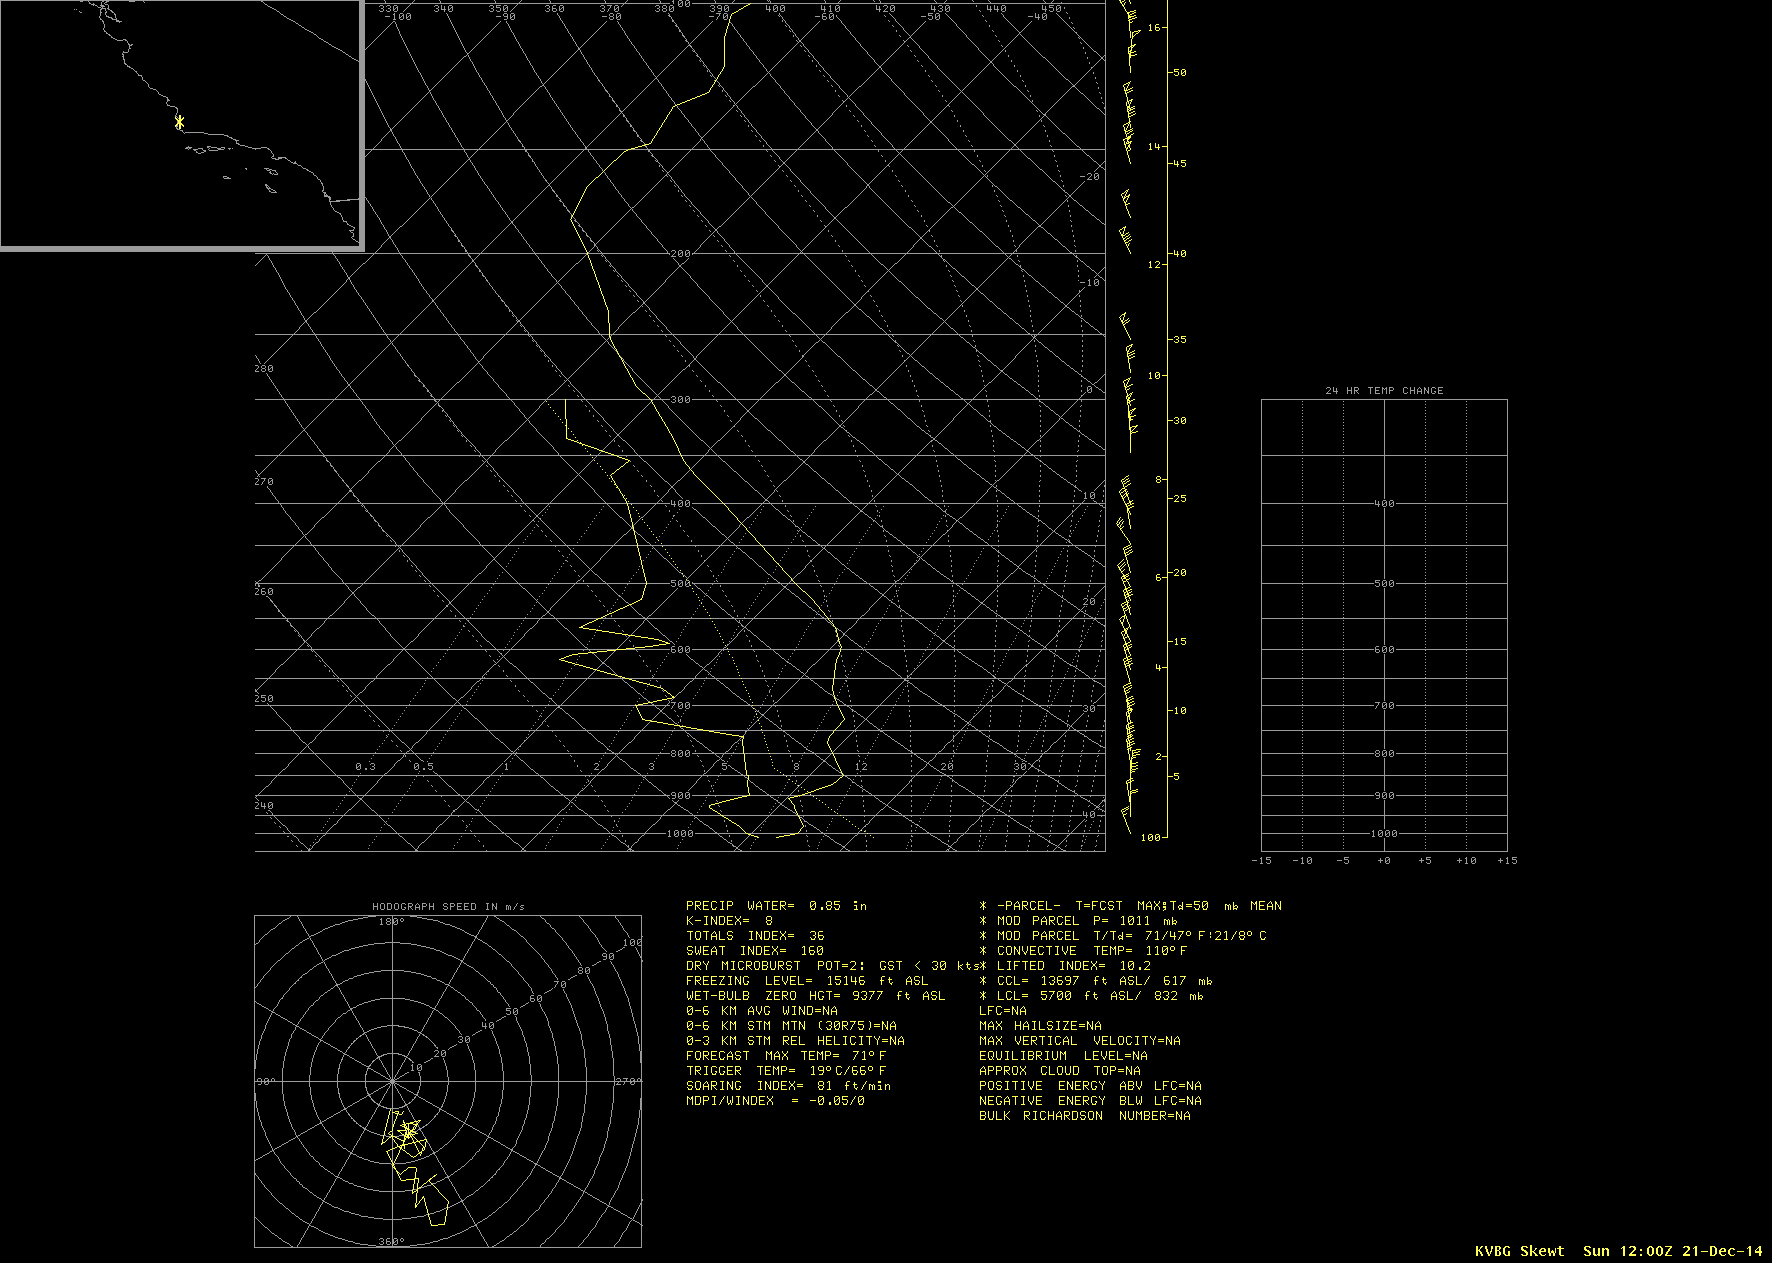
At 20:42 UTC (below), the coldest 1-km resolution POES AVHRR Cloud Top Temperature value associated with the mountain wave cloud feature was -69º C (darker red color enhancement), with the highest Cloud Top Height value being 14 km or 45,900 ft (cyan color enhancement)., which is actually colder and higher than the tropopause on the 12 UTC rawinsonde report at Vandenberg AFB. The highest elevation in the western portion of the Transverse Ranges where the mountain wave cloud formed is Mount Pinos at 8847 feet or 2697 meters, so it appears that a vertically-propagating wave developed which helped the cloud reach such a high altitude.
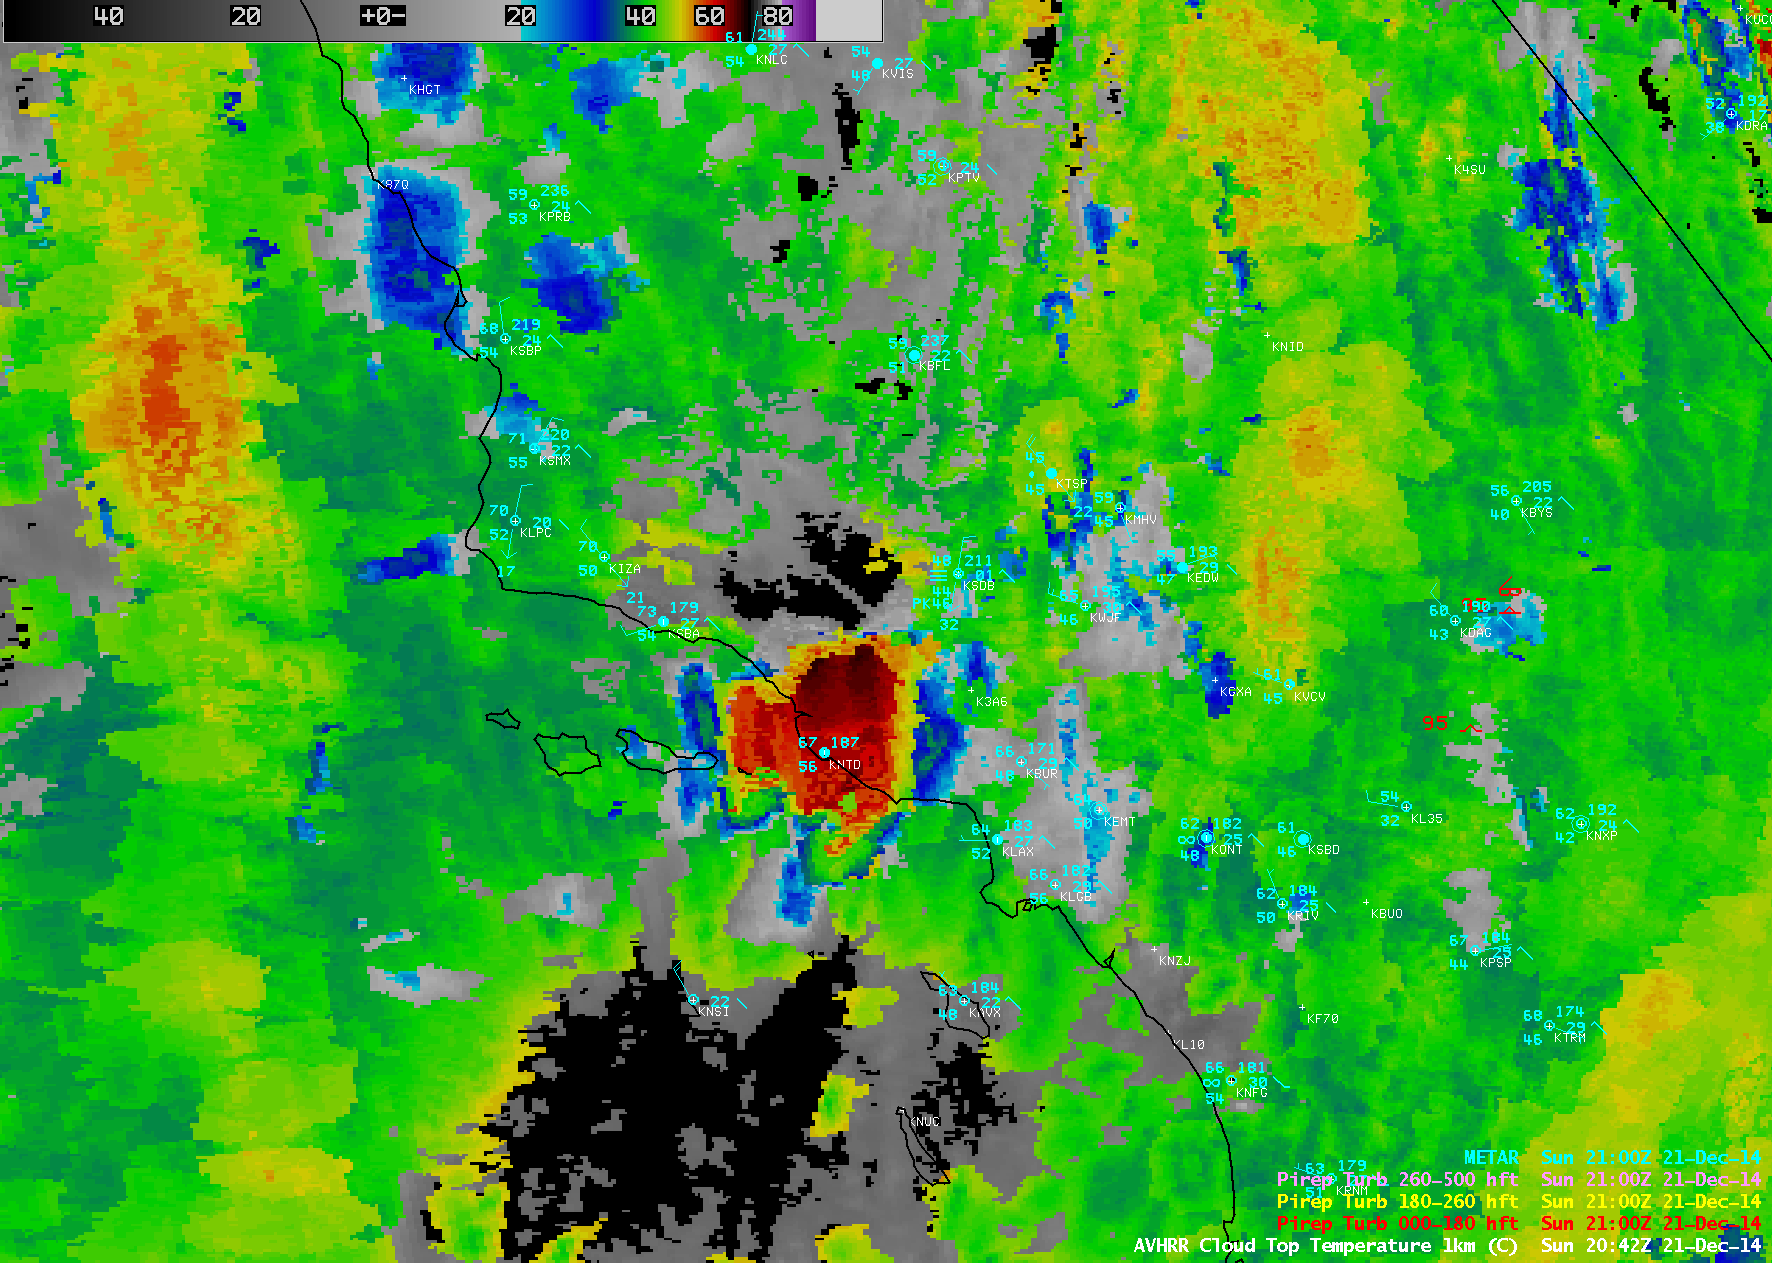
POES AVHRR Cloud Top Temperature and Cloud Top Height products
At 21;20 UTC, a comparison of 375-meter resolution (projected onto a 1-km resolution AWIPS grid) Suomi NPP VIIRS 0.64 µm visible channel, 3.74 µm shortwave IR channel, and 11.45 µm IR channel images (below) showed that while the coldest cloud-top 11.45 µm IR brightness temperatures were around -60º C, the 3.74 µm shortwave IR temperatures were in the +5 to +10º C range — this indicates that the mountain wave cloud was composed of very small ice particles, which were efficient reflectors of solar radiation contributing to much the warmer shortwave IR brightness temperatures.
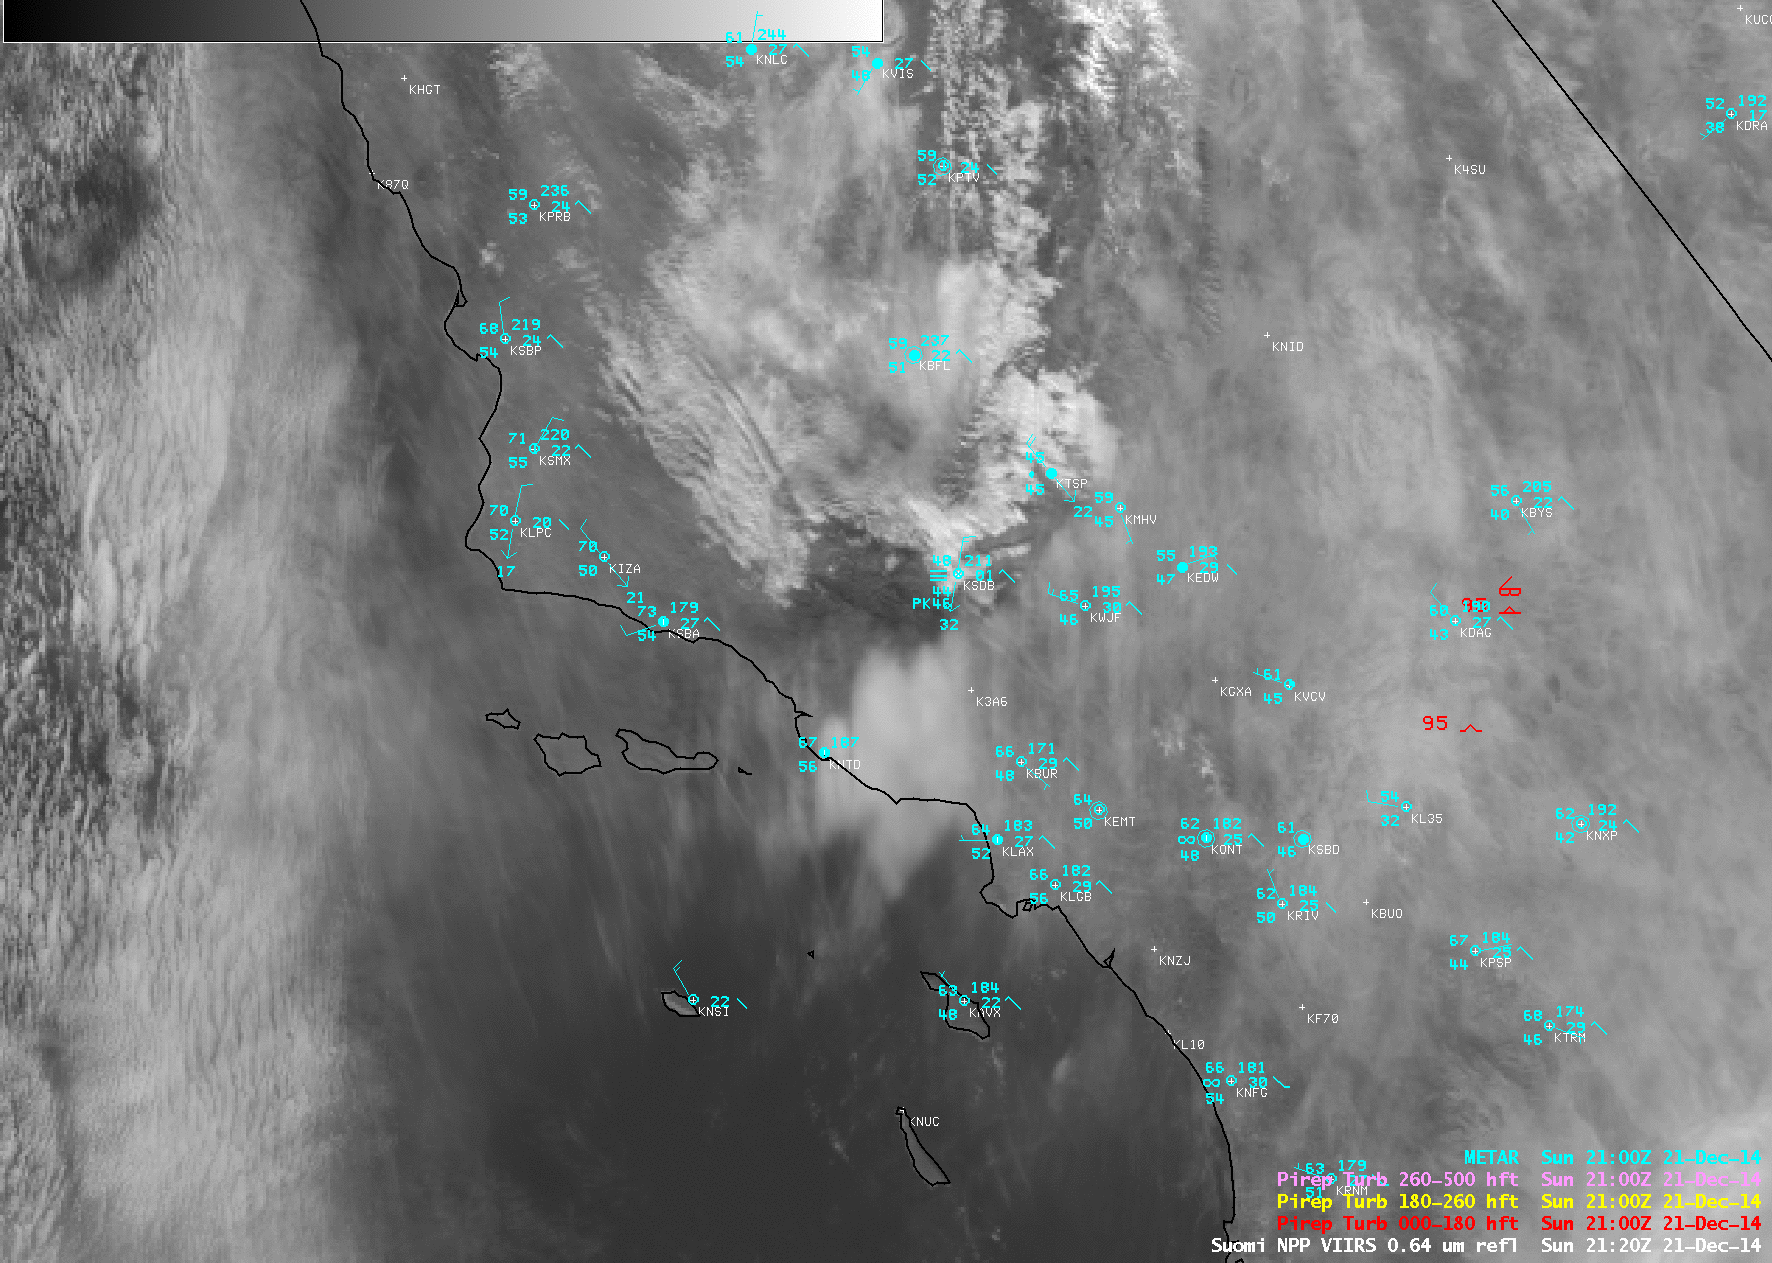
Suomi NPP VIIRS 0.64 µm visible, 3.74 µm shortwave IR, and 11 45 µm IR channel images
A 375-meter resolution Suomi NPP VIIRS true-color Red/Green/Blue (RGB) image from the SSEC RealEarth web map server is shown below.
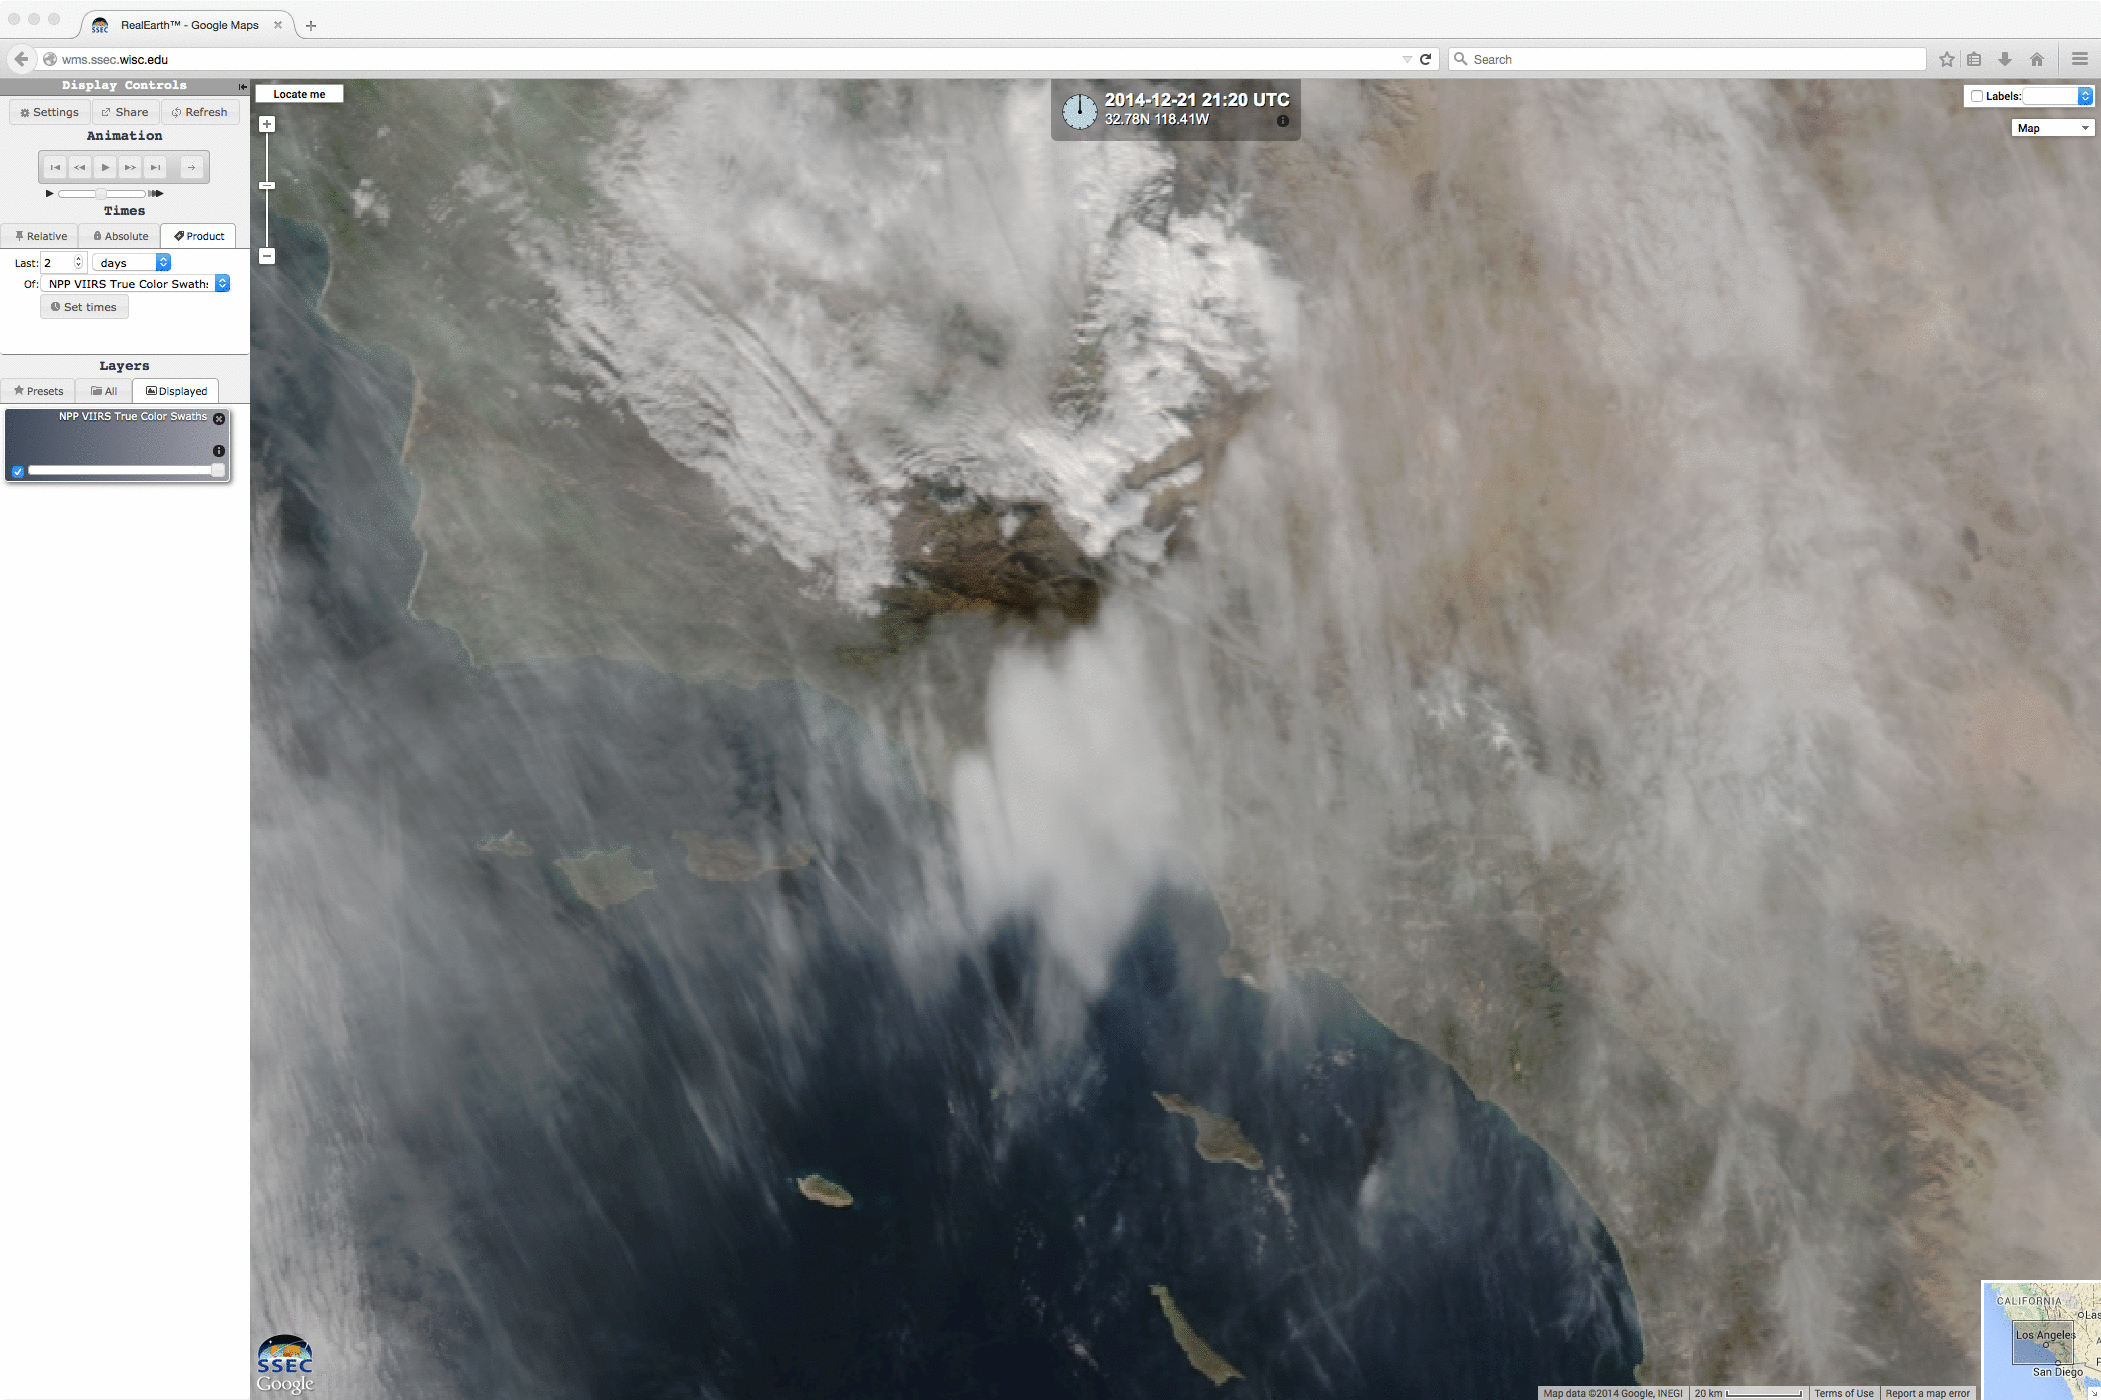
Suomi NPP VIIRS true-color image
View only this post Read Less


