This website works best with a newer web browser such as Chrome, Firefox, Safari or Microsoft Edge. Internet Explorer is not supported by this website.

First snowfall of the season in northeastern Alaska

AWIPS images of Suomi NPP VIIRS 11.45 µm IR channel data (above; click image to play animation) showed the development of a cyclonic swirl of middle to high altitude clouds associated with an upper-level shortwave moving northward over northeastern Alaska on 20 August 2013. This disturbance helped to reinforce the... Read More

Suomi NPP VIIRS 11.45 µm IR channel images (click image to play animation)

Suomi NPP VIIRS 11.45 µm IR channel images (click image to play animation)

AWIPS images of Suomi NPP VIIRS 11.45 µm IR channel data (above; click image to play animation) showed the development of a cyclonic swirl of middle to high altitude clouds associated with an upper-level shortwave moving northward over northeastern Alaska on 20 August 2013. This disturbance helped to reinforce the northerly to northeasterly flow of unseasonably cold air across the Beaufort Sea and North Slope regions of Alaska, producing upslope winds along the Brooks Range — this scenario led to the first major snowfall of the season in northern Alaska, with eastern portions of the Brooks Range and North Slope regions receiving several inches of accumulation.

The first glimpse of snow cover appeared on a 
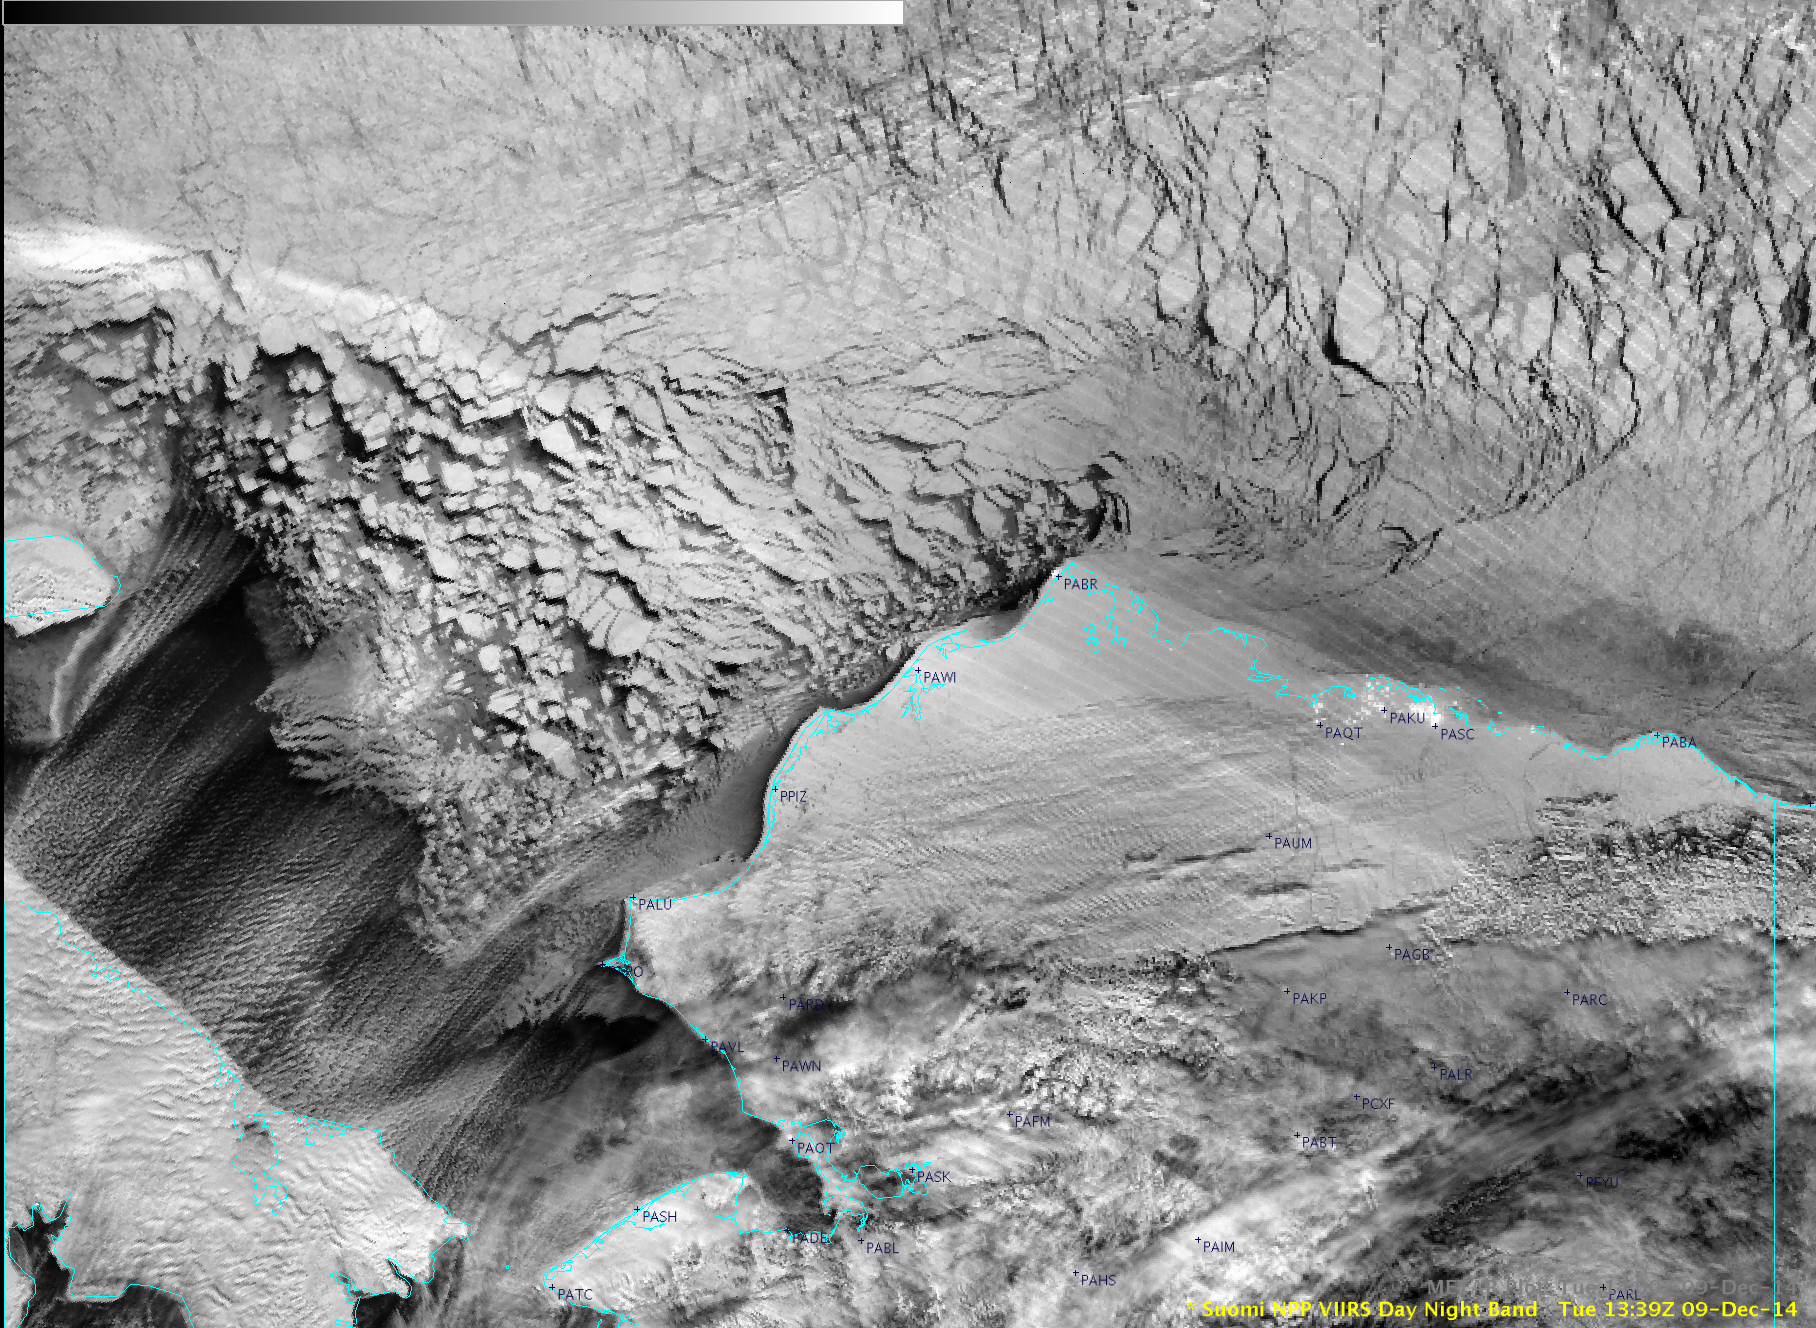
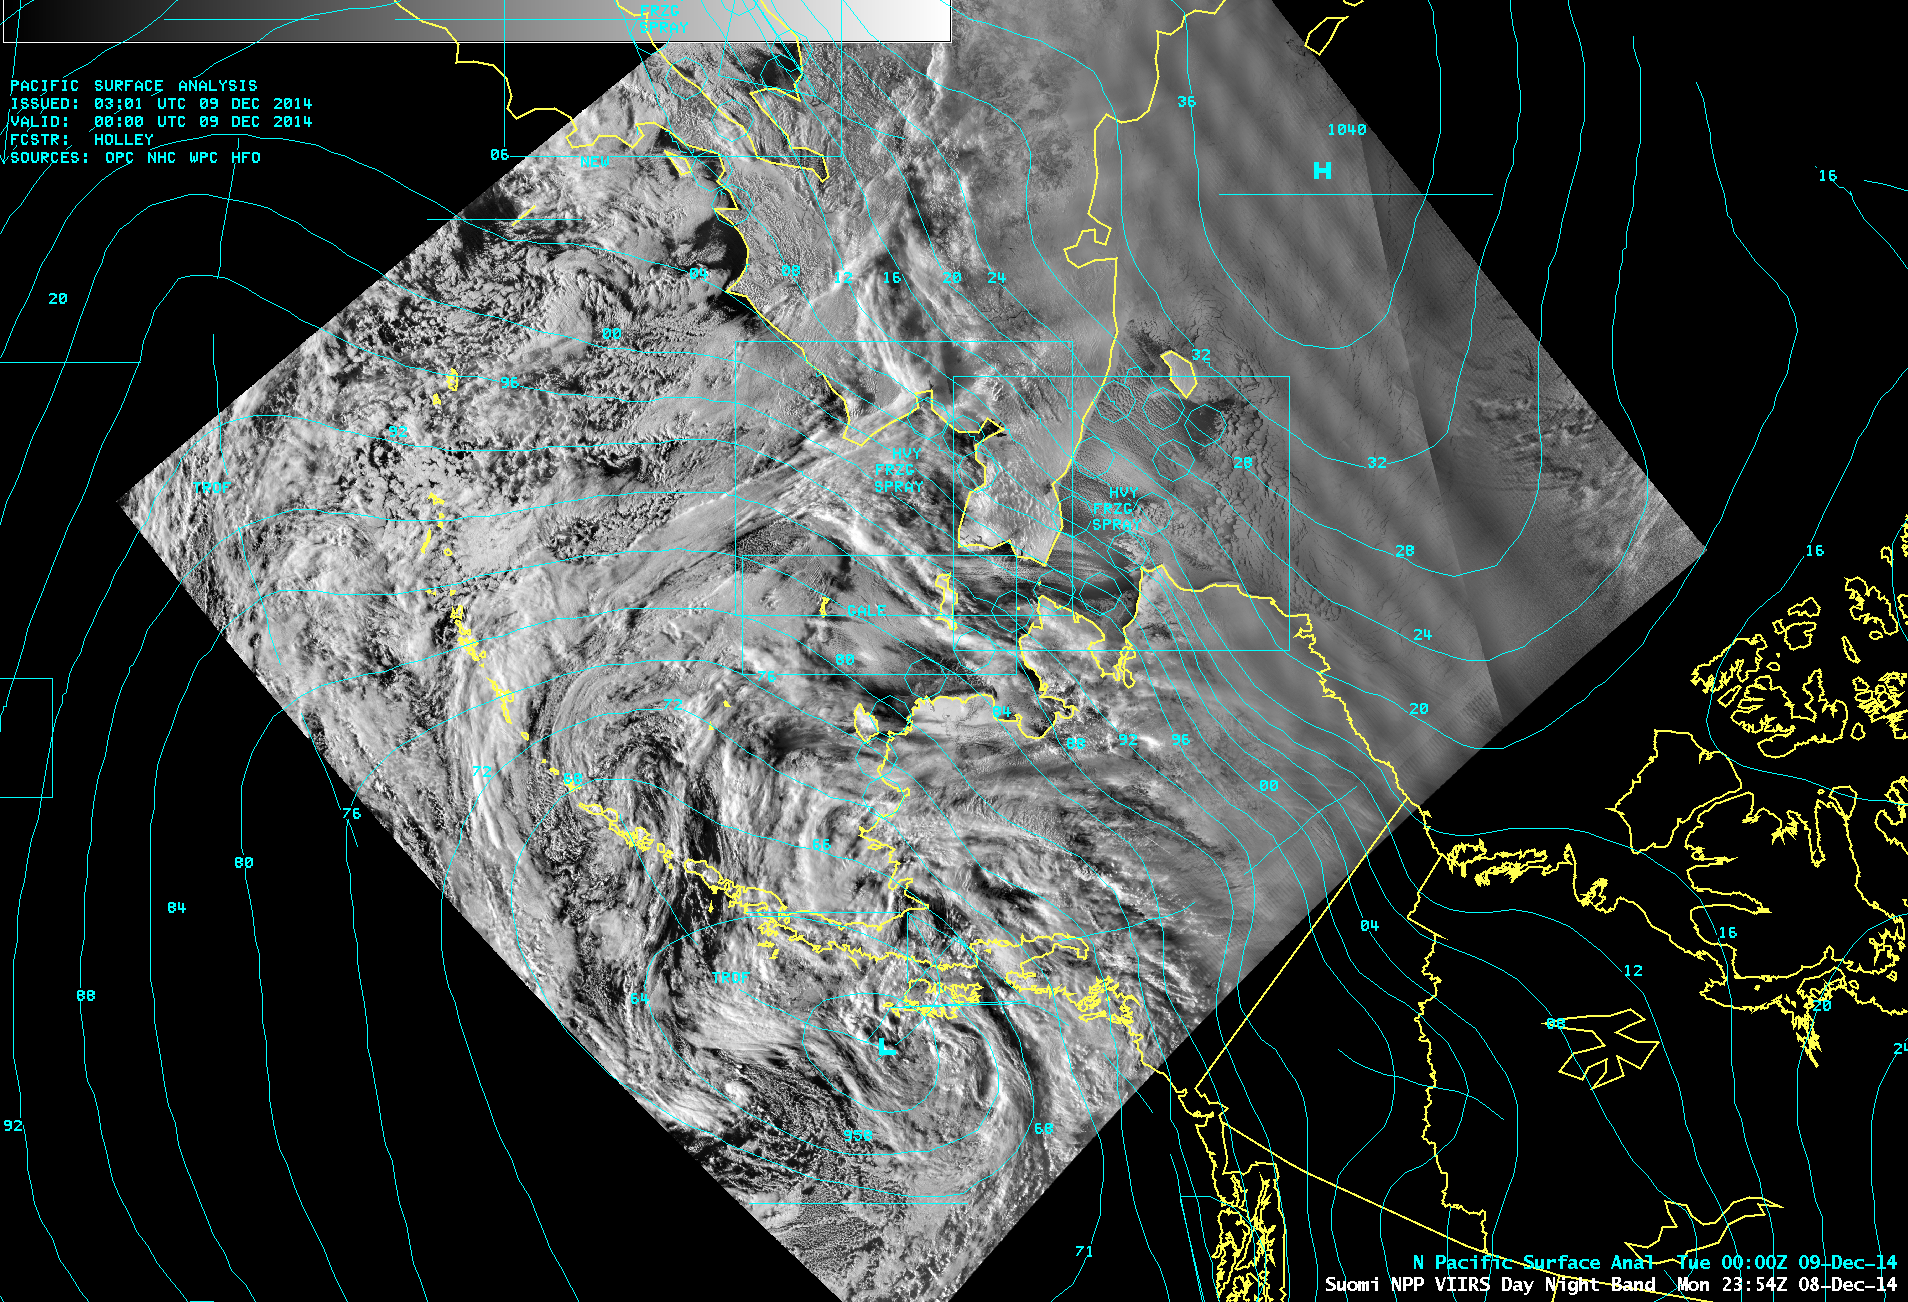
Suomi NPP VIIRS 0.7 µm Day/Night Band image at 11:57 UTC or 3:57 AM local time on 21 August (below), as clouds began to clear in the vicinity of Anaktuvuk Pass (PAKP) to Arctic Village (PARC) and points northward. The long and narrow bright streak seen over land in the western portion of the Day/Night Band image is the glow of the aurora borealis (note the lack of a signal there on the corresponding 11.45 µm IR channel image) — in contrast, the bright features seen over water in the eastern/northeastern portion of the Day/Night Band image were clouds becoming illuminated by the rising sun.

Suomi NPP VIIRS 0.7 µm Day/Night Band and 11.45 µm IR channel images

Suomi NPP VIIRS 0.7 µm Day/Night Band and 11.45 µm IR channel images

A mid-day comparison of Suomi NPP VIIRS 0.64 µm visible channel and false-color Red/Green/Blue (RGB) images at 20:14 UTC or 12:14 PM local time (below) revealed the areal extent of the fresh snow on the ground — new snow appeared as darker shades of red across the eastern Brooks Range and North Slope regions (in contrast to supercooled water droplet clouds, which appeared as varying shades of white). Snow depth reports ranged from 2-6 inches at 12 UTC. Note that clouds whose tops were composed of ice crystals also appeared as varying shades of red on the RGB image.

Suomi NPP VIIRS 0.64 µm visible channel and false-color Red/Green/Blue (RGB) images

Suomi NPP VIIRS 0.64 µm visible channel and false-color Red/Green/Blue (RGB) images

A comparison of two consecutive VIIRS false-color RGB images at 20:14 and 21:53 UTC (below) indicated that the outer edges of the snow cover were slowly melting, as surface air temperatures were able to recover into the 30s and 40s F over that region. With the combination of fresh snow cover, clearing skies, and light winds the morning low on 21 August was 23º F at Anaktuvuk Pass (PAKP); their high temperature on 20 August during the period of accumulating snow was just 36º F.

Suomi NPP VIIRS false-color Red/Green/Blue (RGB) images at 20:14 and 21:53 UTC

Suomi NPP VIIRS false-color Red/Green/Blue (RGB) images at 20:14 and 21:53 UTC


View only this post Read Less

Mesoscale Convective Vortex over Nevada

 AWIPS images of 4-km resolution GOES-13 10.7 µm IR channel data (above; click image to play animation) showed areas of nocturnal thunderstorms over southeastern California, western Arizona, and southern Nevada on 19 August 2013. These storms were initially producing numerous cloud-to-ground lightning strikes... Read More


GOES-13 10.7 µm IR channel images (click image to play animation)

GOES-13 10.7 µm IR channel images (click image to play animation)

AWIPS images of 4-km resolution GOES-13 10.7 µm IR channel data (above; click image to play animation) showed areas of nocturnal thunderstorms over southeastern California, western Arizona, and southern Nevada on 19 August 2013. These storms were initially producing numerous cloud-to-ground lightning strikes and exhibiting cloud-top IR brightness temperatures as cold as -66 C, but they began to dissipate toward sunrise as they continued to move northward.

A comparison of 375-meter resolution (projected onto a 1-km AWIPS grid) Suomi NPP VIIRS 0.7 µm Day/Night Band and 11.45 µm IR channel images at 09:17 UTC (below) provided a good example of the “visible image at night” capability of the Day/Night Band.

Suomi NPP VIIRS 0.7 µm Day/Night Band and 11.45 µm IR channel images

Suomi NPP VIIRS 0.7 µm Day/Night Band and 11.45 µm IR channel images

The GOES-14 satellite had been placed into Super Rapid Scan Operations for GOES-R (SRSO-R) mode, and was providing images at 1-minute intervals on this day. Once the cirrus canopy from the dissipating thunderstorms eroded, the GOES-14 0.63 µm visible channel images (below; click image to play animation; also available as a QuickTime movie) revealed the presence of a small yet well-defined Mesoscale Convective Vortex (MCV) which continued to propagate northward across far eastern Nevada. Toward the end of the animation (20:57 UTC), the MCV appeared to be playing a role in the initiation of new convection along its northern (leading) edge.

GOES-14 0.63 µm visible channel images (click image to play animation)

GOES-14 0.63 µm visible channel images (click image to play animation)

A comparison of Suomi NPP VIIRS 0.64 µm visible channel and 11.45 µm IR channel images at 20:43 UTC (below) showed that there were a couple of negative polarity cloud-to-ground lightning strikes (yellow) being produced by the convection that developed along the leading edge of the MCV.

Suomi NPP VIIRS 0.64 µm visible channel and 11.45 µm IR channel images

Suomi NPP VIIRS 0.64 µm visible channel and 11.45 µm IR channel images


Blended Total Precipitable Water product

Blended Total Precipitable Water product

The Blended Total Precipitable Water (TPW) product (above, shown at 3-hour intervals) indicated that a plume of TPW values in the 30-38 mm or 1.2-1.5 inch range (varying shades of yellow) were in place over the region where the thunderstorms had developed and moved northward. These monsoonal TPW values were 175-200% of normal for this area and this time of year (below).

Blended Total Precipitable Water Percent of Normal product

Blended Total Precipitable Water Percent of Normal product


GOES IR image with GFS 850-500 hPa shear

GOES IR image with GFS 850-500 hPa shear

In addition, the 850-500 hPa wind shear values across the region at 12 UTC (above) and 18 UTC (below) were relatively low, creating a favorable environment for the MCV to persist for several hours.

GOES IR image with 850-500 hPa shear

GOES IR image with 850-500 hPa shear

View only this post Read Less

GOES-12 is retired from service

The GOES-12 Sounder has sent its last data, ending more than 12 years of service. The GOES-12 Sounder was turned off at 1100 UTC on 13 August. GOES-12 was launched on July 23, 2001, and GOES-12 transmitted data from 16 August 2001 – 7 January 2002, and then more or... Read More

The GOES-12 Sounder has sent its last data, ending more than 12 years of service. The GOES-12 Sounder was turned off at 1100 UTC on 13 August. GOES-12 was launched on July 23, 2001, and GOES-12 transmitted data from 16 August 2001 – 7 January 2002, and then more or less continuously from January 16, 2003 onward, a lengthy record of data collection for a geostationary satellite. GOES-12 initially served as GOES-East, replacing GOES-8. After April, 2010, when GOES-13 began service as GOES-East, GOES-12 was moved to 60 West longitude and supplied data over South America. The end of its fuel supply after a dozen years in orbit requires a decommissioning that is scheduled for Friday 16 August.

GOES-12 Sounder Imagery over South America, 0931 UTC on 13 August 2013

GOES-12 Sounder Imagery over South America, 0931 UTC on 13 August 2013

The last GOES Sounder images were centered over Bolivia, as shown above. Sounder data can be used to estimate Total Precipitable Water, or Cloud Top Pressure. A toggle between these last two products from GOES-12 is shown below.

GOES-12 DPI Total Precipitable Water and Cloud-Top Pressure, nominal time of 1100 UTC 13 August 2013

GOES-12 DPI Total Precipitable Water and Cloud-Top Pressure, nominal time of 1100 UTC 13 August 2013

The GOES-12 Imager was turned off at approximately 2330 UTC on 15 August 2013; De-orbit maneuvers are scheduled at 0100 and 1300 UTC on 16 August 2013.

The loss of data flowing from GOES-12 will have an impact on the GOES-13 scanning strategy. During routine GOES-13 scanning, there are six South American images every three hours. However, during past GOES-13 Rapid Scan Operations (RSO), only one South American Image was scanned every three hours — the Southern Hemisphere Short Sector (SHSS) that was south of the Equator, west of South America. (An example is here). In the scanning strategy now, a South American Image over the southern Amazon Basin (the South American ‘A’ Sector; here is a second example) will be produced near the top of the hour, and a South American Image over the southern part of the Continent (the South American ‘B’ Sector; here is a second example) will be produced near the bottom of the hour. An RSO call late on 13 August yielded the following two images in an hour.

GOES-13 South America Sectors (A and B)

GOES-13 South America Sectors (A and B)

=================UPDATE 16 August 2013=======================

GOES-12 10.7 µm infrared channel images (click image to play animation)

GOES-12 10.7 µm infrared channel images (click image to play animation)

The Imager was shut off around 2340 UTC on August 15 2013. The loop above shows the final two days of the Full Disk imagery. The final set of Imager imagery — all five channels — is below.

GOES-12 Imager over South America, 2328 UTC on 15 August 2013

GOES-12 Imager over South America, 2328 UTC on 15 August 2013

GOES-12 produced many excellent loops. Perhaps the most famous, a visible imagery loop of Hurricane Katrina in the Gulf of Mexico, is available here (Or here as a Quicktime movie).

View only this post Read Less

GOES-14 SRSO-R images of convection in the Southeast US

A comparison of AWIPS images of 1-km resolution Suomi NPP VIIRS 0.64 µm visible channel and 11.45 µm IR channel data at 18:35 UTC on 15 August 2013 (above) showed a number of organized clusters of deep convection which where generally located along... Read More

Suomi NPP VIIRS 0.64 µm visible and 11.45 µm IR images (with surface fronts and MSAS surface wind streamlines)

Suomi NPP VIIRS 0.64 µm visible and 11.45 µm IR images (with surface fronts and MSAS surface wind streamlines)

A comparison of AWIPS images of 1-km resolution Suomi NPP VIIRS 0.64 µm visible channel and 11.45 µm IR channel data at 18:35 UTC on 15 August 2013 (above) showed a number of organized clusters of deep convection which where generally located along a quasi-stationary frontal boundary that was draped across the Southeast US. Streamlines of MSAS surface winds also indicated an area of strong convergence over southeastern Georgia, where new convection was just beginning to develop.

GOES-14 0.63 µm visible channel images (click image to play animation)

GOES-14 0.63 µm visible channel images (click image to play animation)

McIDAS images of 1-km resolution GOES-14 0.63 µm visible channel data (above; click image to play animation) showed the evolution of the developing convection across southeastern Georgia in great detail at 1-minute intervals (since the GOES-14 satellite was in SRSO-R mode). At such a fine temporal resolution, short-lived features such as convective overshooting tops could easily be identified and followed — especially as the convection appeared to intensify as it interacted with the sea breeze boundary along the Georgia and Florida coasts. The Advanced Baseline Imager (ABI) instrument on the next-generation GOES-R satellite will be able to provide images as frequently as every 30 seconds over special mesoscale sectors.

The corresponding 4-km resolution GOES-14 10.7 µm IR channel images (below; click image to play animation) also revealed the evolution of the coldest overshooting tops associated with the most vigorous thunderstorm updrafts. The coldest GOES-14 storm top IR brightness temperature was -74º C at 21:10 UTC. During the time period of the animation, there were reports of damaging winds at a few locations across far southeastern Georgia and far northeastern Florida (SPC storm reports). On the GOES-R ABI, the spatial resolution of the IR imagery will be improved to 2 km, which should make the identification of important storm-top signatures easier.

GOES-14 10.7 µm IR channel images (click image to play animation)

GOES-14 10.7 µm IR channel images (click image to play animation)

View only this post Read Less