There was an explosive eruption of the Villarrica volcano in central Chile on the morning of 03 March 2015; the Buenos Aires VAAC issued their first volcanic ash advisory based upon initial detection on 06:38 UTC GOES-13 imagery, although Read More
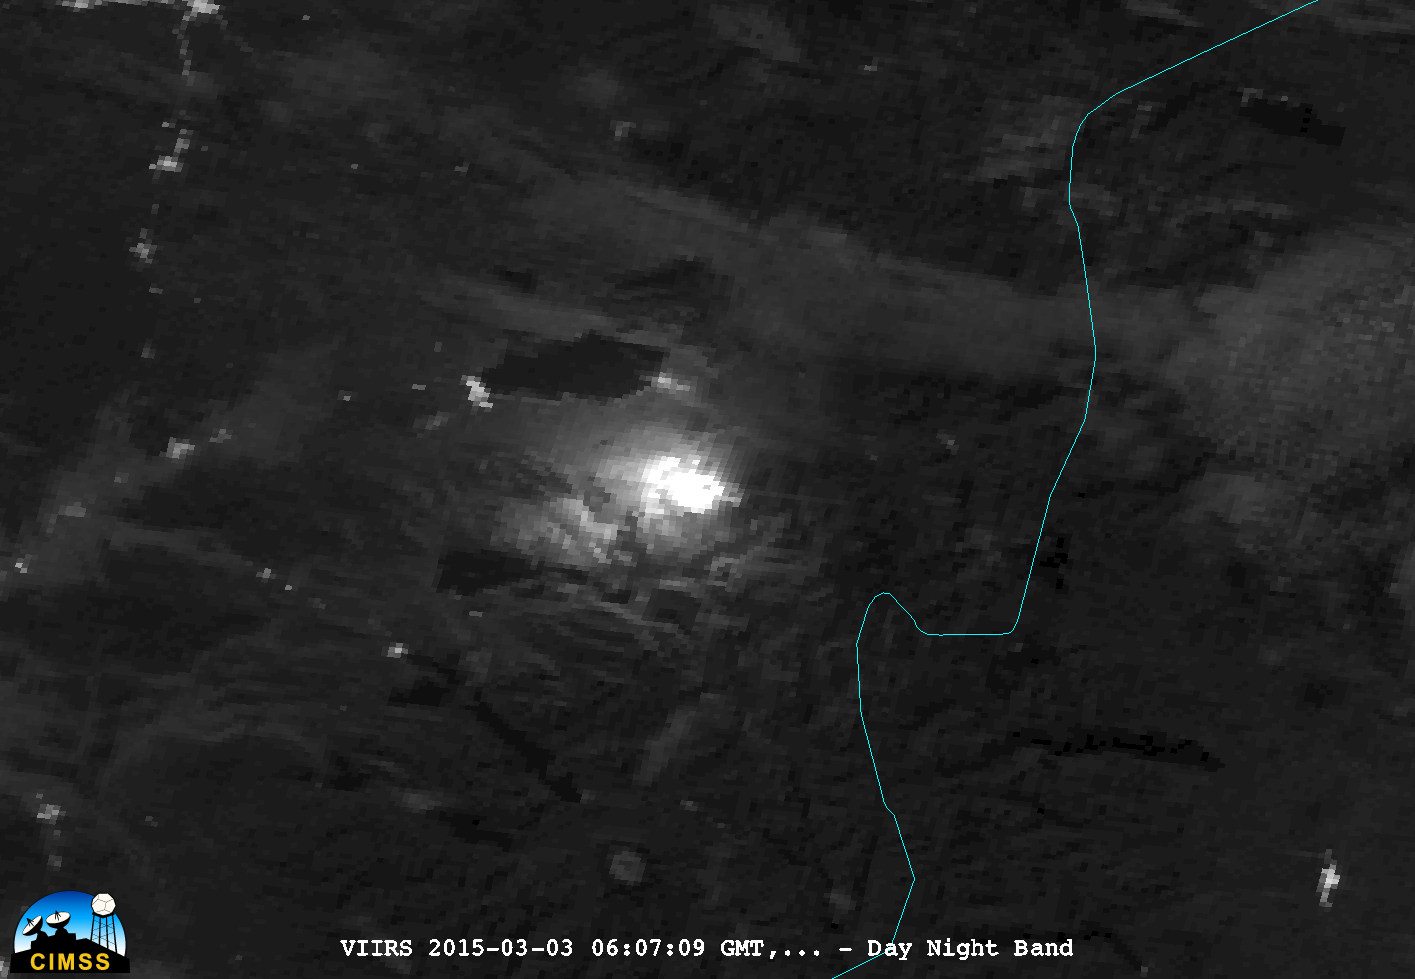
Suomi NPP VIIRS 0.7 µm Day/Night Band, 1.6 µm near-IR, 3.9 µm shortwave IR, and 11.45 µm longwave IR images
There was an explosive eruption of the Villarrica volcano in central Chile on the morning of 03 March 2015; the Buenos Aires VAAC issued their first volcanic ash advisory based upon initial detection on 06:38 UTC GOES-13 imagery, although media report and blog sources indicated that the eruption started closer to 06:00 UTC (3 am local time). A comparison of 06:07 UTC Suomi NPP VIIRS 0.7 µm Day/Night Band (DNB), 1.6 µm near-IR, 3.9 µm shortwave IR, and 11.45 µm longwave IR images (above; courtesy of William Straka, SSEC) revealed a bright glow on the DNB and near IR images, with a pronounced “hot spot” evident on the shortwave IR (yellow to orange pixels; the hottest shortwave IR brightness temperature was over 600 K!) and even the longwave IR (darker black pixels) images. The DNB image was particularly striking, with nearby clouds and surface features being illuminated by the eruption.
MODIS and GOES-13 multispectral false-color Red/Green/Blue (RGB) images from the NOAA/CIMSS Volcanic Cloud Monitoring site (below; click image to play animation) showed that there was detection of a thermal anomaly or “hot spot” (indicated by a red box) as early as 04:20 UTC (MODIS) and 05:45 UTC (GOES-13); the volcanic cloud filament — which was estimated to be at an altitude of 30,000 feet — could be seen drifting to the southeast following the eruption.
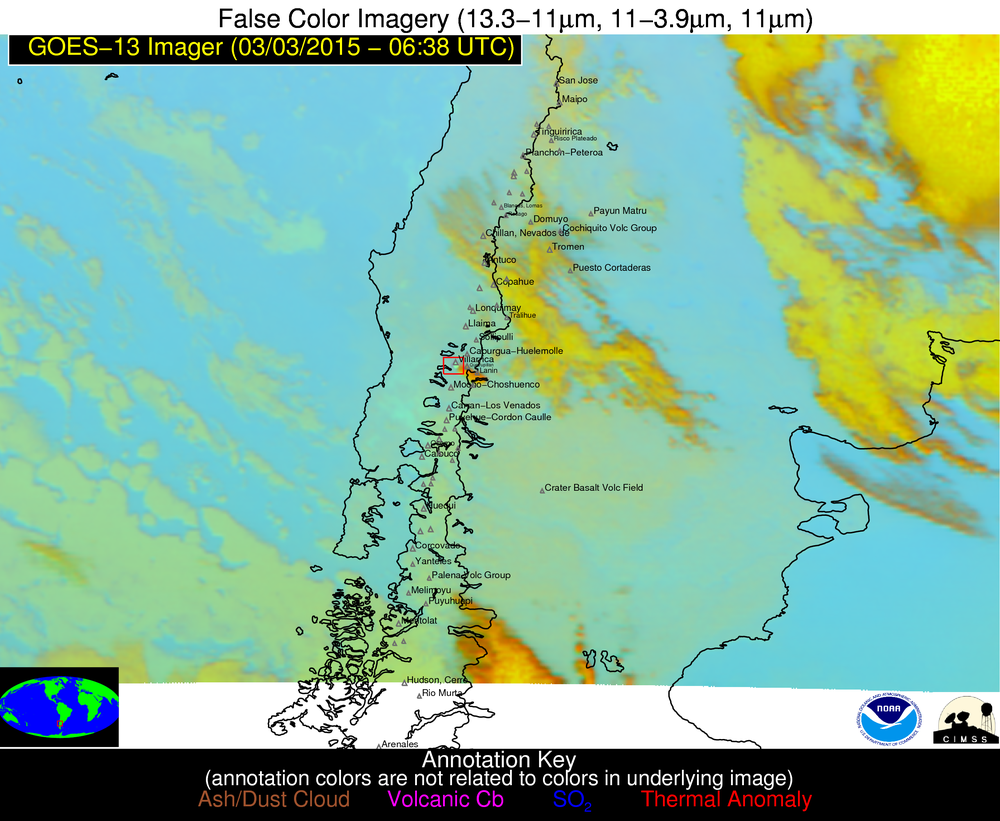
MODIS and GOES-13 false-color RGB images (click to play animation)
On GOES-13 10.7 µm IR channel images (below; click image to play animation), the volcanic cloud initially exhibited an IR brightness temperature as cold as -42ºC (green color enhancement), but the cloud filament quickly became very diffuse and difficult to identify on the IR images by 09:38 UTC.
GOES-13 10.7 µm IR images (click to play animation)
The 12 UTC rawinsonde profiles from Puerto Montt, Chile (station identifier SCTE) on 02 March and 03 March are shown below. On the 02 March profile, the -42º C temperature was at an altitude around 9400 meters or 30,800 feet; on the 03 March profile, -42º C was around 9100 meters or 29,900 feet.
Puerto Montt, Chile 12 UTC rawinsonde profiles on 02 March and 03 March
On GOES-13 3.9 µm shortwave IR images (below; click image to play animation) a “hot spot” (black to yellow to red color enhancement) was seen for several hours after the initial eruption. The highest shortwave IR brightness temperature observed by GOES-13 was 340.8 K — much lower than than the >600 K observed with the higher spatial resolution Suomi NPP VIIRS instrument.
GOES-13 3.9 µm shortwave IR channel images (click to play animation)
View only this post
Read Less

