After a day of record high temperatures in parts of Nebraska — the 91º F at North Platte set a new record high for the month of March, and was also the earliest temperature of 90º F or above on record at that site — a strong arctic cold front... Read More
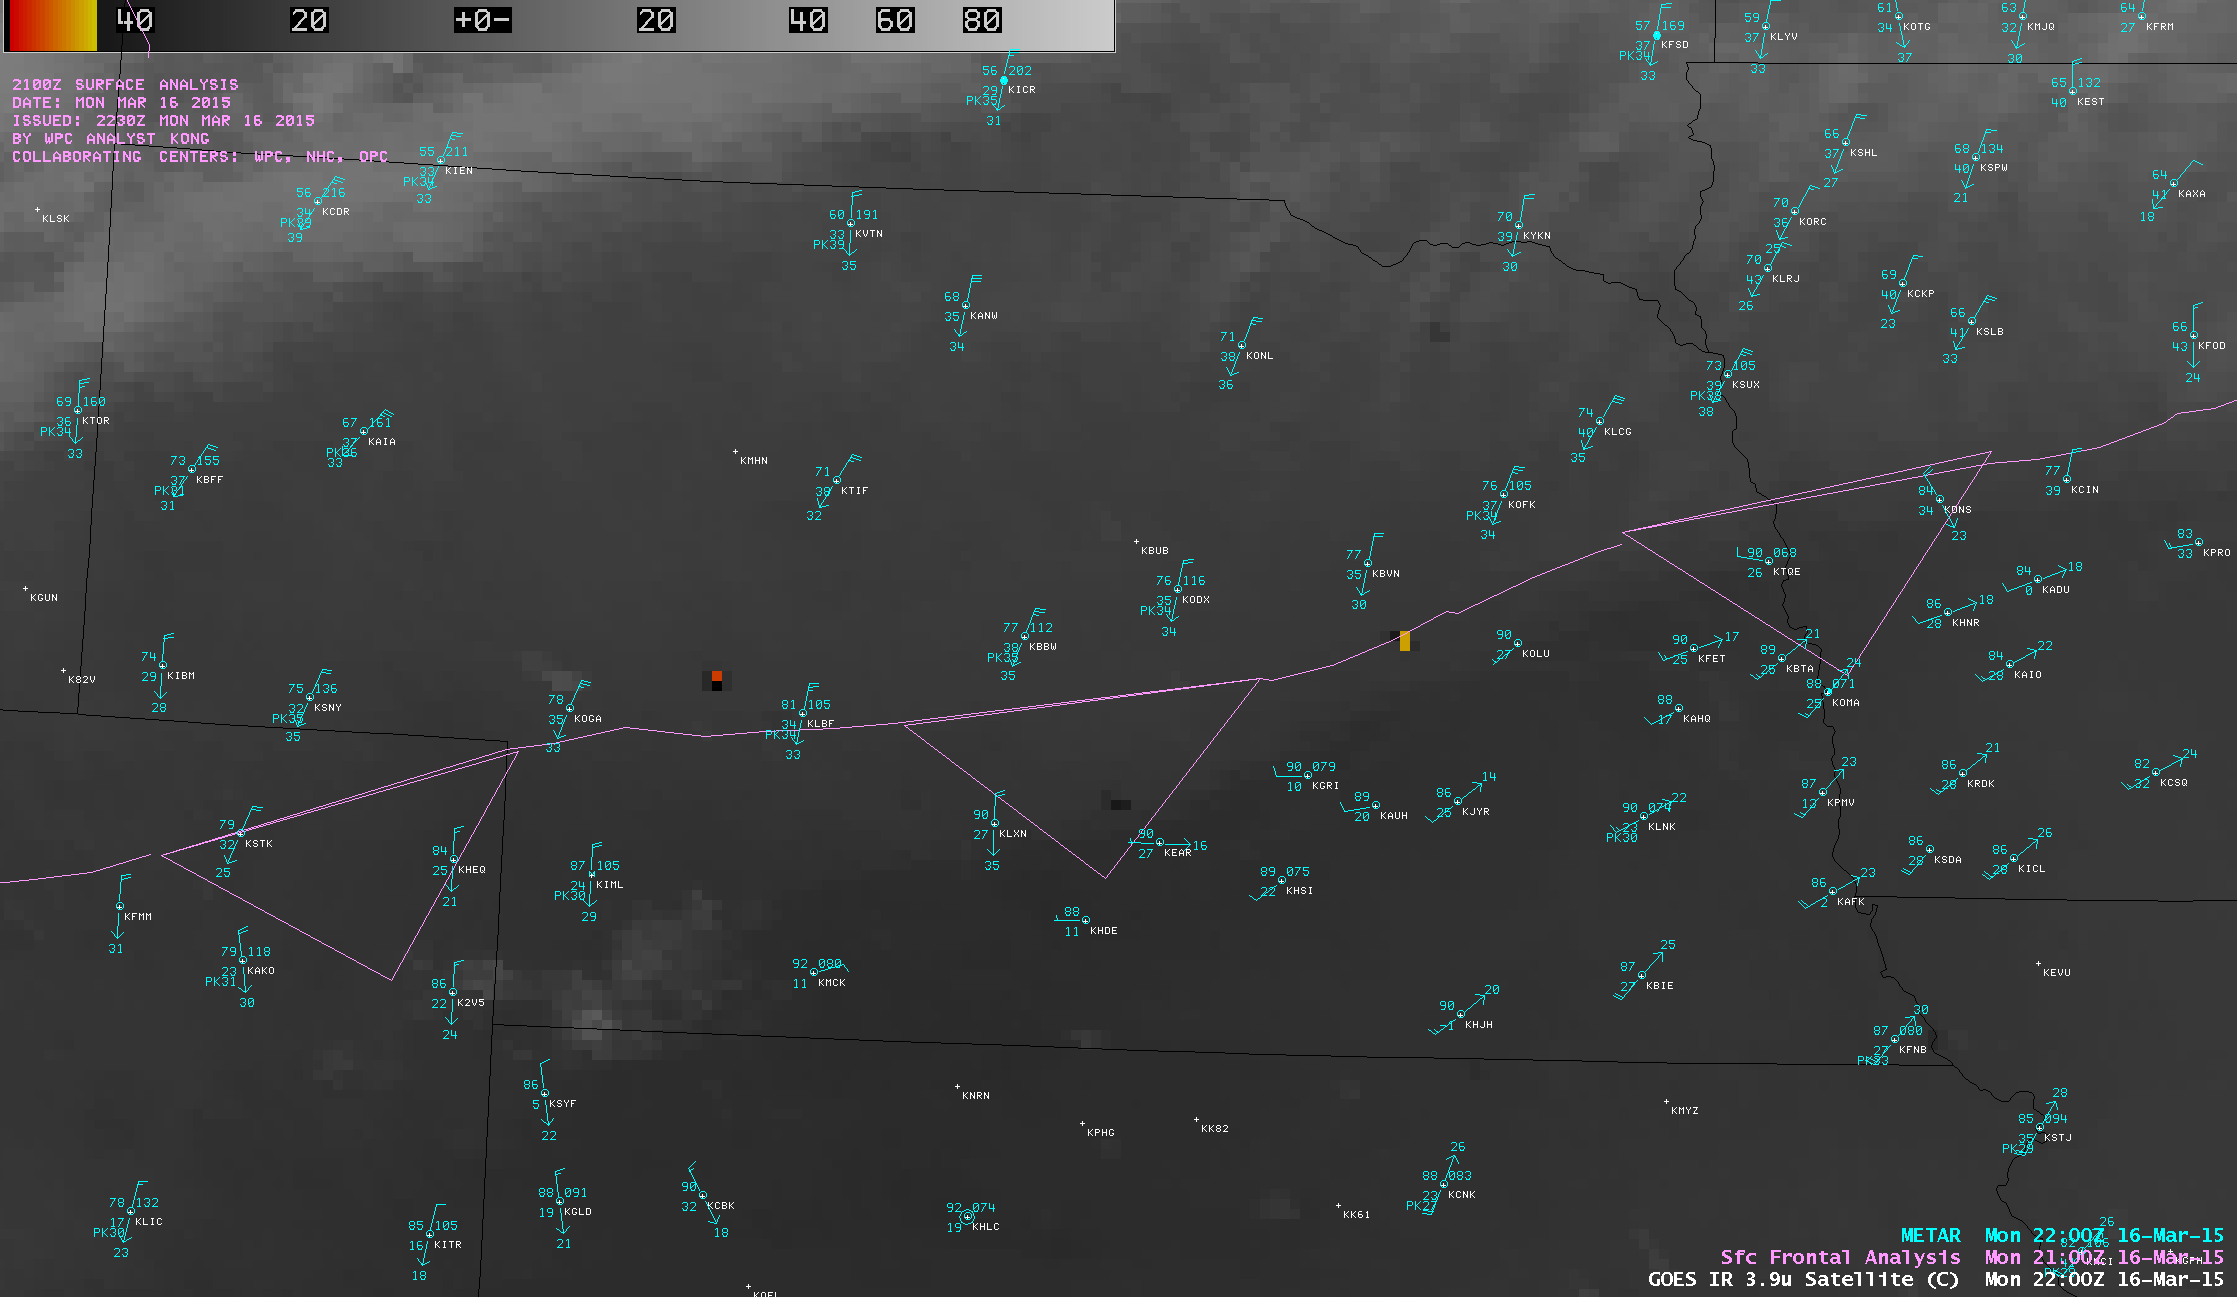
GOES-13 3.9 µm shortwave IR channel images (click to play animation)
After a day of record high temperatures in parts of Nebraska — the 91º F at North Platte set a new record high for the month of March, and was also the earliest temperature of 90º F or above on record at that site — a strong arctic cold front plunged southward across the state late in the day on 16 March 2015. With strong winds (gusting to 40-50 knots at some locations) in the wake of the frontal passage and dry vegetation fuels in place, GOES-13 3.9 µm shortwave IR images (above; click image to play animation) showed the “hot spot” signatures (black to yellow to red pixels) associated with a number of large grass fires that began to burn across the state.
The strong northwesterly winds behind the cold front also lofted dry soil into the boundary layer, creating blowing dust whose hazy signature was evident on GOES-13 0.63 visible channel images (below; click image to play animation). Visibility was reduced to 7 miles at some locations.
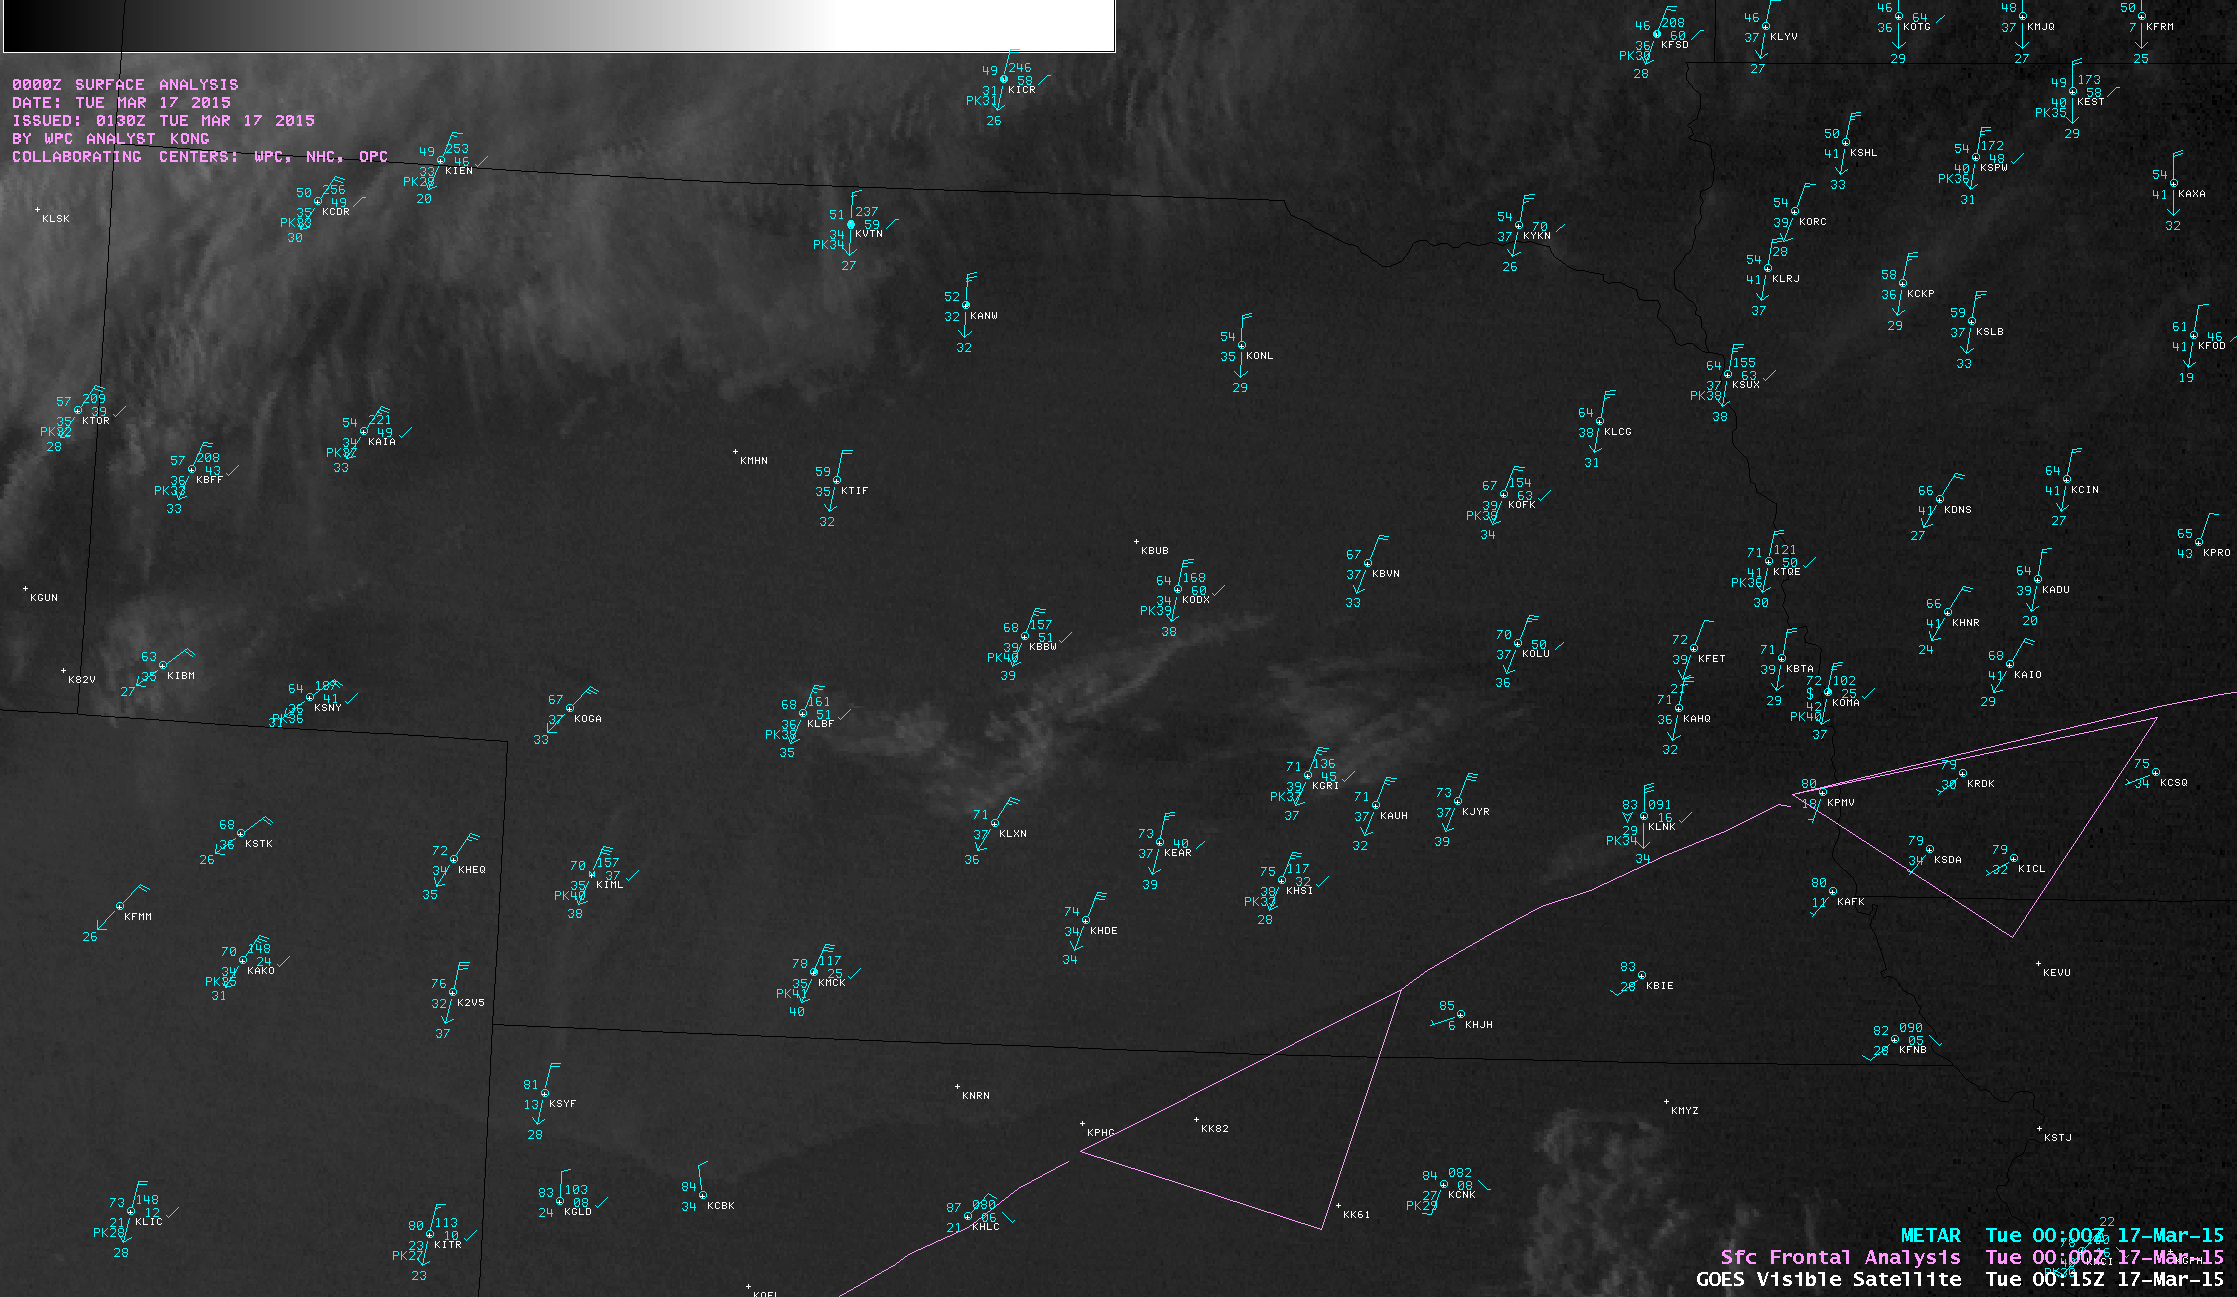
GOES-13 0.63 µm visible channel images (click to play animation)
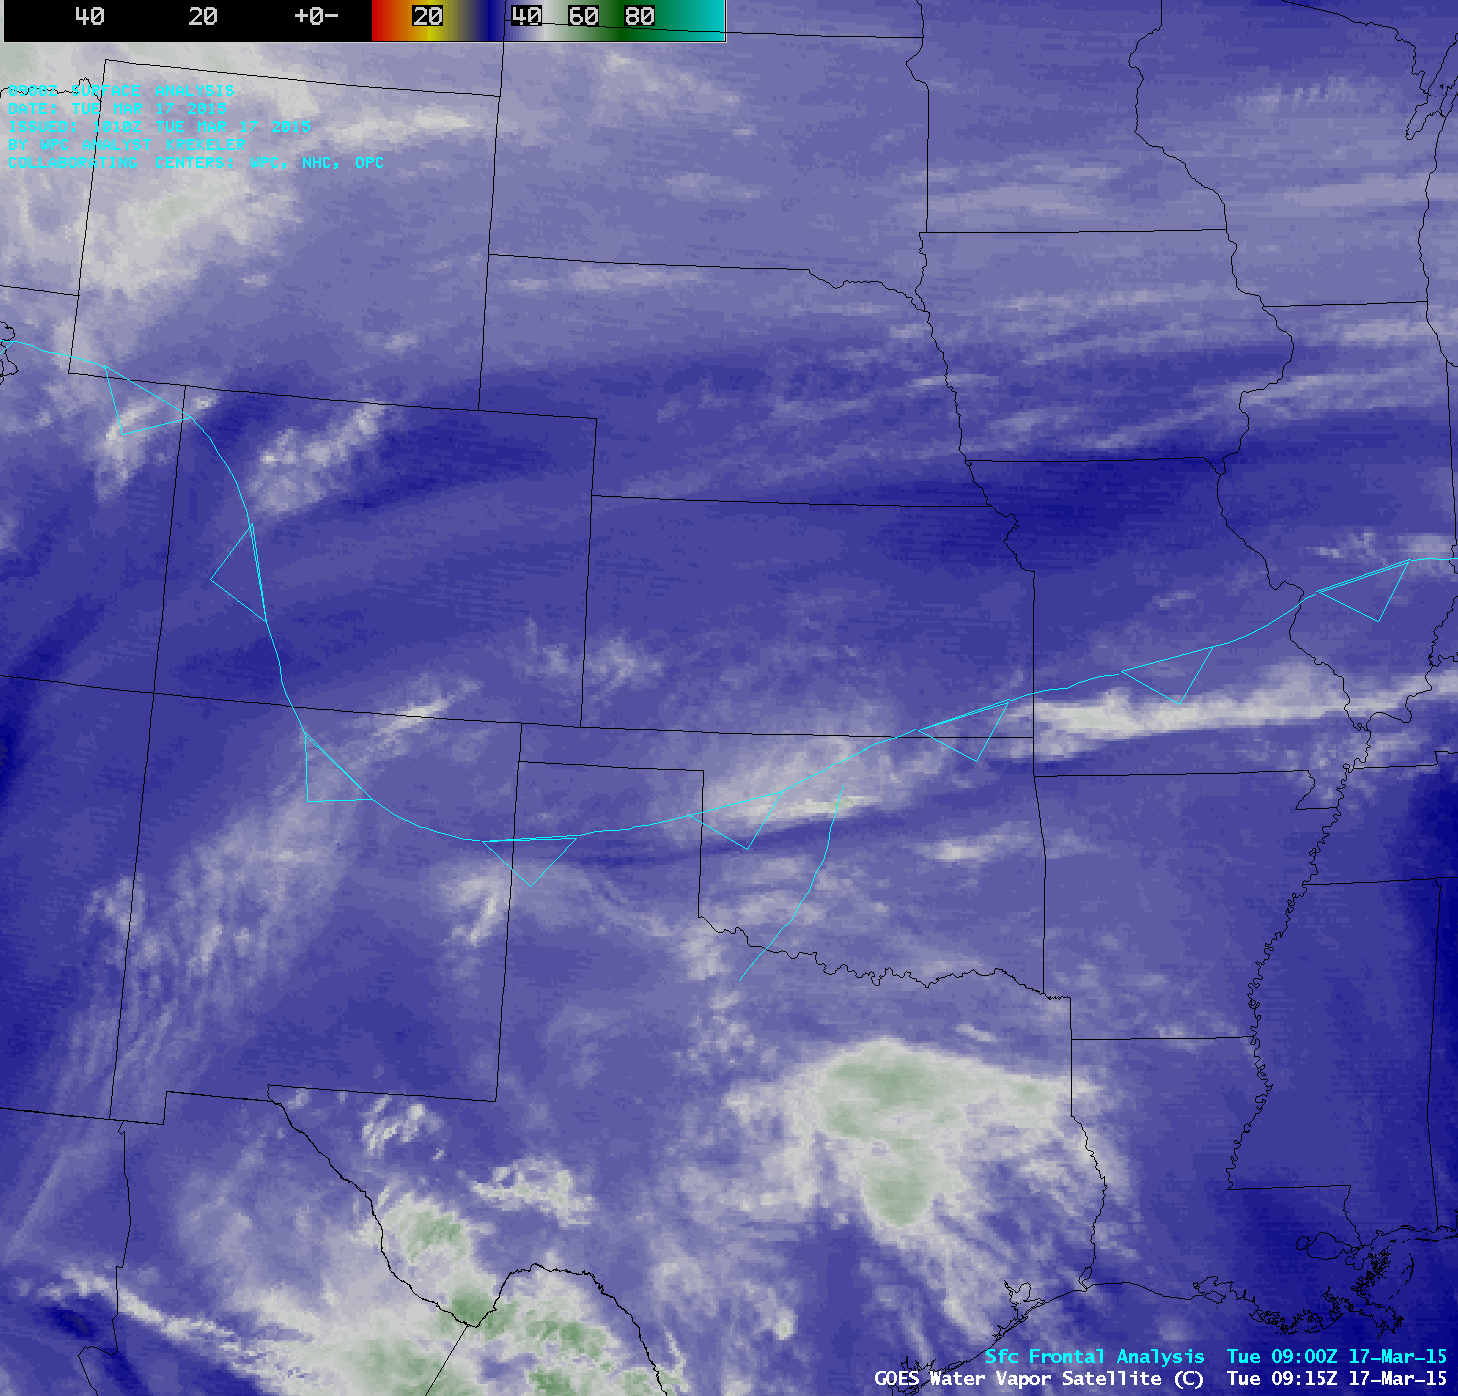
After sunset and into the pre-dawn hours on 17 March, a lee-side frontal gravity wave signature could be seen on GOES-13 6.5 µm water vapor channel images (below; click image to play animation). This warmer/drier (darker blue color enhancement) arc on the water vapor imagery followed the position of the surface cold front, which meant that the upward-propagating frontal gravity wave reached altitudes where the water vapor channel was sensing radiation.

GOES-13 6.5 µm water vapor channel images (click to play animation)
As the frontal gravity wave was approaching the Kansas/Oklahoma border region around 05 UTC, a pilot reported light to moderate turbulence at altitude of 6000 feet (below).
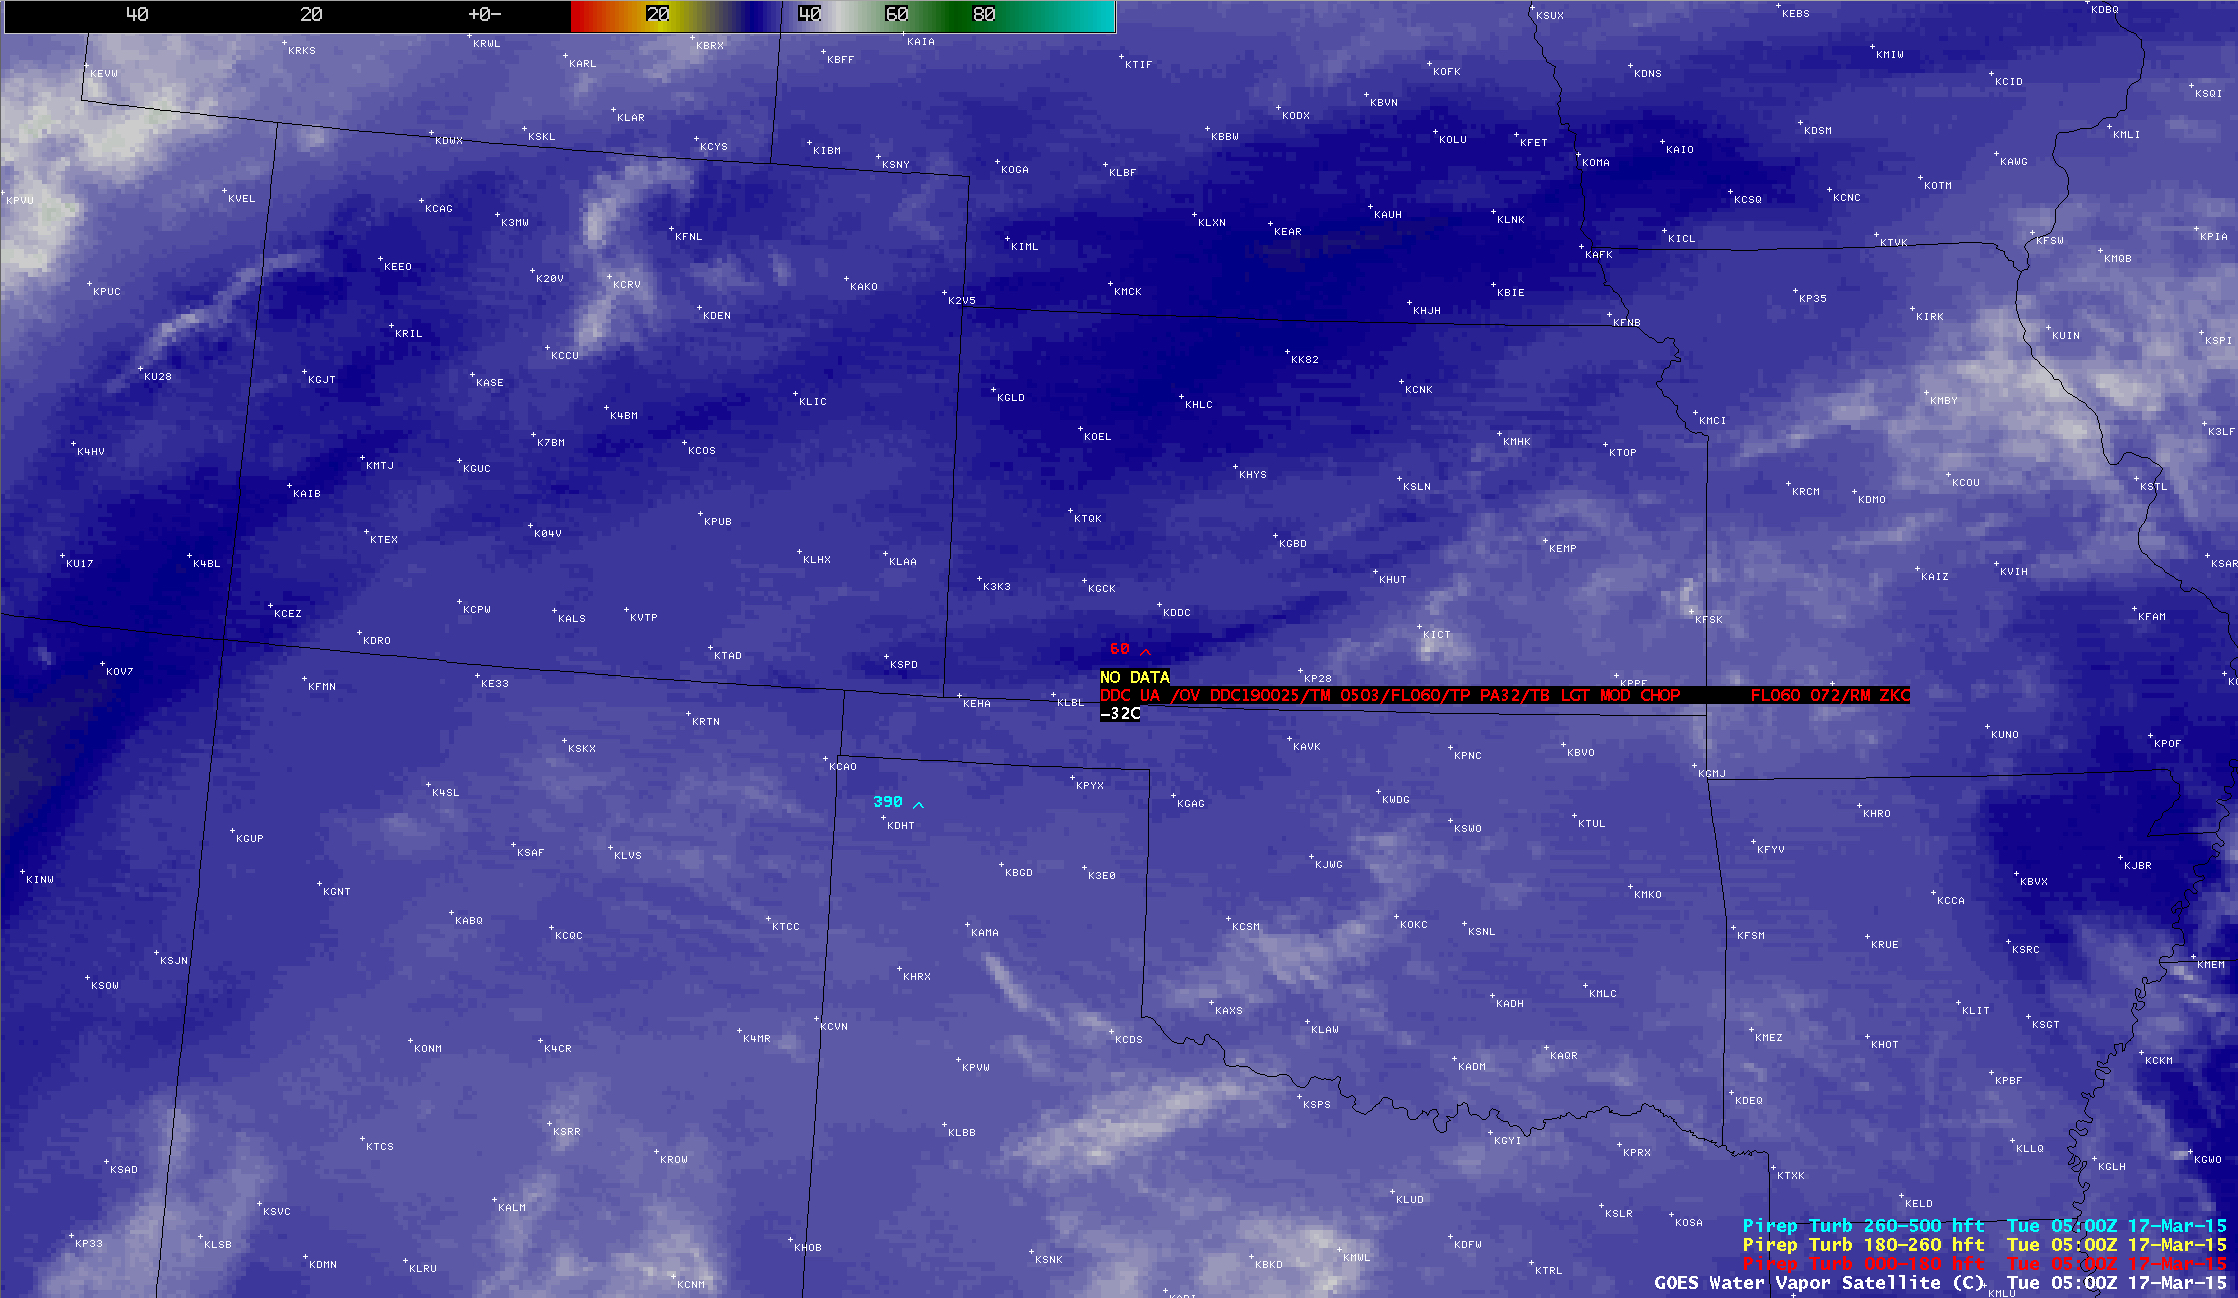
GOES-13 6.5 µm water vapor channel image with pilot report of turbulence
A 4-panel comparison of the three Sounder water vapor channels (6.5 µm, 7.0 µm, and 7.4 µm) and the standard Imager 6.5 µm water vapor channel (below; click image to play animation) showed that the southward propagation of the frontal gravity wave signature was most evident on the Sounder 7.0 µm and Imager 6.5 µm images, although there was also a more subtle indication on the Sounder 7.4 µm images. The new generation of geostationary satellite Imager instruments (for example, the AHI on Himawari-8 and the ABI on GOES-R) feature 3 water vapor channels which are similar to those on the current GOES Sounder, but at much higher spatial and temporal resolutions
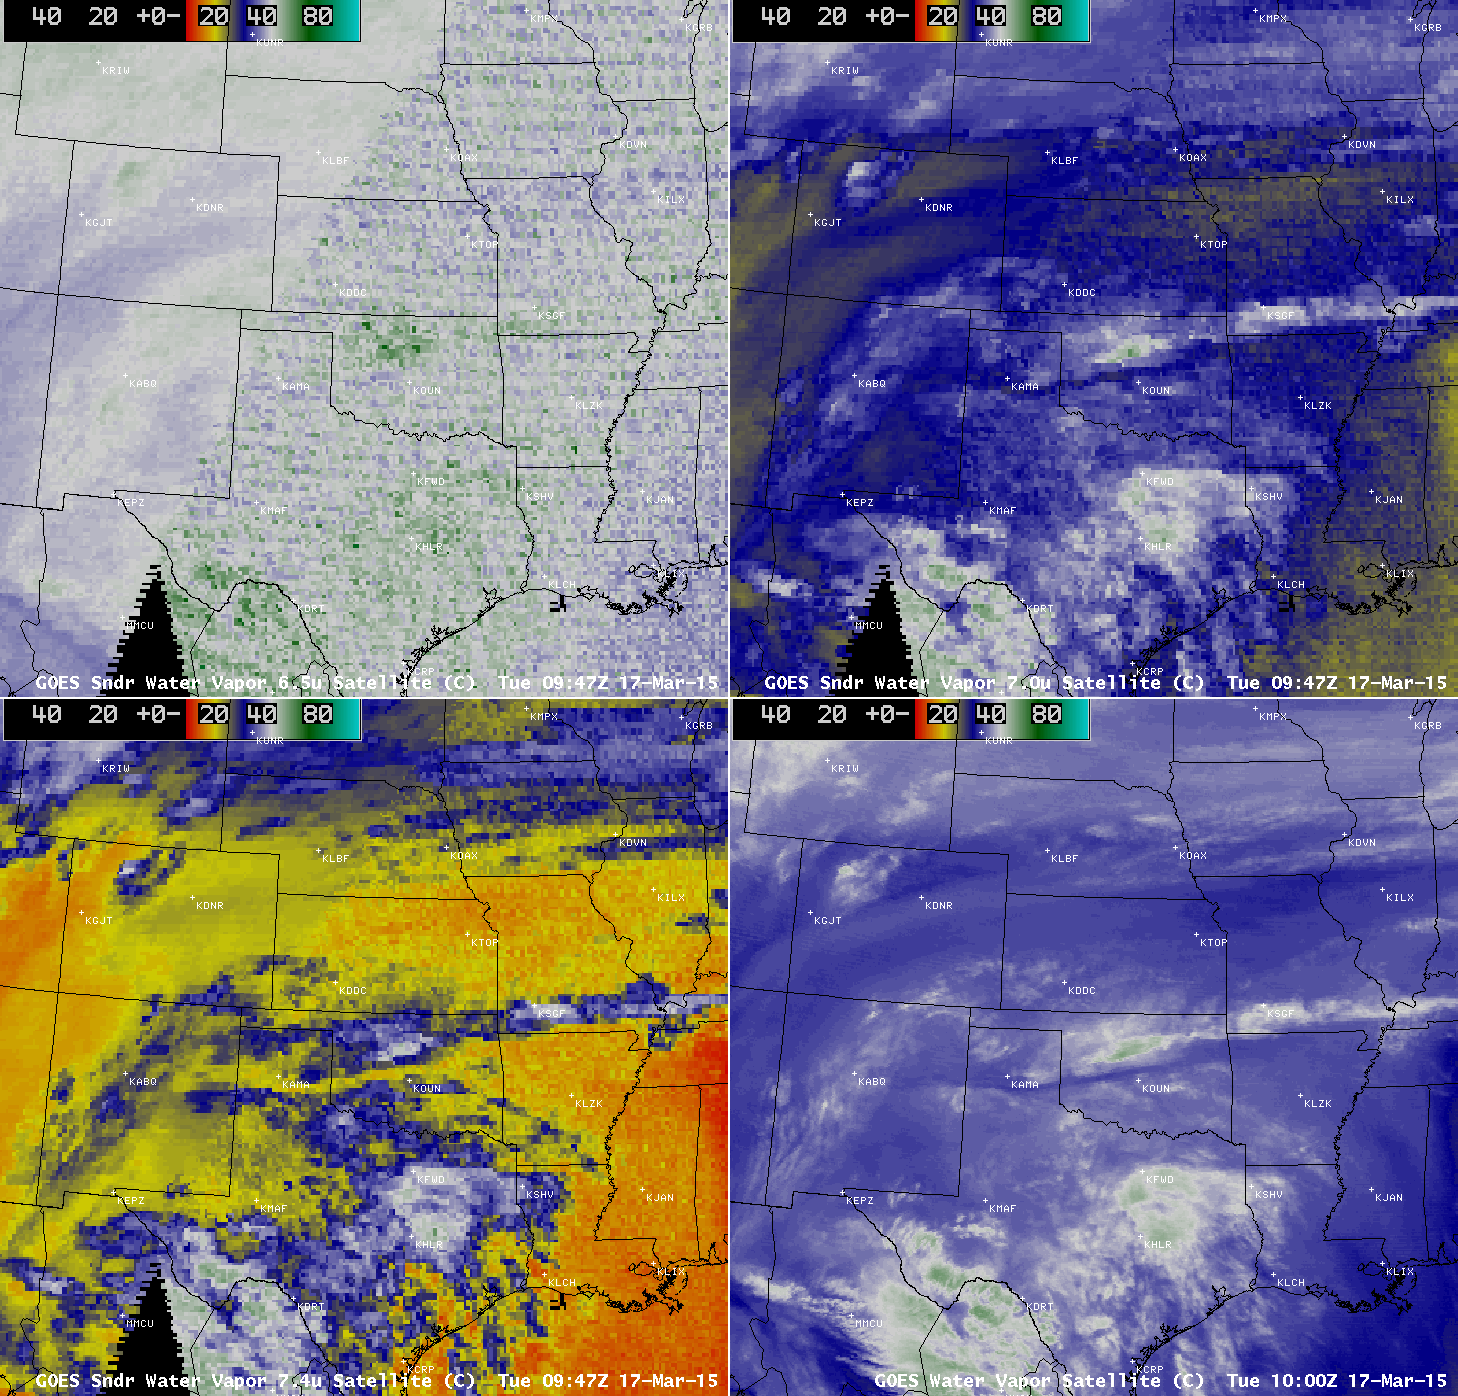
GOES-13 Sounder 6.5 µm (upper left), 7.0 µm (upper right), 7.4 µm (lower left), and Imager 6.5 µm (lower right) – click to play animation
————————————————————————-
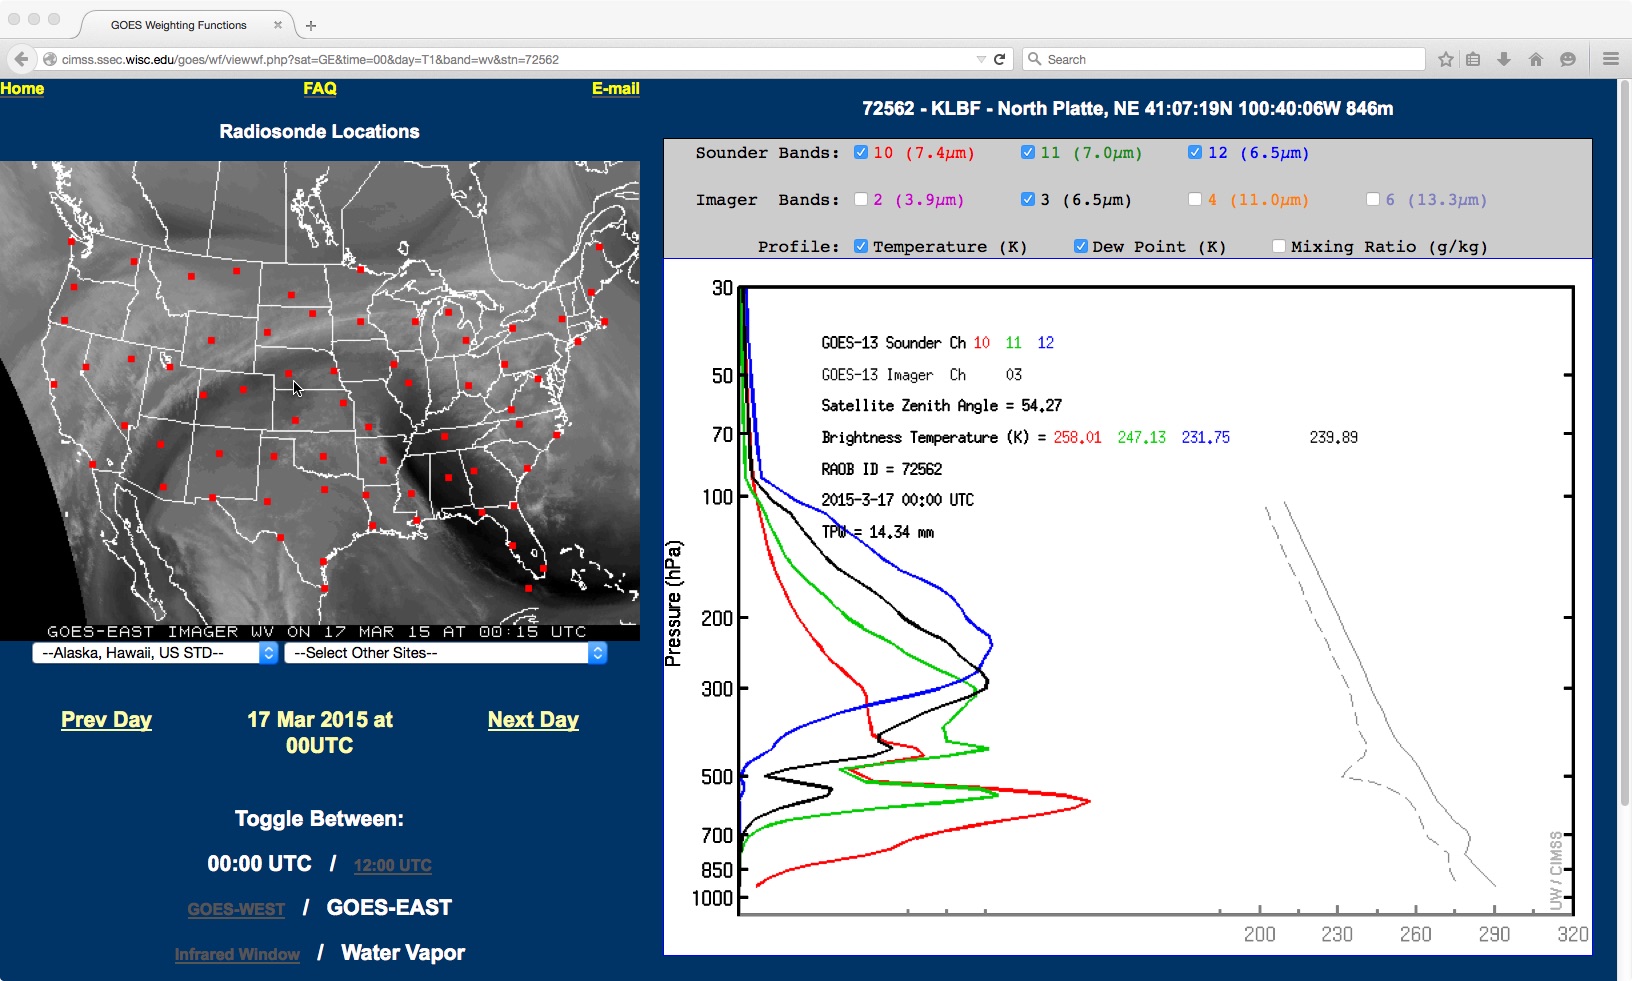
GOES-13 Sounder and Imager water vapor channel weighting functions for North Platte, Nebraska
The depth and altitude of the layer from which a particular water vapor channel is detecting radiation is shown by plotting its weighting function — for example, at North Platte, Nebraska (above), the Imager 6.5 µm plot (black) and the 7.0 µm plot (green) exhibited lower-altitude secondary peaks around the 500 hPa level — while farther to the south at Dodge City, Kansas (below) these 2 water vapor channel plots had their peaks located slightly higher in the atmosphere. Even though the bulk of the radiation was being detected from higher altitudes (due to the presence of moisture and cirrus clouds aloft over much of the southern Plains region), the sharp signal of the lower-altitude cold frontal gravity wave was strong enough to be seen in the deep layer average moisture brightness temperature depicted in the water vapor images.
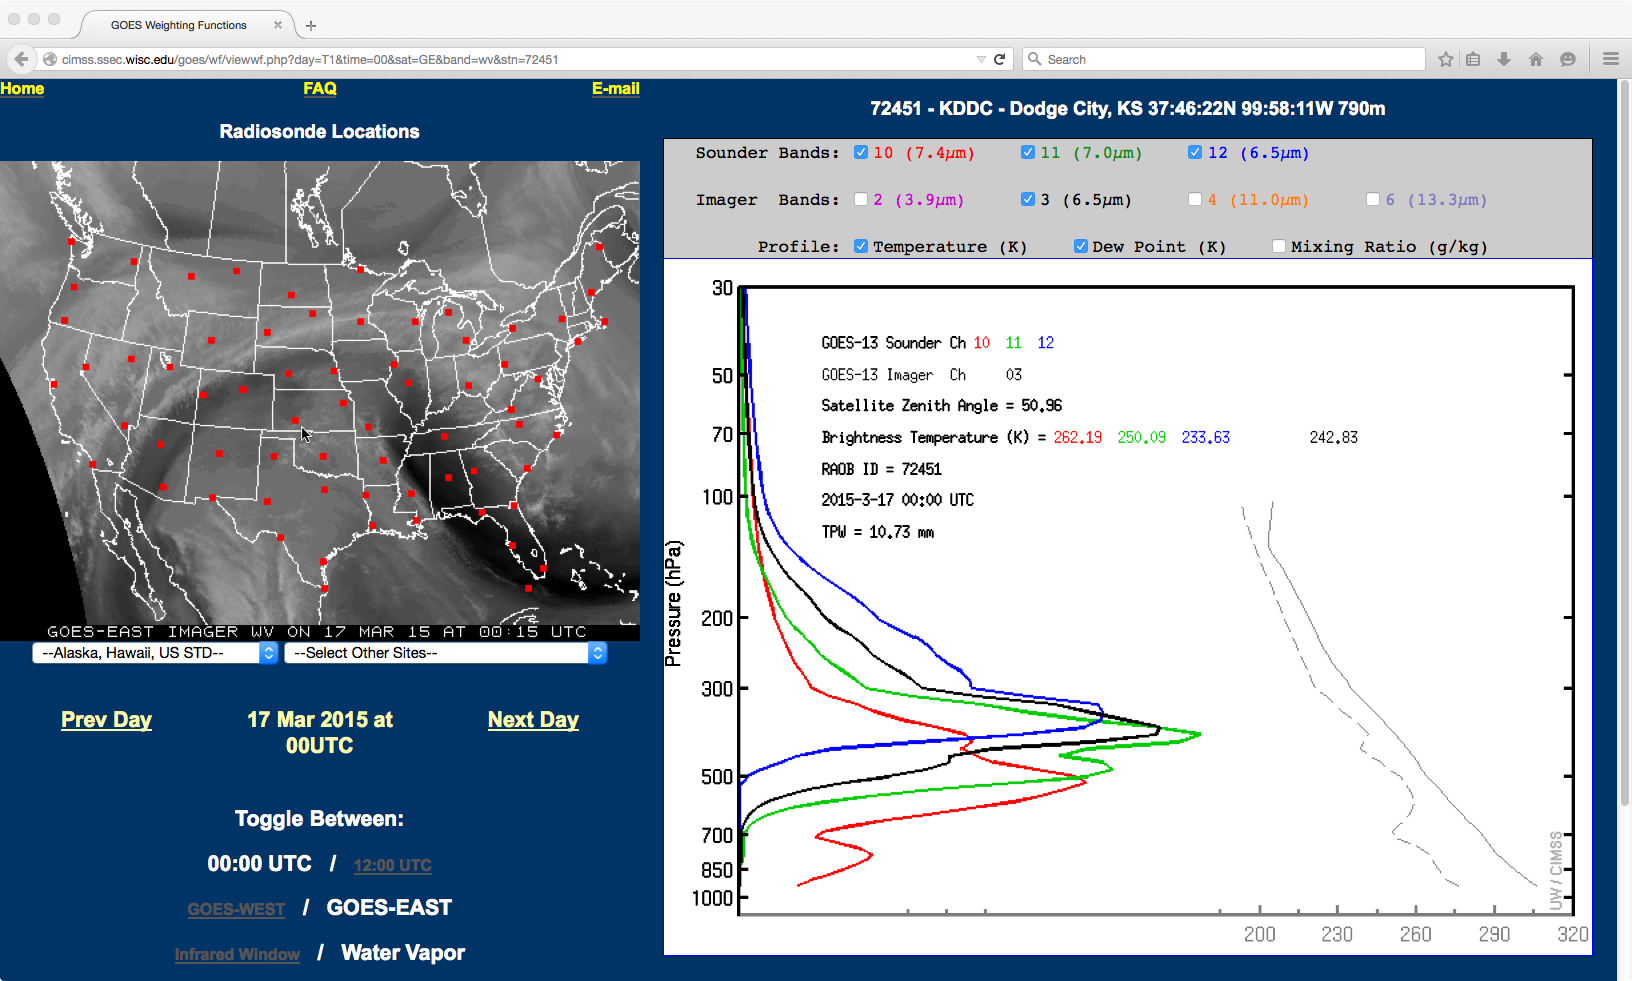
GOES-13 Sounder and Imager water vapor channel weighting functions
View only this post
Read Less


