The longwave infrared (10.7 µm) and shortwave infrared (3.9 µm) channels on GOES-13 have been shown in the past to have poor co-registration, meaning that the sensors are not viewing the same pixel at the same time. This error can lead to false signals in (for example) the IR Brightness Temperature Difference product that has... Read More
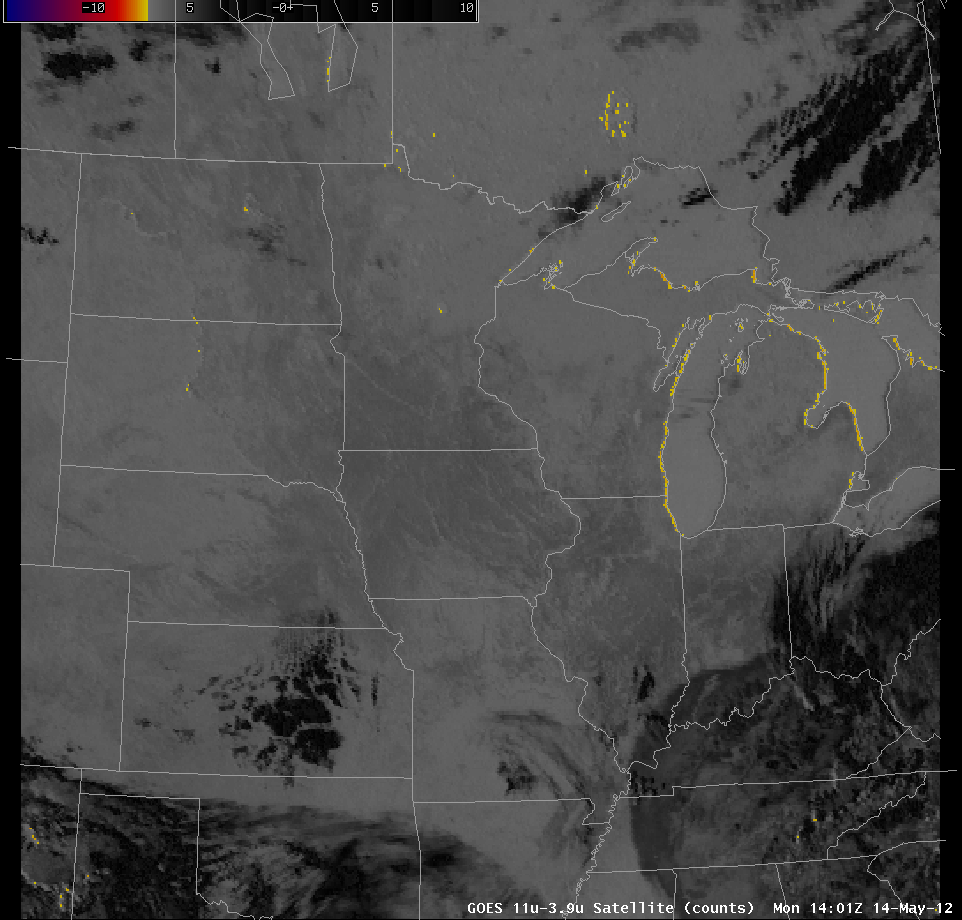
The longwave infrared (10.7 µm) and shortwave infrared (3.9 µm) channels on GOES-13 have been shown in the past to have poor co-registration, meaning that the sensors are not viewing the same pixel at the same time. This error can lead to false signals in (for example) the IR Brightness Temperature Difference product that has historically been used to detect fog and low stratus. The error can propagate to other products as well, such as GOES-R IFR Probabilities (a data fusion product used to detect fog). The error is most obvious along north-south shorelines.
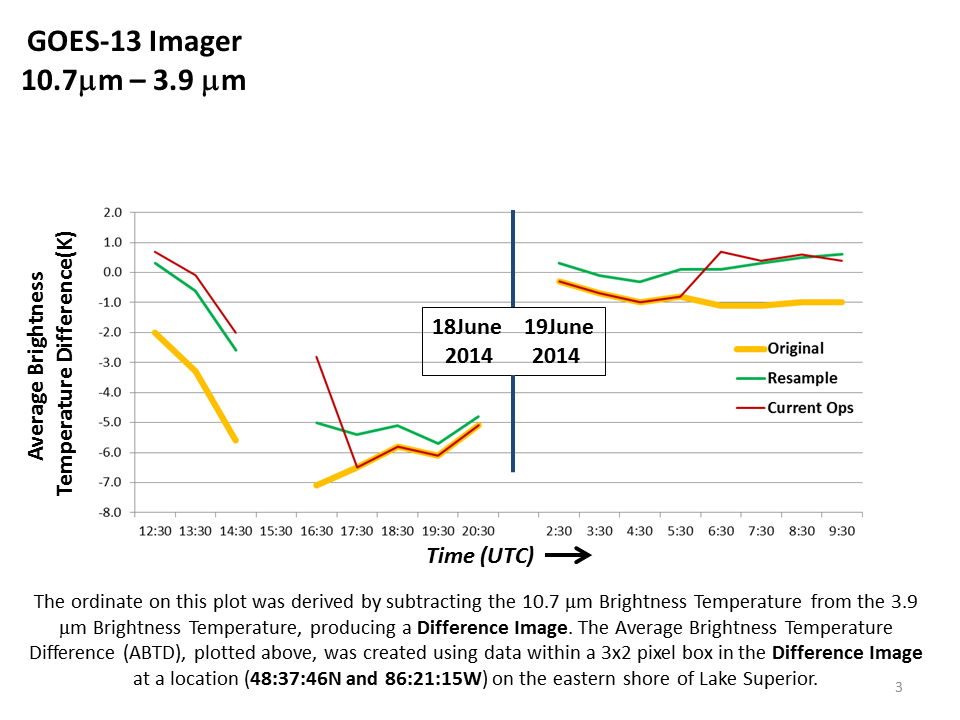
The figure below (Courtesy Tony Schreiner, SSEC/CIMSS) shows differences averaged over 6 pixels near the eastern shore of northern Lake Superior. The orange line (labeled ‘Original’) represents differences arising from the operational algorithm used before November 2014. Note that at 0700 UTC for this date and (clear) location (0600 UTC Surface Map) the brightness temperature difference nevertheless showed a negative value because the 10.7 µm pixel was over the cold lake and the 3.9 µm pixel was over warmer land. Shoreline on the western side of the lake would have a positive value: there, the 10.7 µm pixel would be over warm land and the 3.9 µm pixel (co-registered too far to the east) would be over cold water. This positive signal is consistent with fog detection.
In November 2014, NESDIS implemented a fix to mitigate the co-registration issue (
Link). One-pixel shifts were applied to the shortwave infrared (3.9 µm) data to force a better alignment. The
red line in the figure above (labeled ‘Current Ops’) shows brightness temperature differences that occurred when that fix was used; a one-pixel shift occurred, usually around 0700 and 1700 UTC, and that shift reduced the
average error. However, it also introduced a phenomena of fog signals appearing (or disappearing) quickly as the shift occurred. The animation below shows high clouds clearing in a small region over the Lake Michigan shoreline east of Green Bay; a fog signal appears suddenly at 0700 UTC. Similarly,
in this toggle over Baja California, fog is indicated on the western coastline of Baja at 0630 UTC (before the pixel shift) and on the eastern/southern coastline of Baja at 0700 UTC (after the pixel shift).
Imagery over the St. Lawrence shows fog/low clouds along the south shore of
Anticosti Island in the mouth of the St. Lawrence at 0630 UTC; at 0700 UTC, that indication of fog is gone, but it has appeared along the western shore of the St. Lawrence River.
GOES-13 Brightness Temperature Difference (10.7 -3.9), 4 February 2015, 0545 – 0800 UTC (Click to enlarge)
The red line in the figure above also shows a shift at 1700 UTC, and that shift is apparent in data as well, as shown in the brightness temperature difference product, below, north of Lake Superior. The apparent shift occurs in the 1700 UTC image.
GOES-13 Brightness Temperature Difference, 1630, 1645 and 1700 UTC on 8 February 2015 (Click to enlarge)
Between the 1515 and 1545 UTC imagery on 9 February 2015, a software change was implemented by NESDIS (link), and that now operational software is represented by the green line (labeled ‘Resample’) in the figure above. Rather than a step function change, a smoothly varying change is applied to the co-registration over the course of the day. This has reduced the obvious changes in brightness temperature difference fields that occurred between 0645 and 0700 and between 1645 and 1700 UTC. Consider the two animations below (Courtesy Jim Nelson, SSEC/CIMSS). In both, the former operational technique (the red line in the figure above) is on the left and the current operational technique (the green line in the figure above) is on the right. The operational change has certainly eliminated the jump that was occurring at 0700 and 1700 UTC.
GOES-13 Brightness Temperature Difference fields, 0645 and 0700 UTC on 9 February (Left) and 10 February (Right)
GOES-13 Brightness Temperature Difference fields, 1645 and 1700 UTC on 8 February (Left) and 9 February (Right)
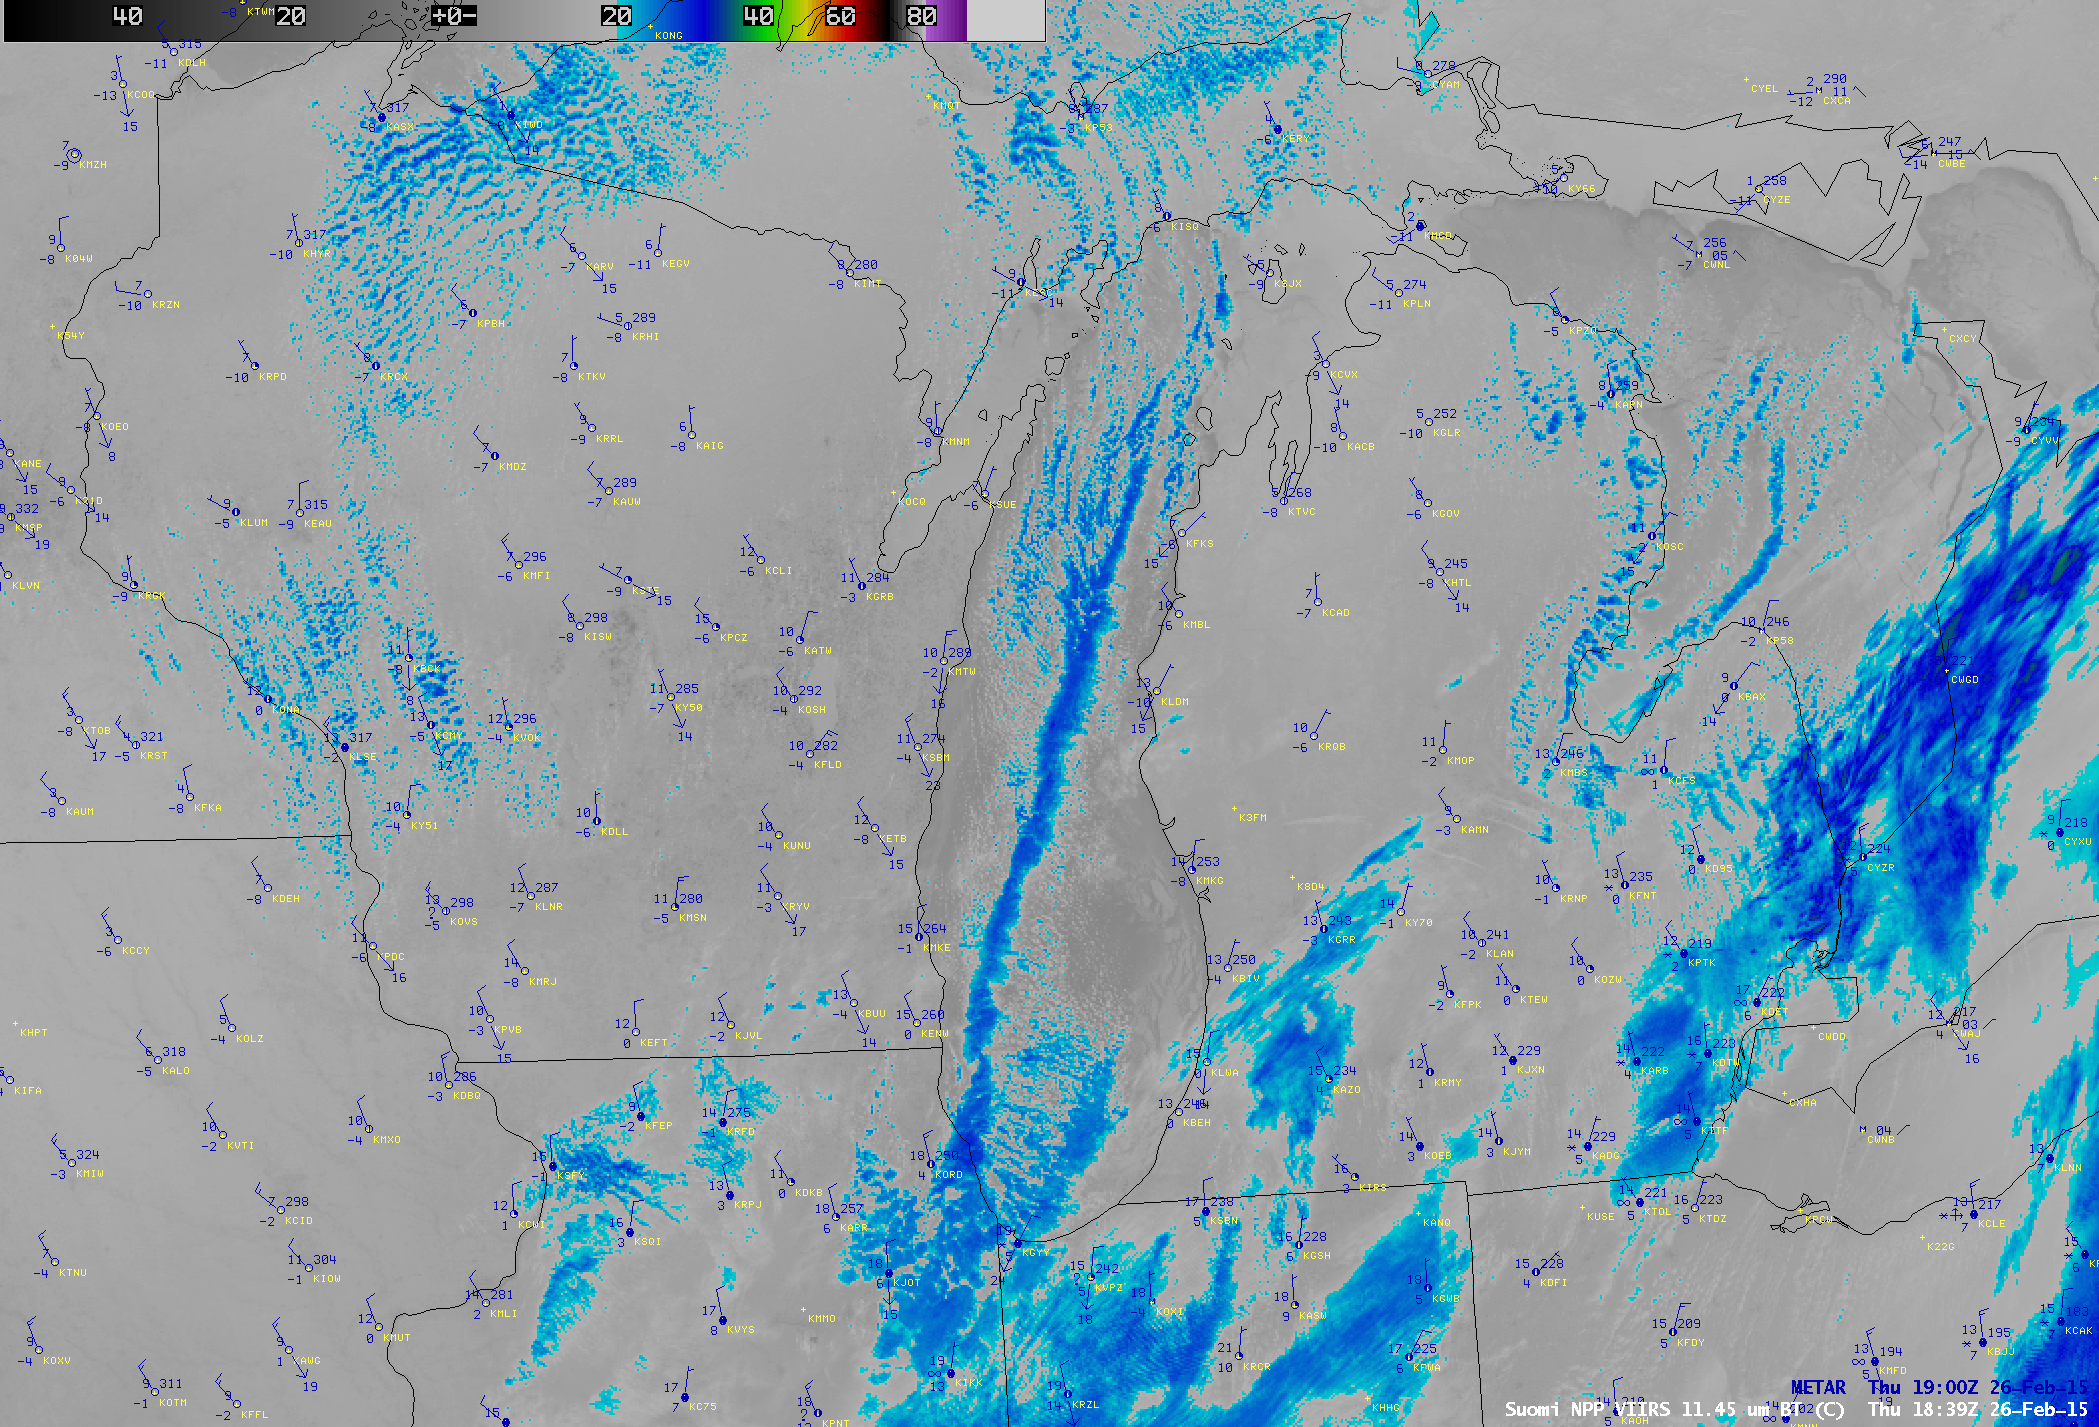
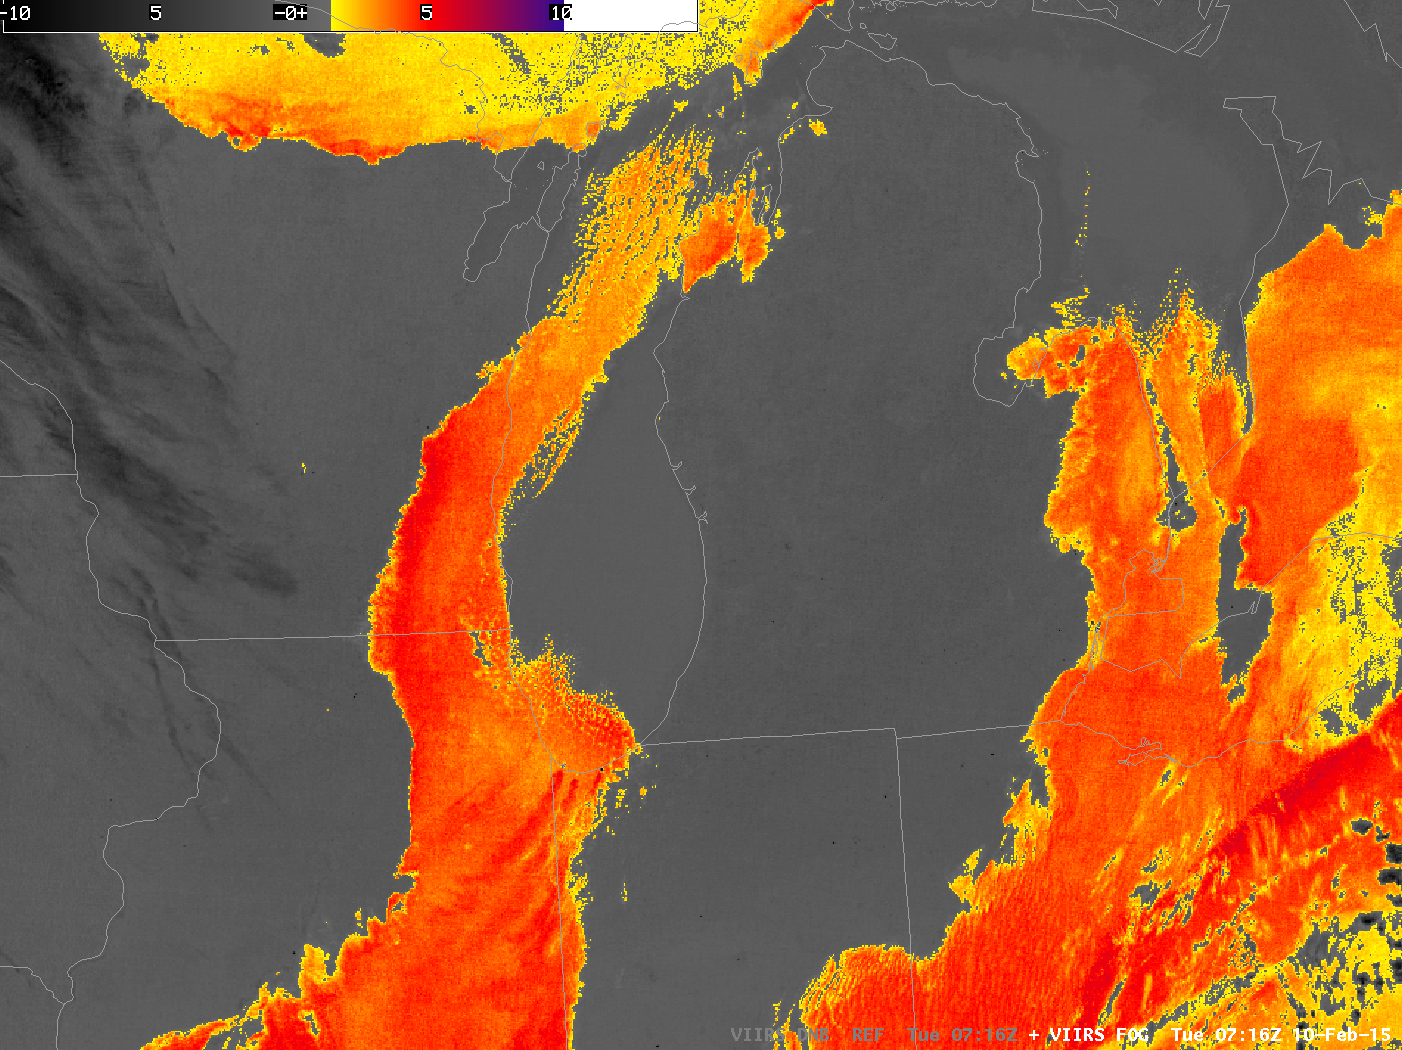
Note that even the green line in the figure up top shows errors approaching 1 C at times during the day (and that may change over the course of the year). It is therefore still possible to find cases in which the brightness temperature difference field from GOES erroneously indicates fog or low stratus. The toggle below shows data from 10 February, after the operational change. A fog/stratus signal is indicated by the GOES Brightness Temperature Difference product along the eastern shore of Lake Michigan; however, there is no signature of fog/stratus on the VIIRS Day Night Band and brightness temperature difference (11.35µm – 3.74µm) imagery from Suomi NPP. As always, a positive indication of a phenomena in data should always be verified with other data types.
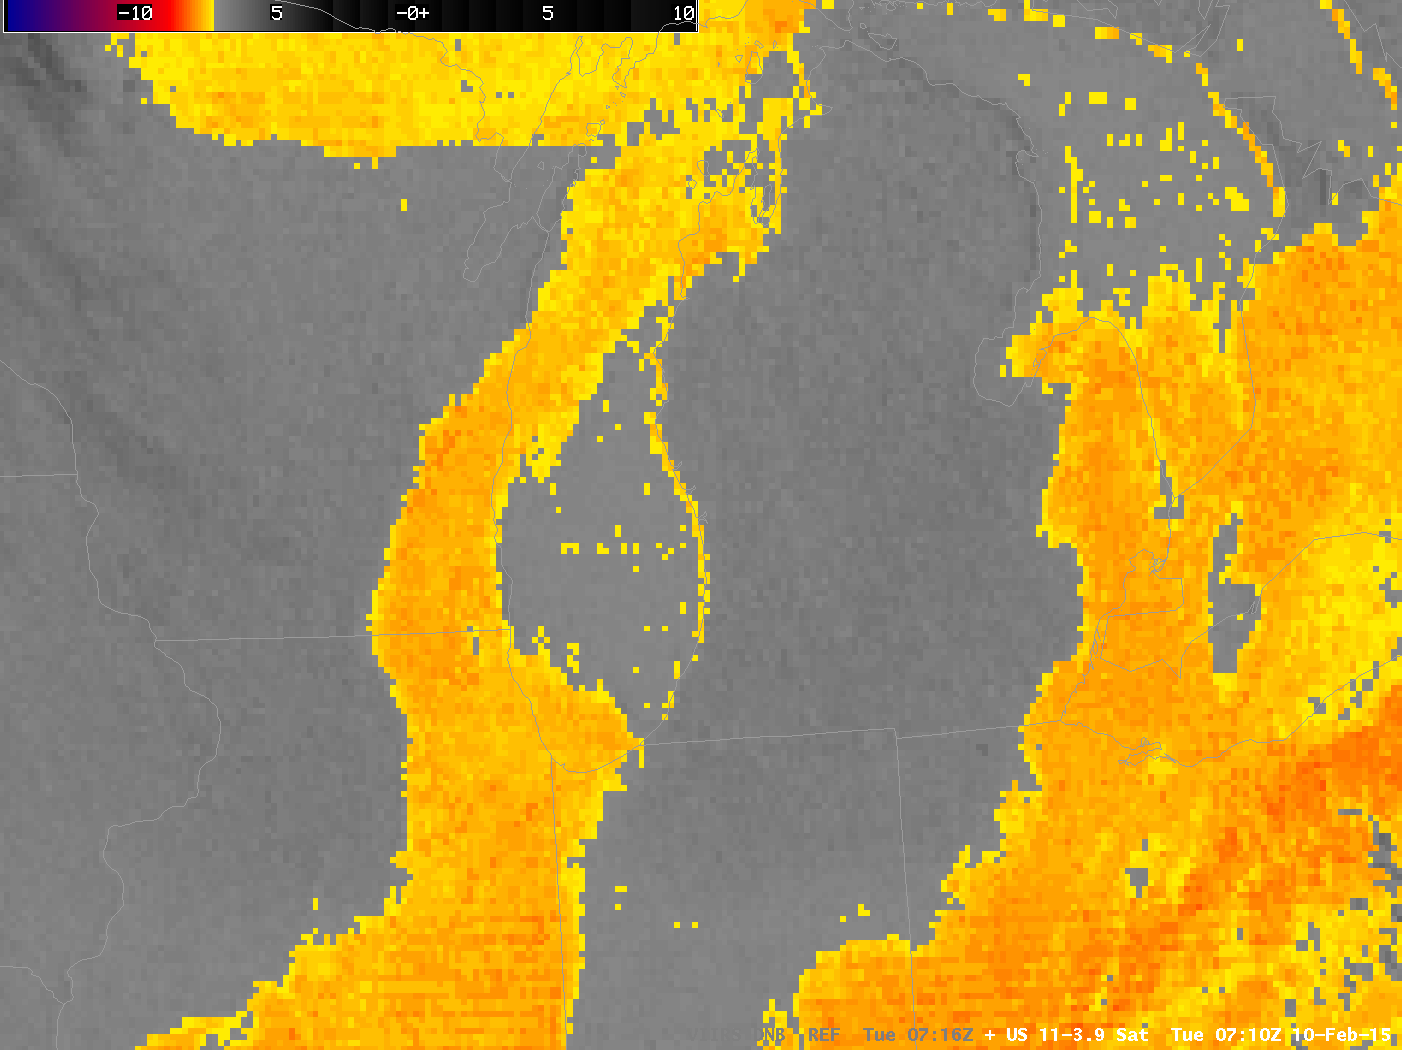
GOES-13 Brightness Temperature Difference (10.7 µm – 3.9 µm), Suomi NPP Day Night Band (0.70 µm) and Suomi NPP Brightness Temperature Difference (11.35 µm – 3.74 µm), 10 February 2015, 0715 UTC (Click to animate)
[Added, Friday the 13th]: The co-registration error between the longwave and shortwave infrared bands on the GOES-13 Imager is larger than on any of the other Imagers from GOES-8 through GOES-15. For more information, see here and here.
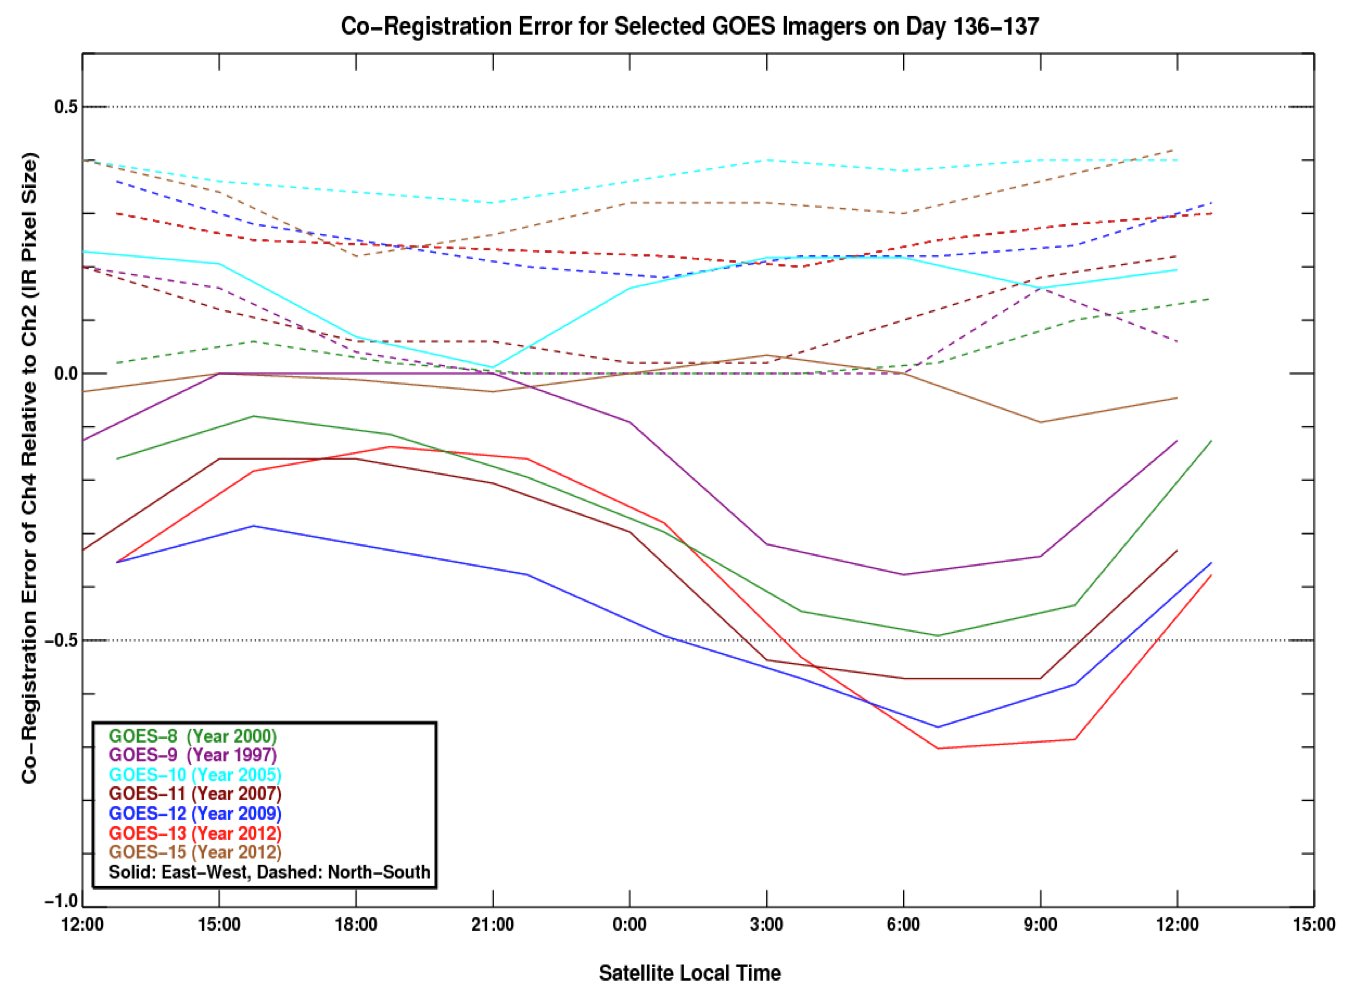
Comparison of co-registration errors between various GOES satellites
View only this post
Read Less

