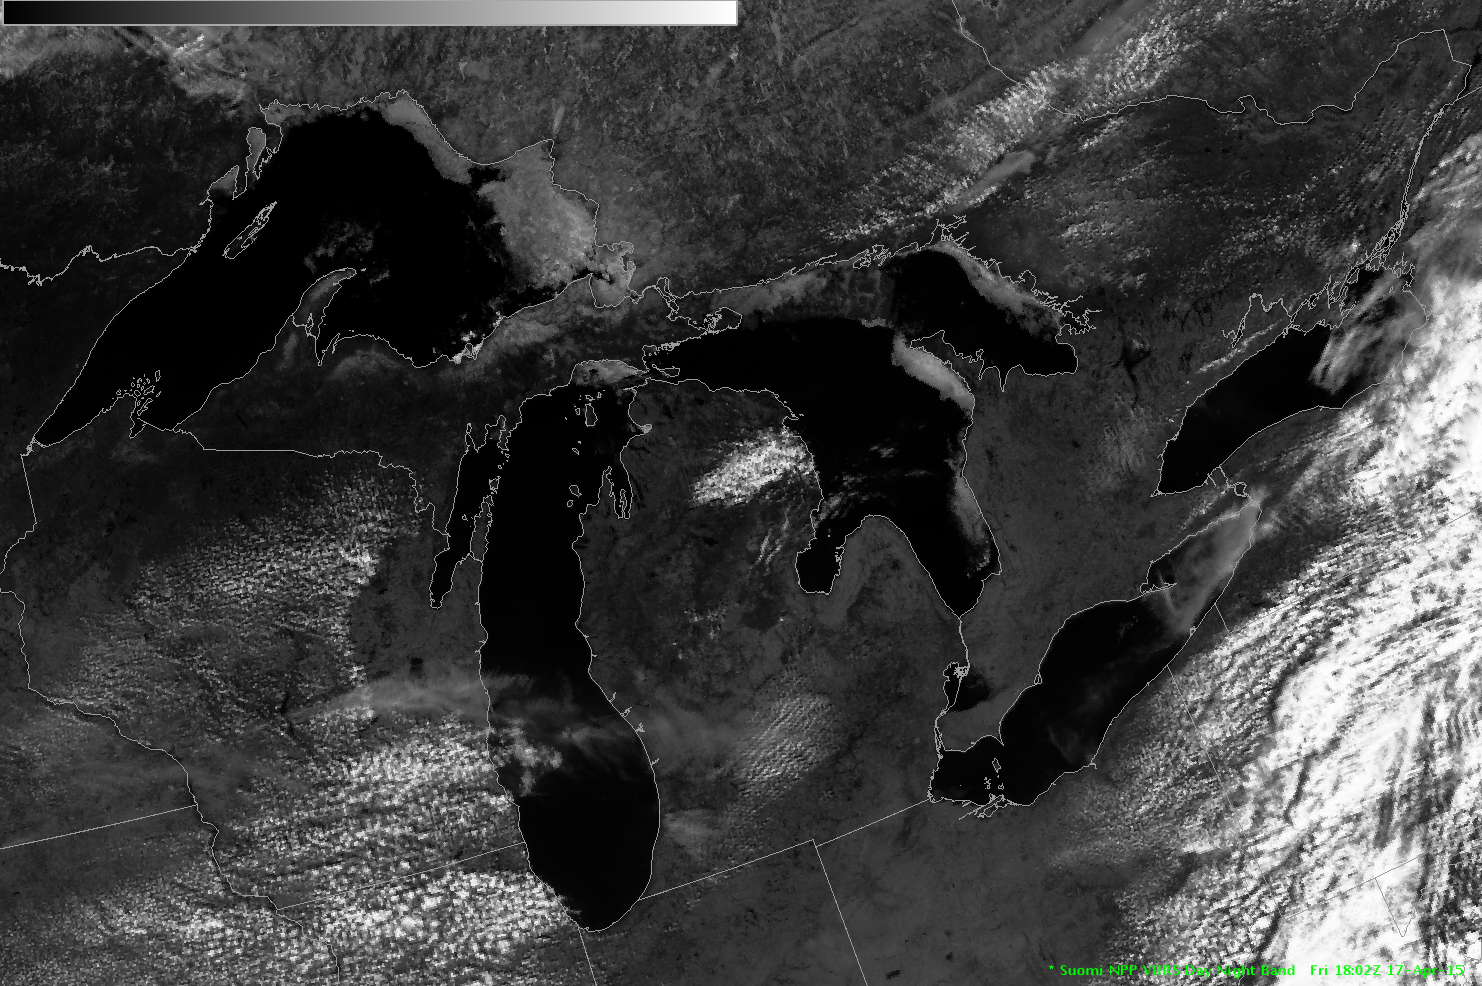
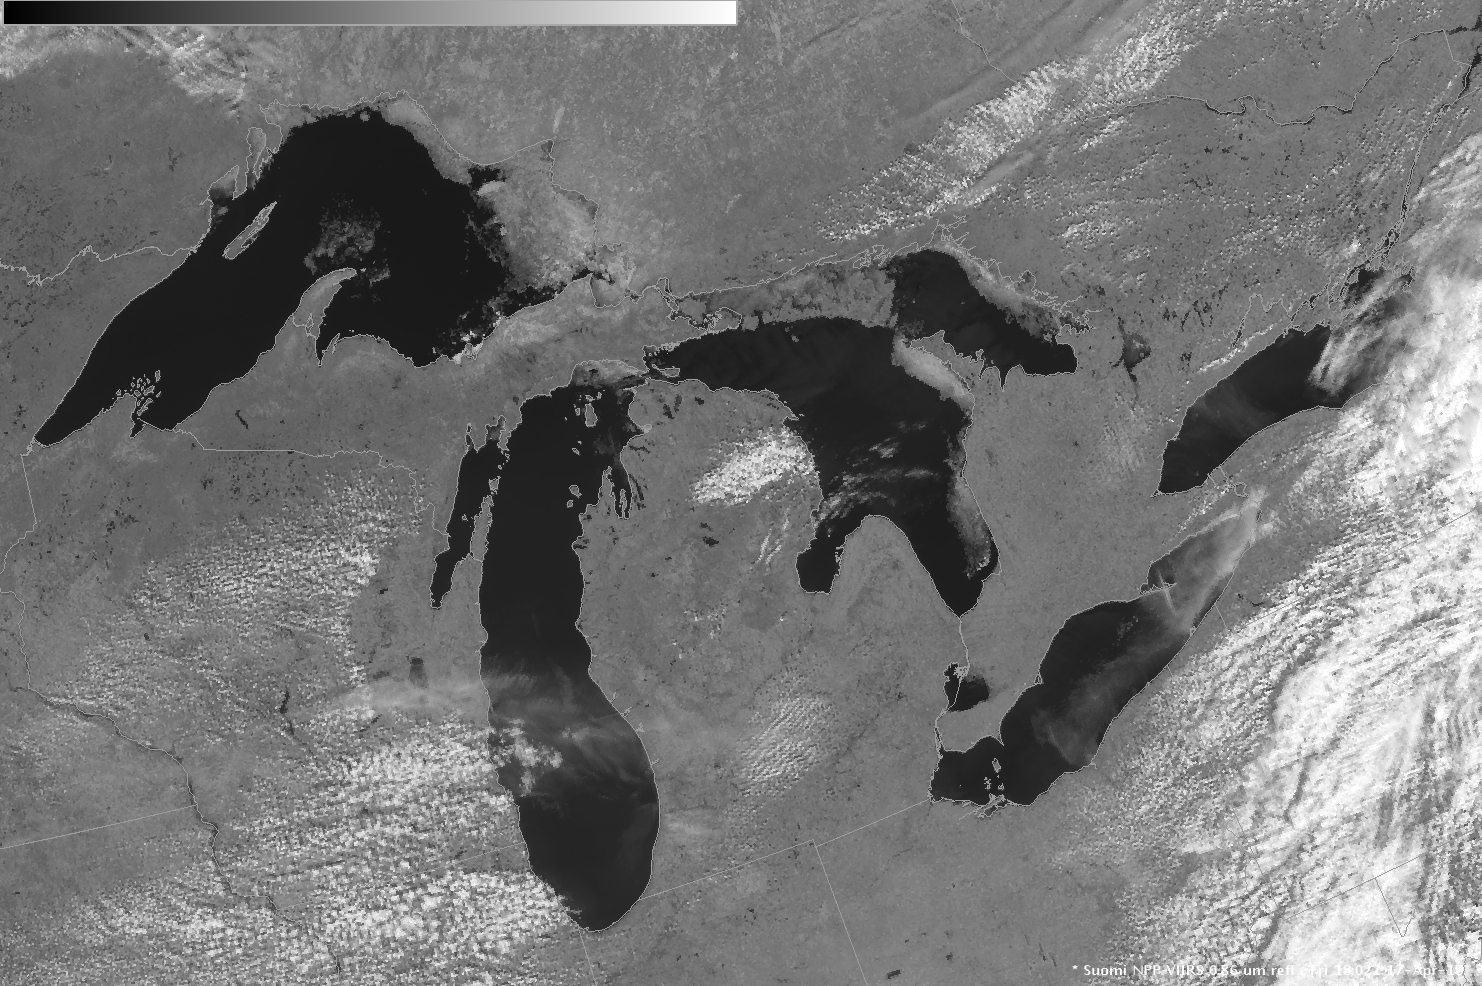
Visible Imagery over the Great Lakes on Friday April 17th showed mostly open waters over the five lakes, with regions that could be ice confined to coastlines of Lakes Superior, Huron, Erie and Michigan. The animation above is of Suomi NPP VIIRS visible (0.64µm and 0.70µm) and near-infrared (0.86µm) data.... Read More
Suomi-NPP Imagery: Visible (0.64µm), Day Night Band (0.70µm) and near-IR (0.86µm) images (click to enlarge)
Visible Imagery over the Great Lakes on Friday April 17th showed mostly open waters over the five lakes, with regions that could be ice confined to coastlines of Lakes Superior, Huron, Erie and Michigan. The animation above is of Suomi NPP VIIRS visible (0.64µm and 0.70µm) and near-infrared (0.86µm) data. Can you tell with certainty which of the white features over the lakes are clouds vs. ice?
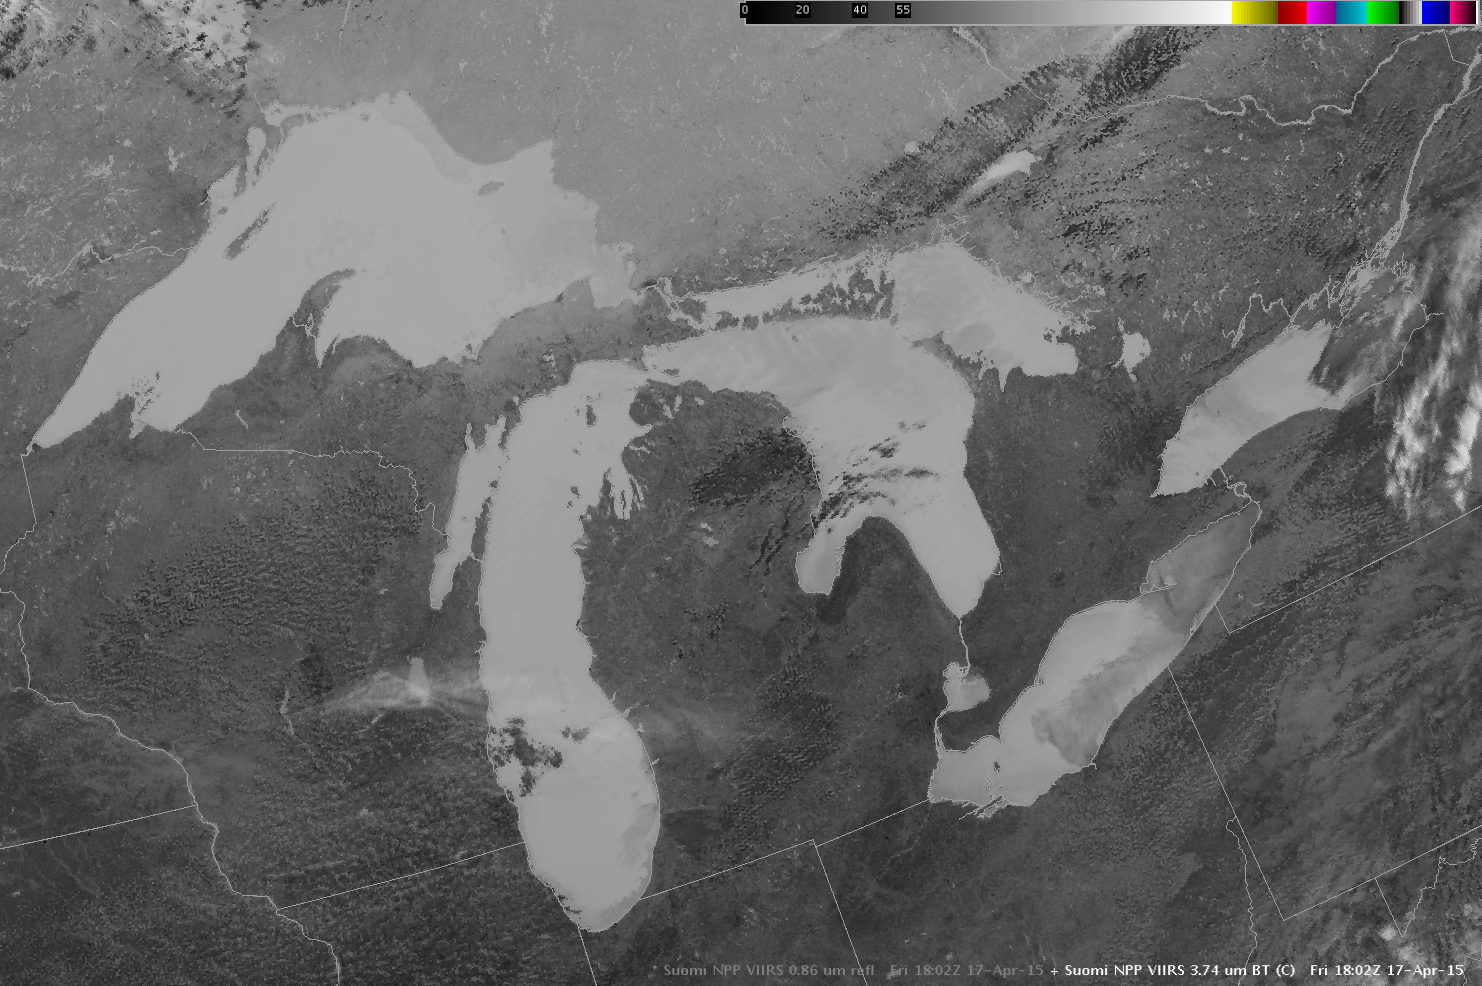
Suomi-NPP Infrared Imagery (3.74 µm) (click to enlarge)
Infrared data can give clues. The 3.74 µm imagery, above, shows the brightness temperature. Note how the white regions over Lakes Superior, Michigan and Ontario are about the same temperature as the surrounding water. In contrast, white regions over Lakes Erie and Ontario are much darker (warmer) in the 3.74 µm than the surrounding water. This is testimony to the superior scattering abilities around 3.74 µm of water-based clouds compared to lake ice. More solar radiation scattered towards the satellite by the clouds means a warmer temperature is detected.

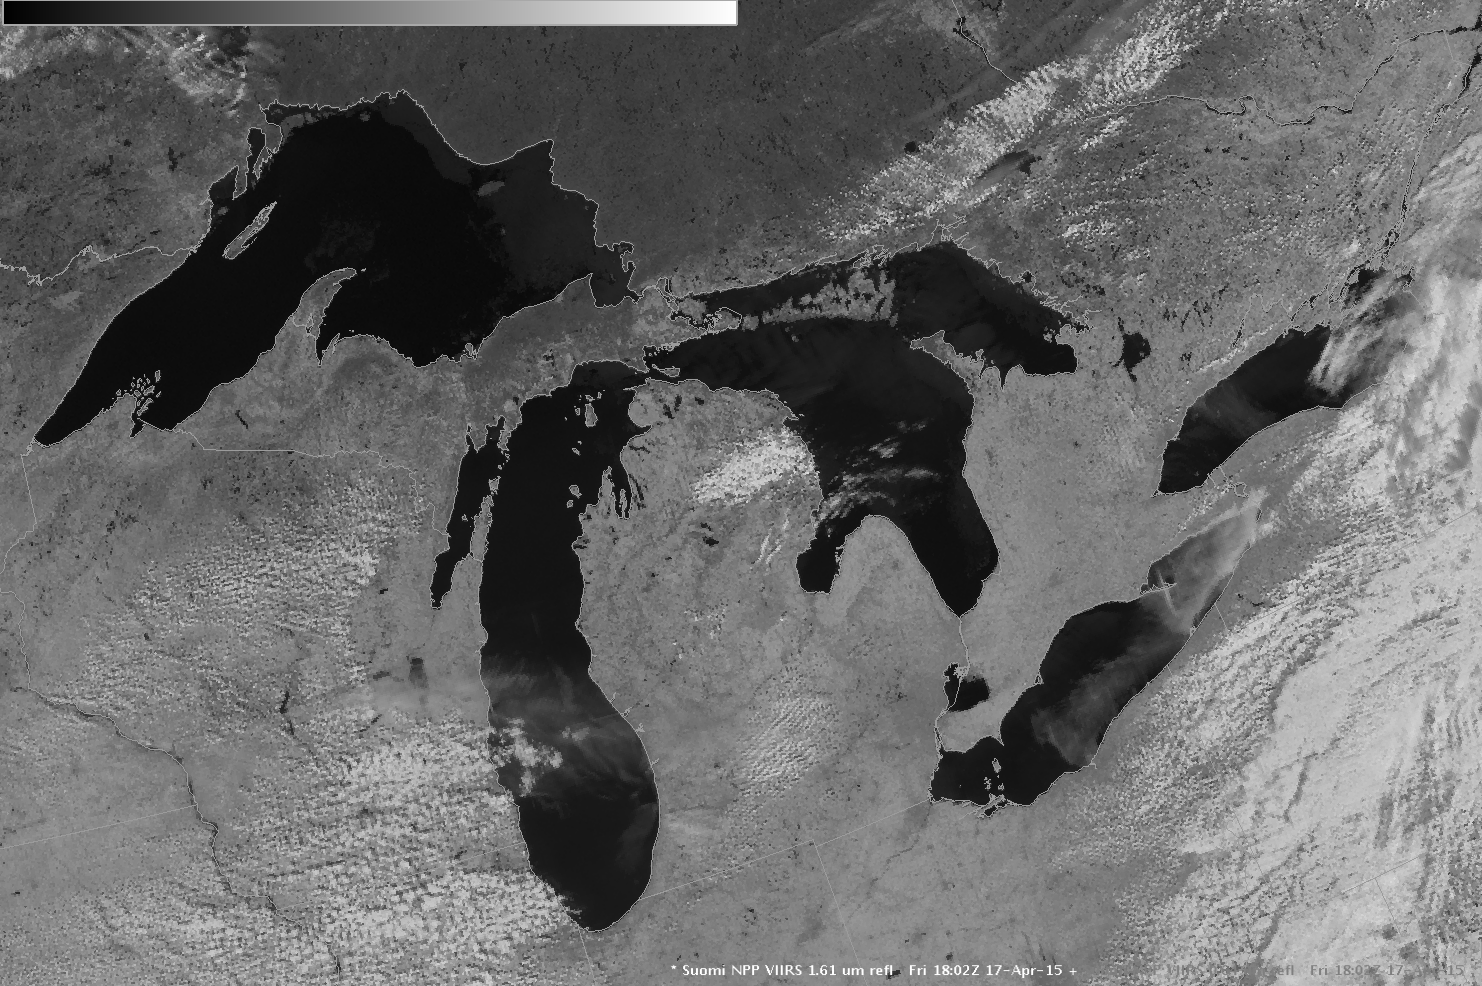
Suomi-NPP Imagery: Visible (0.64µm) and near-IR (1.61 µm) (click to enlarge)
The 1.61 µm near-infrared channel is useful because ice strongly absorbs solar radiation at that wavelength, appearing dark. The toggle above, of visible (0.64) and near-infrared (1.61) neatly distinguishes between clouds and ice. Ice (dark in the 1.61 µm because it does not reflect; at that wavelength, it absorbs) is apparent over eastern Lake Superior, eastern and northern Lake Huron and some small bays in northern Lake Michigan. There is no ice apparent on Lakes Erie or Ontario: features there exhibit signatures which are white in both visible and at 1.61 µm.
Another method to aid in the discrimination of snow/ice vs supercooled water droplet clouds is the creation of Red/Green/Blue (RGB) products. The example below toggles between the 0.64 µm visible image and an RGB image (which uses the VIIRS 0.64 µm/1.61 µm/1.61 µm data as the R/G/B components) — snow cover and ice appear as darker shades of red on the RGB image (in contrast to supercooled water droplet clouds, which are brighter shades of white). The snow depth on the morning of 17 April was still 13 inches at Munising in the Upper Peninsula of Michigan.
Suomi NPP VIIRS 0.64 µm visible and false-color RGB images (click to enlarge)
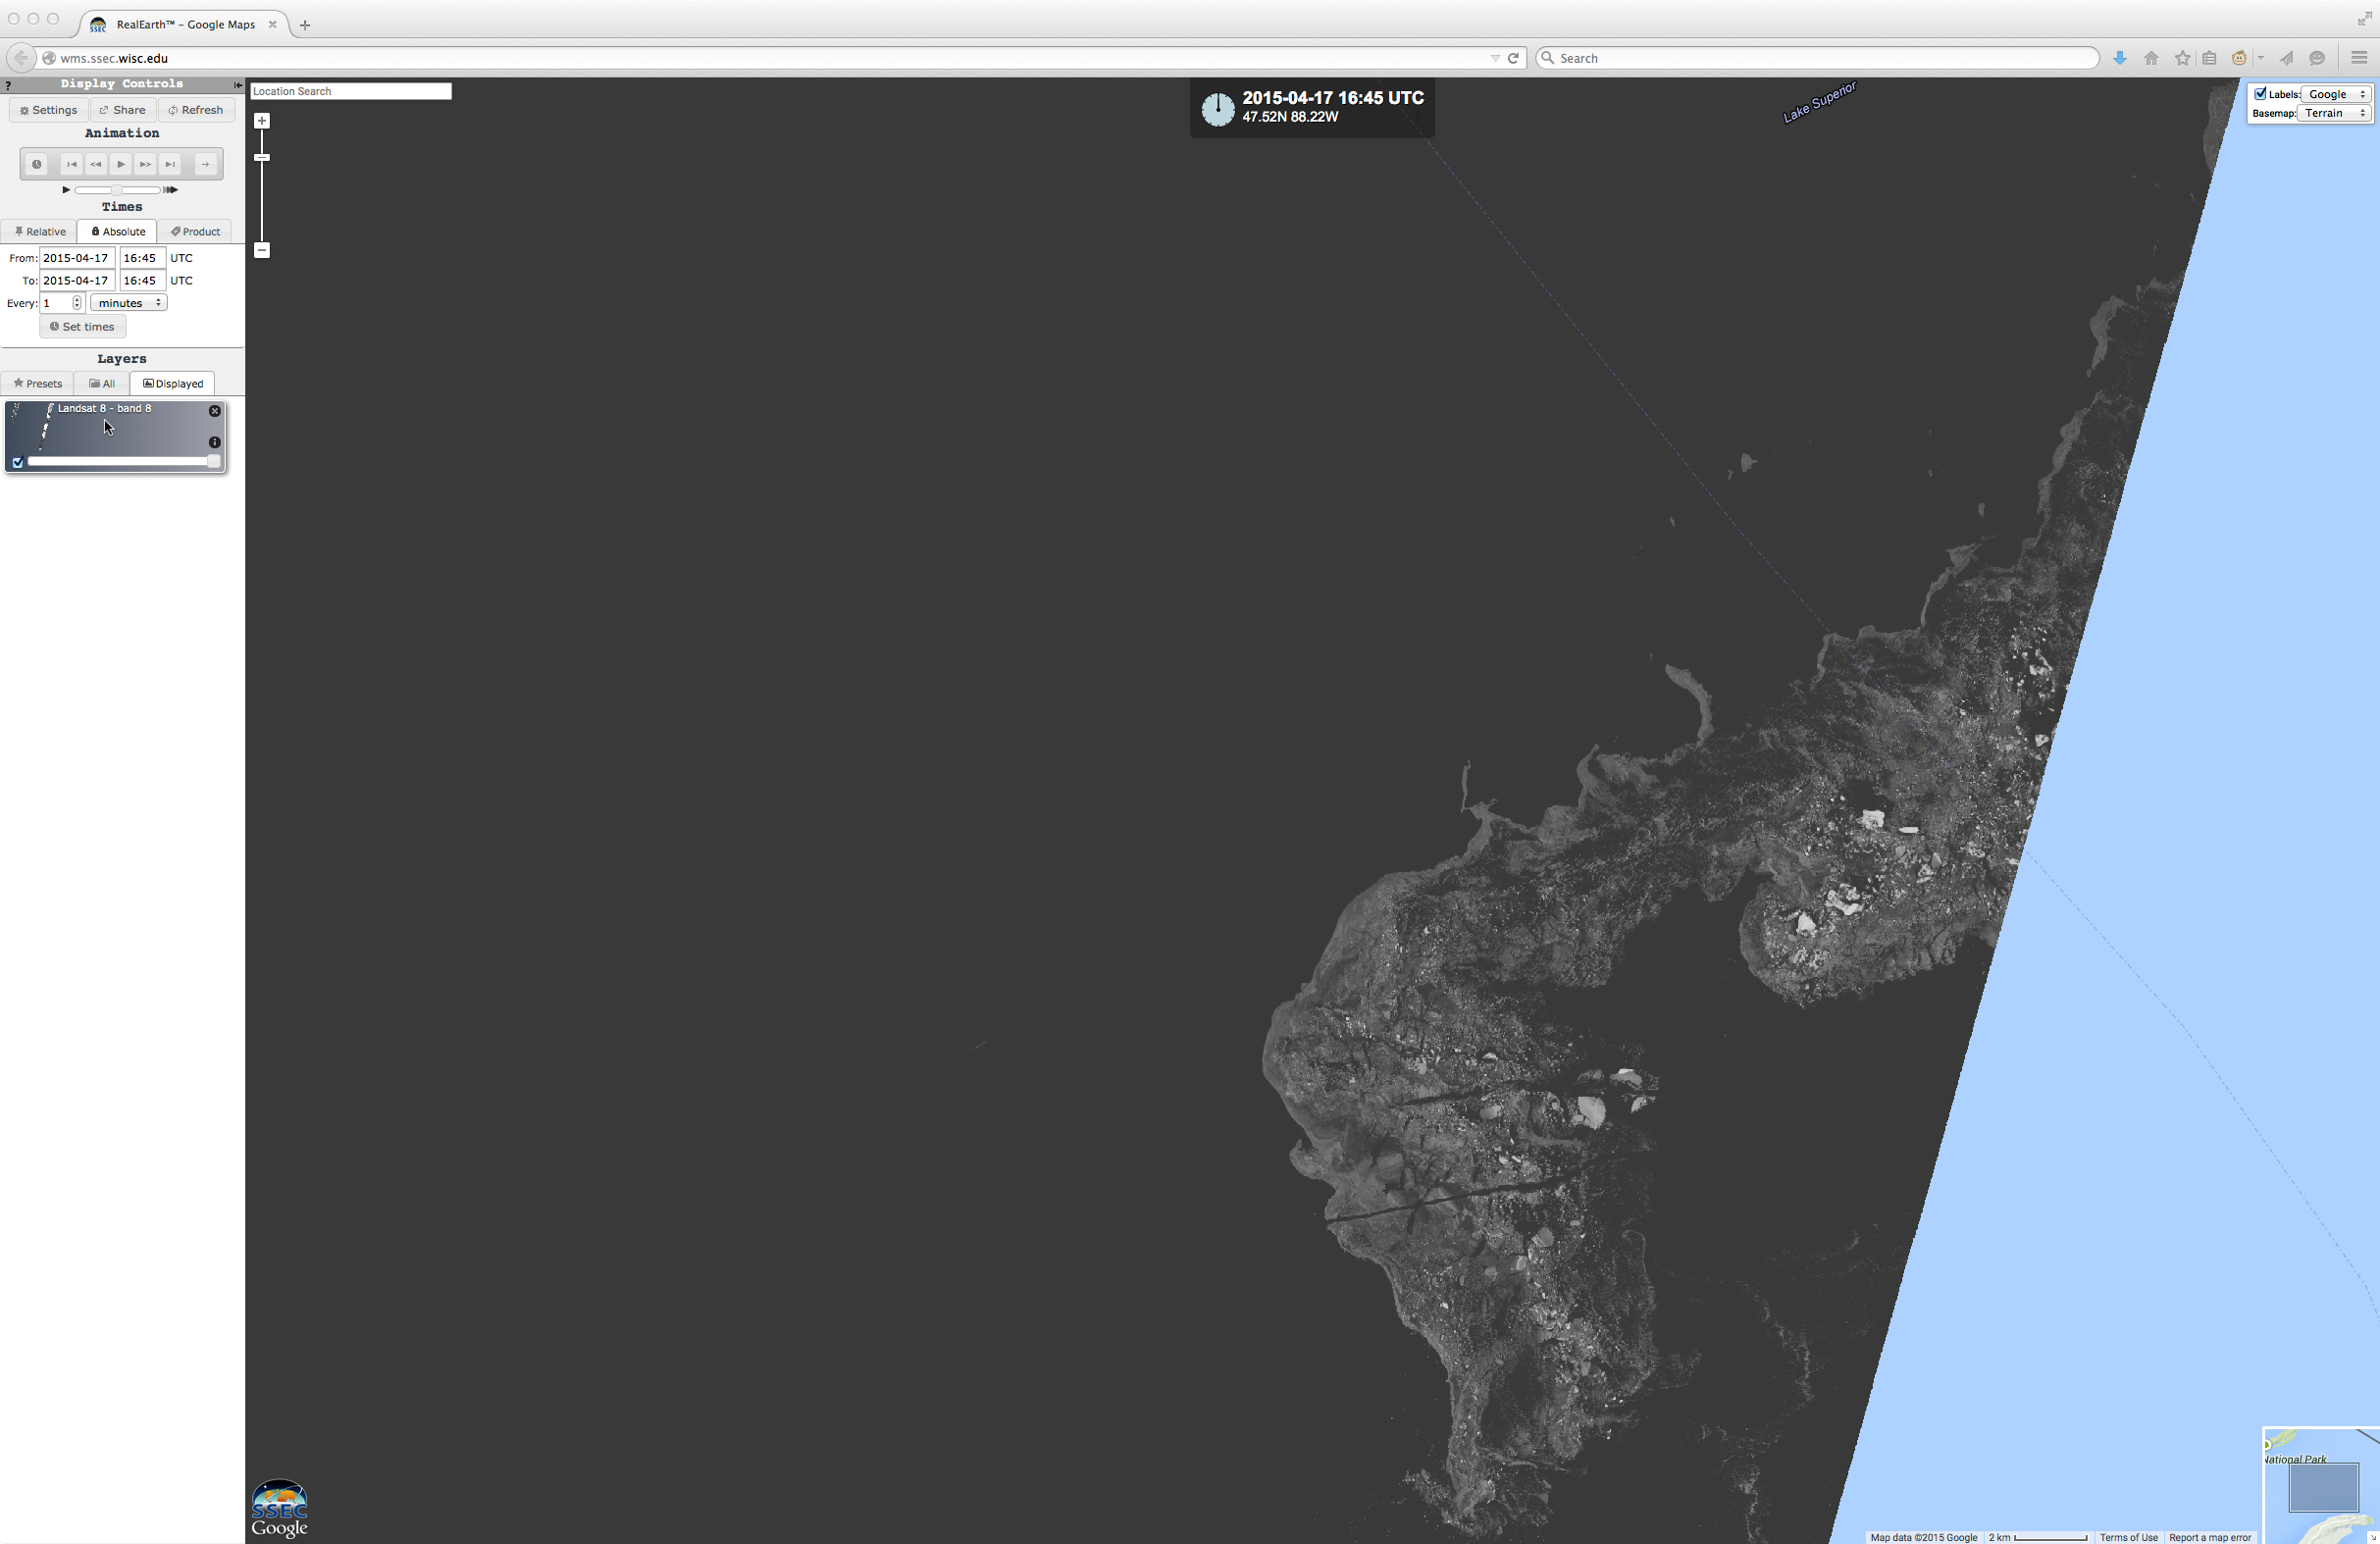
On this day there was only 1 pass of the Landsat-8 satellite over any of the ice-covered portions of the Great Lakes; the 15-meter resolution panchromatic visible (0.59 µm) image below shows a very detailed view of the far western portion of the ice that was north of the Keweenaw Peninsula in Lake Superior (zoomed image).
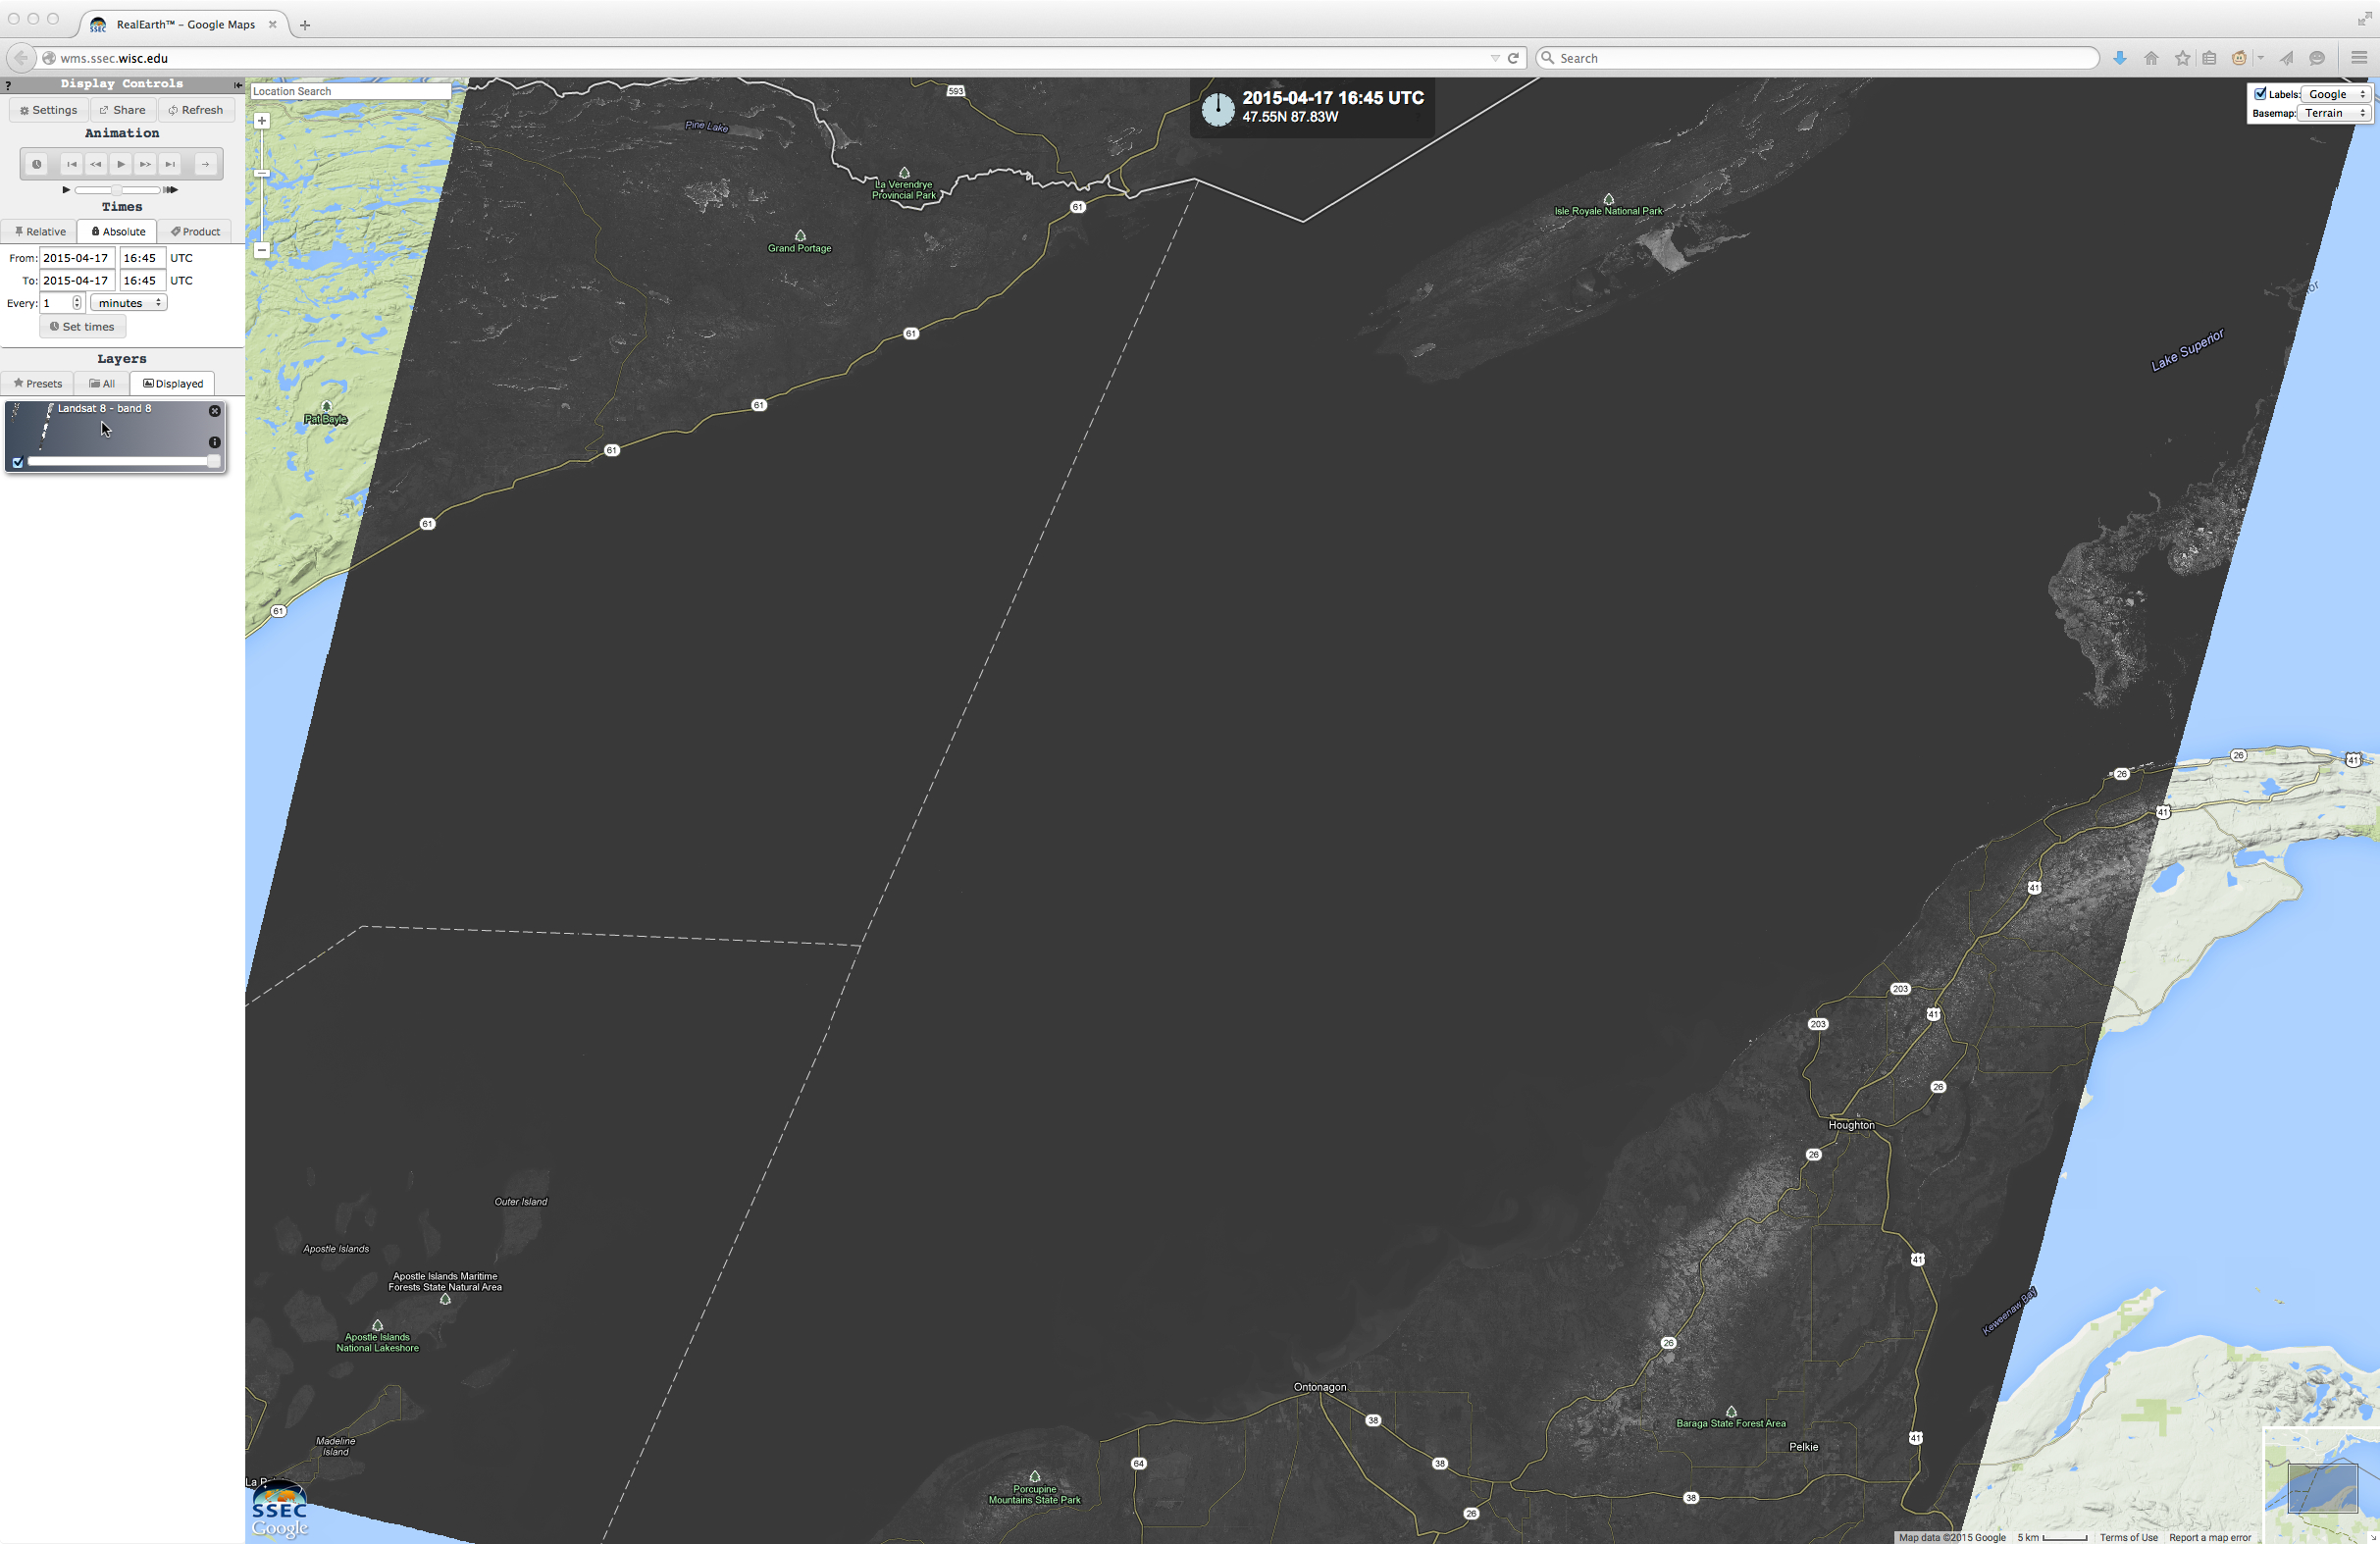
Landsat-8 panchromatic visible (0.59 µm) image (click to enlarge)
Terra and Aqua both carry the MODIS sensor, and MODIS can detect radiation at 1.38 µm, a wavelength at which cirrus is highly reflective. A 1.38 µm image from the 17th, below, shows the horizontal extent of cirrus.
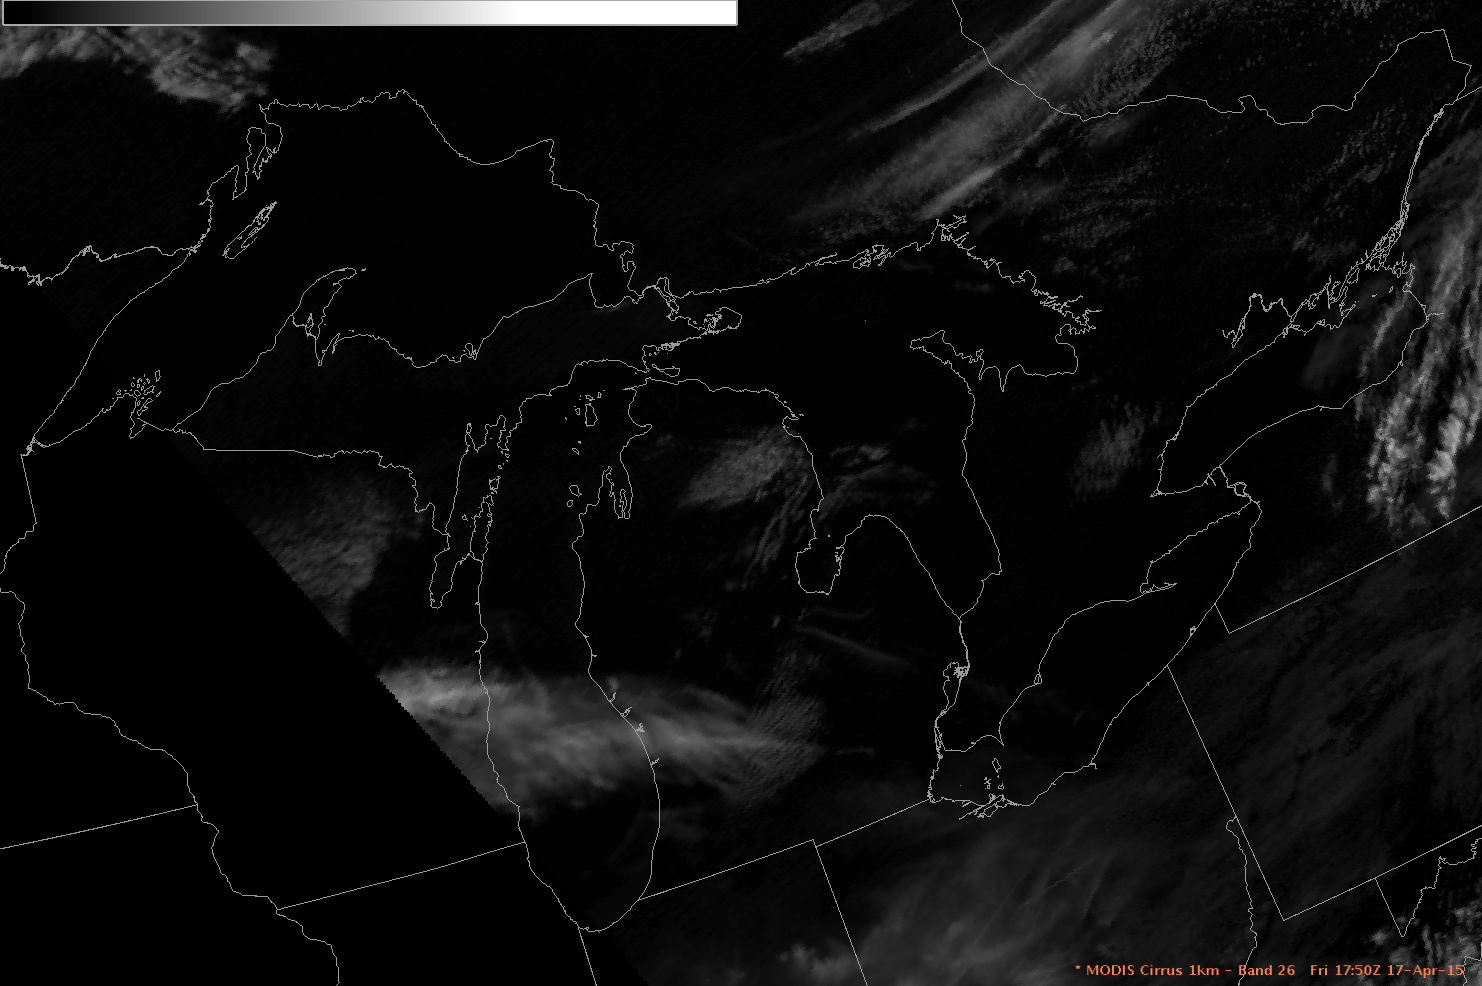
MODIS Imagery: near-IR (1.38 µm) (click to enlarge)
View only this post
Read Less


