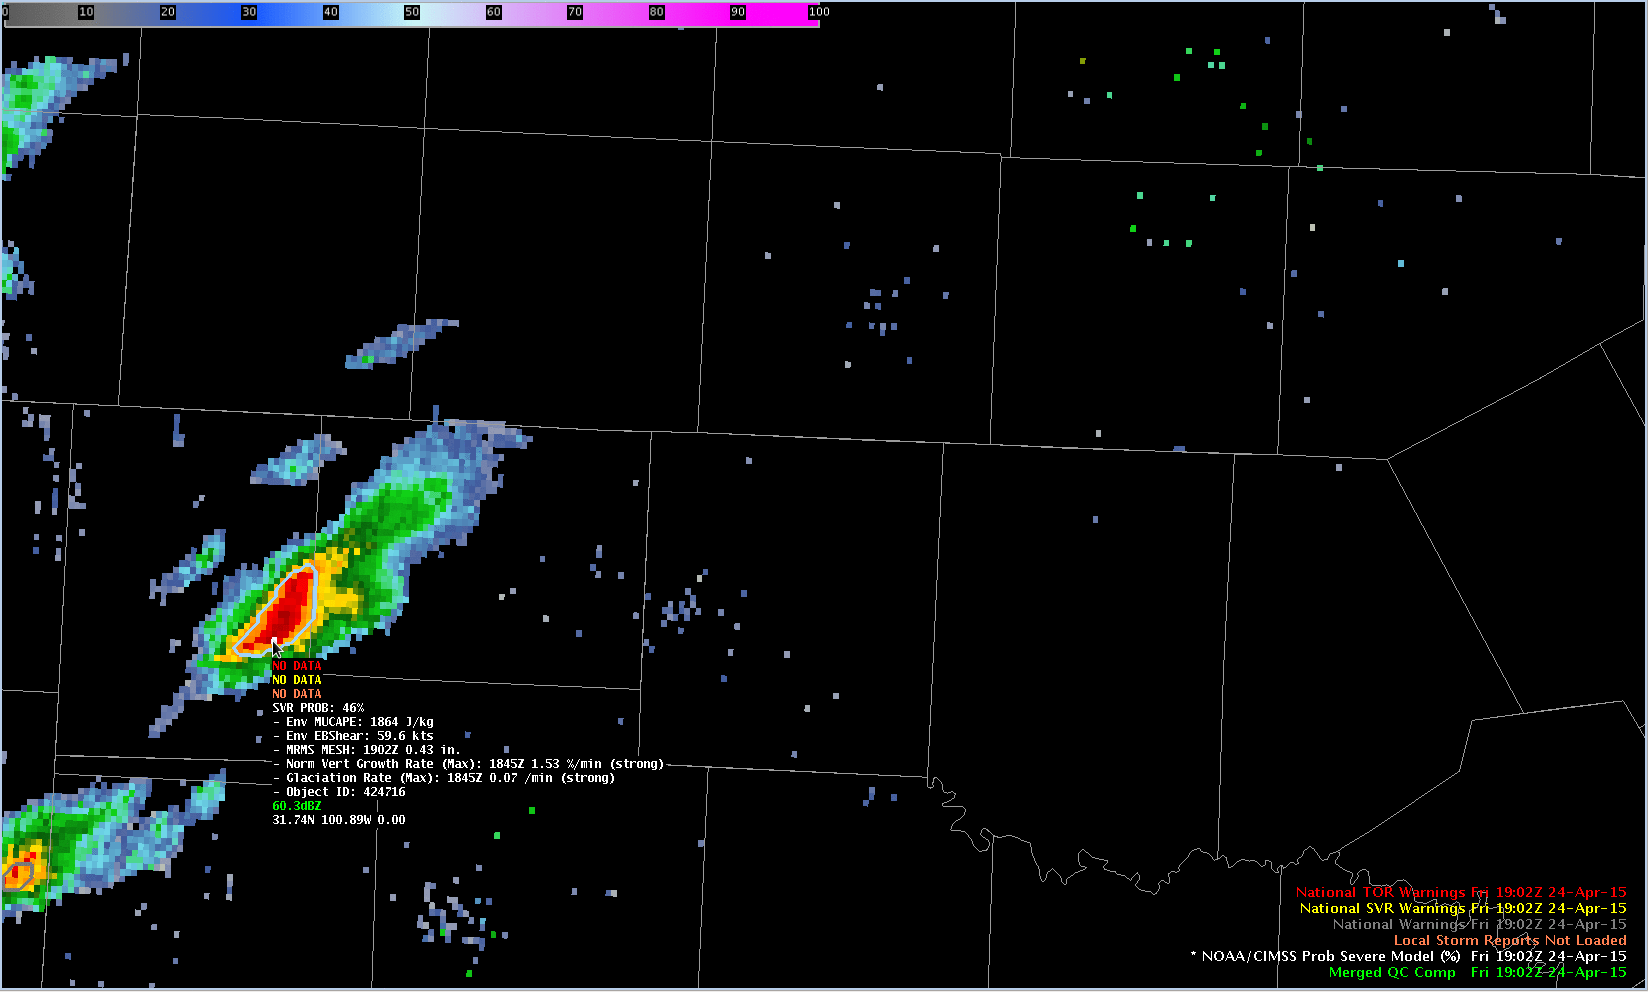
Severe thunderstorms moved across central Texas on April 24th (Link). The NOAA/CIMSS ProbSevere product can be used with storms like this to alert a forecaster to when severe weather will develop. ProbSevere output tells you the probability that a given storm cell will first produce severe weather in the next... Read More
NOAA/CIMSS ProbSevere Output from AWIPS on 24 April, 1902, 1908, 1912, 1930, 1938, 1944, 1948, 1950, 1954 and 1958 UTC (click to play animation)
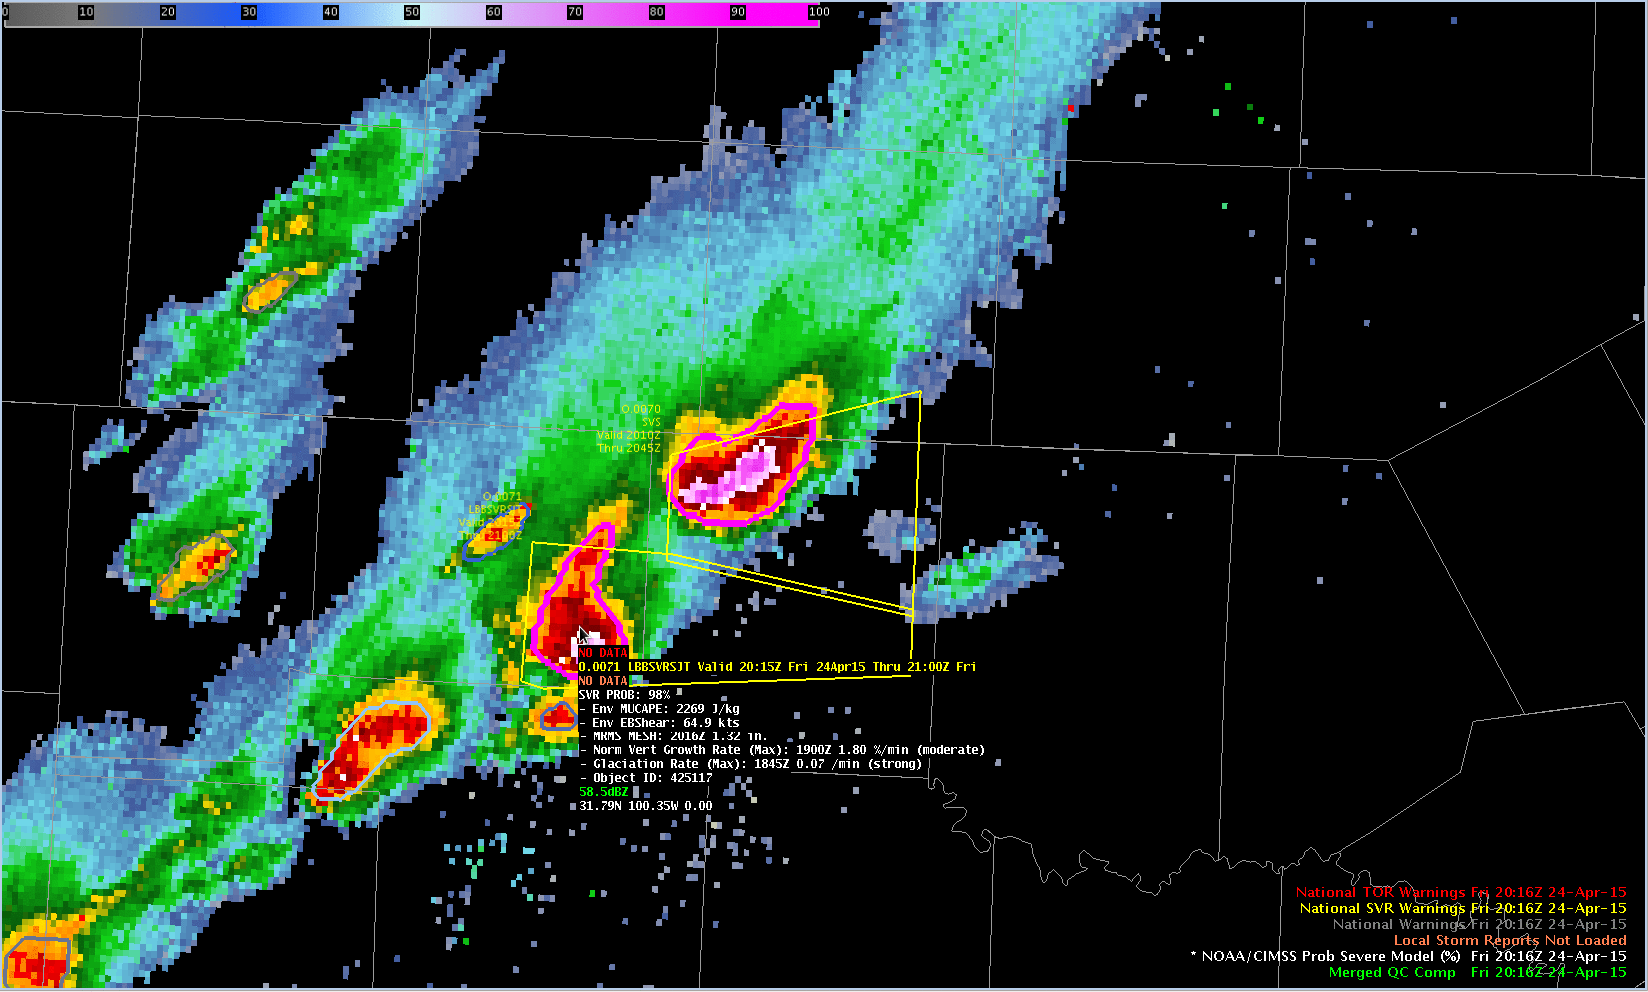
Severe thunderstorms moved across central Texas on April 24th (Link). The NOAA/CIMSS ProbSevere product can be used with storms like this to alert a forecaster to when severe weather will develop. ProbSevere output tells you the probability that a given storm cell will first produce severe weather in the next 60 minutes. (The type of severe weather — hail, high winds or tornado) are not specified by the product. In the animation, a strong thunderstorm is just entering Coke county from Sterling county to the north of Tom Green county. The list below shows ProbSevere values with the three storms shown in the animation above.
- 1902 UTC (Northern Cell) ProbSevere 46%
- 1908 UTC (Northern Cell) ProbSevere 50%
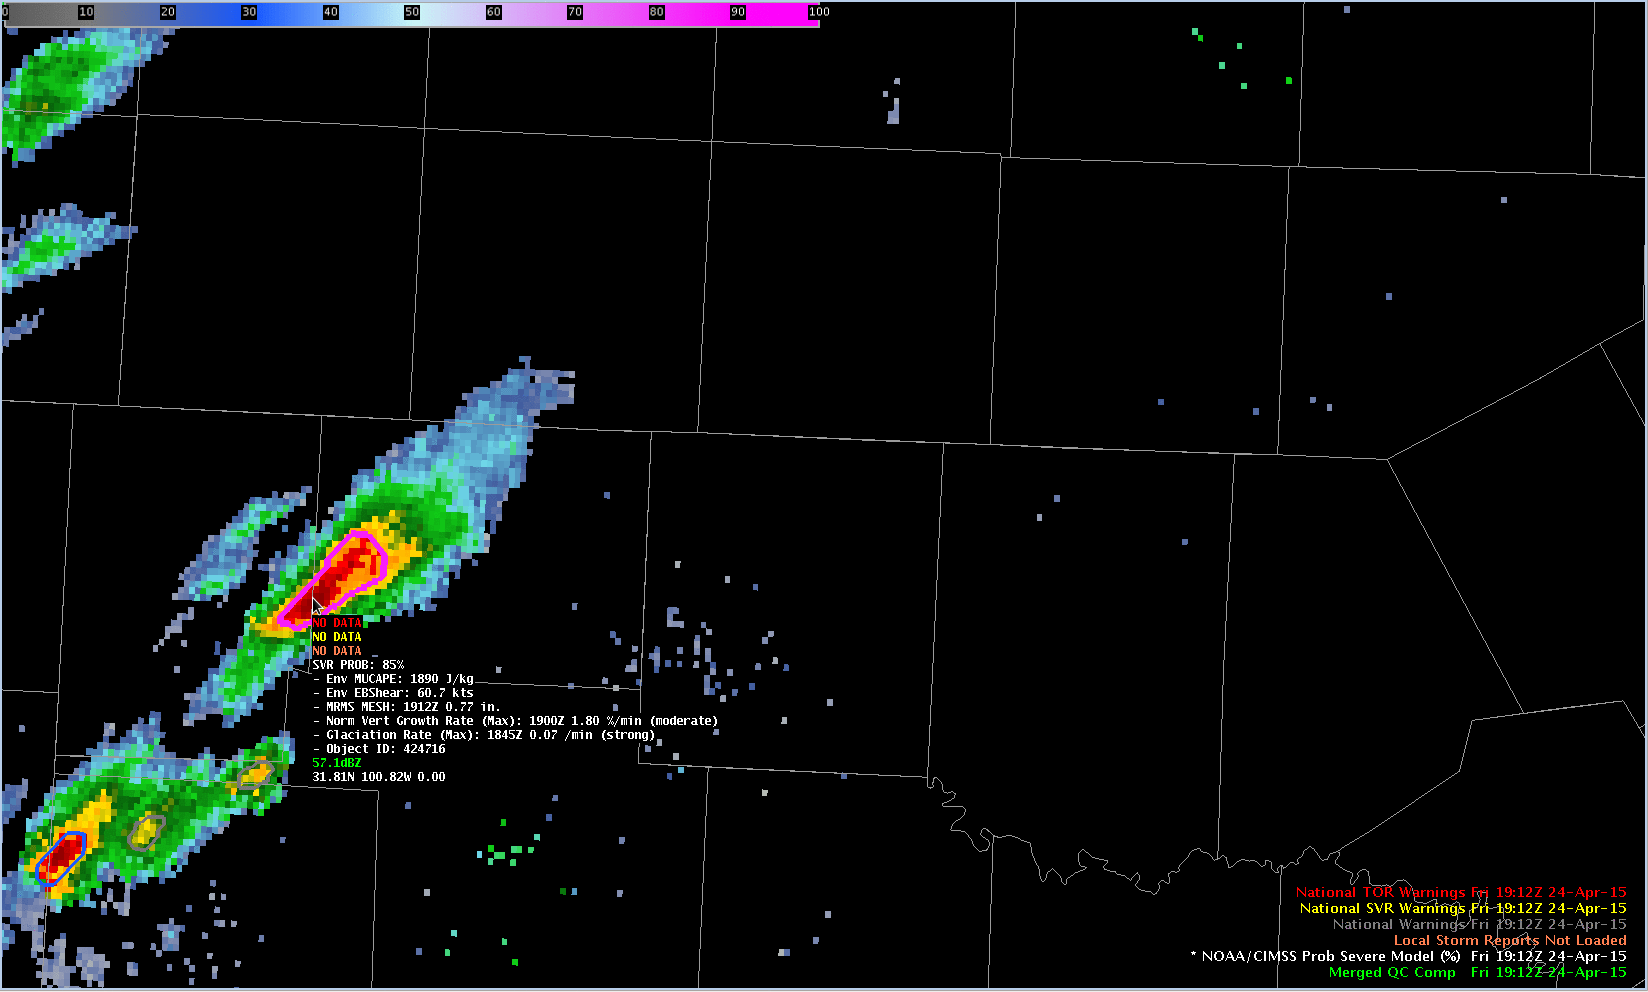
- 1912 UTC (Northern Cell) ProbSevere 85%
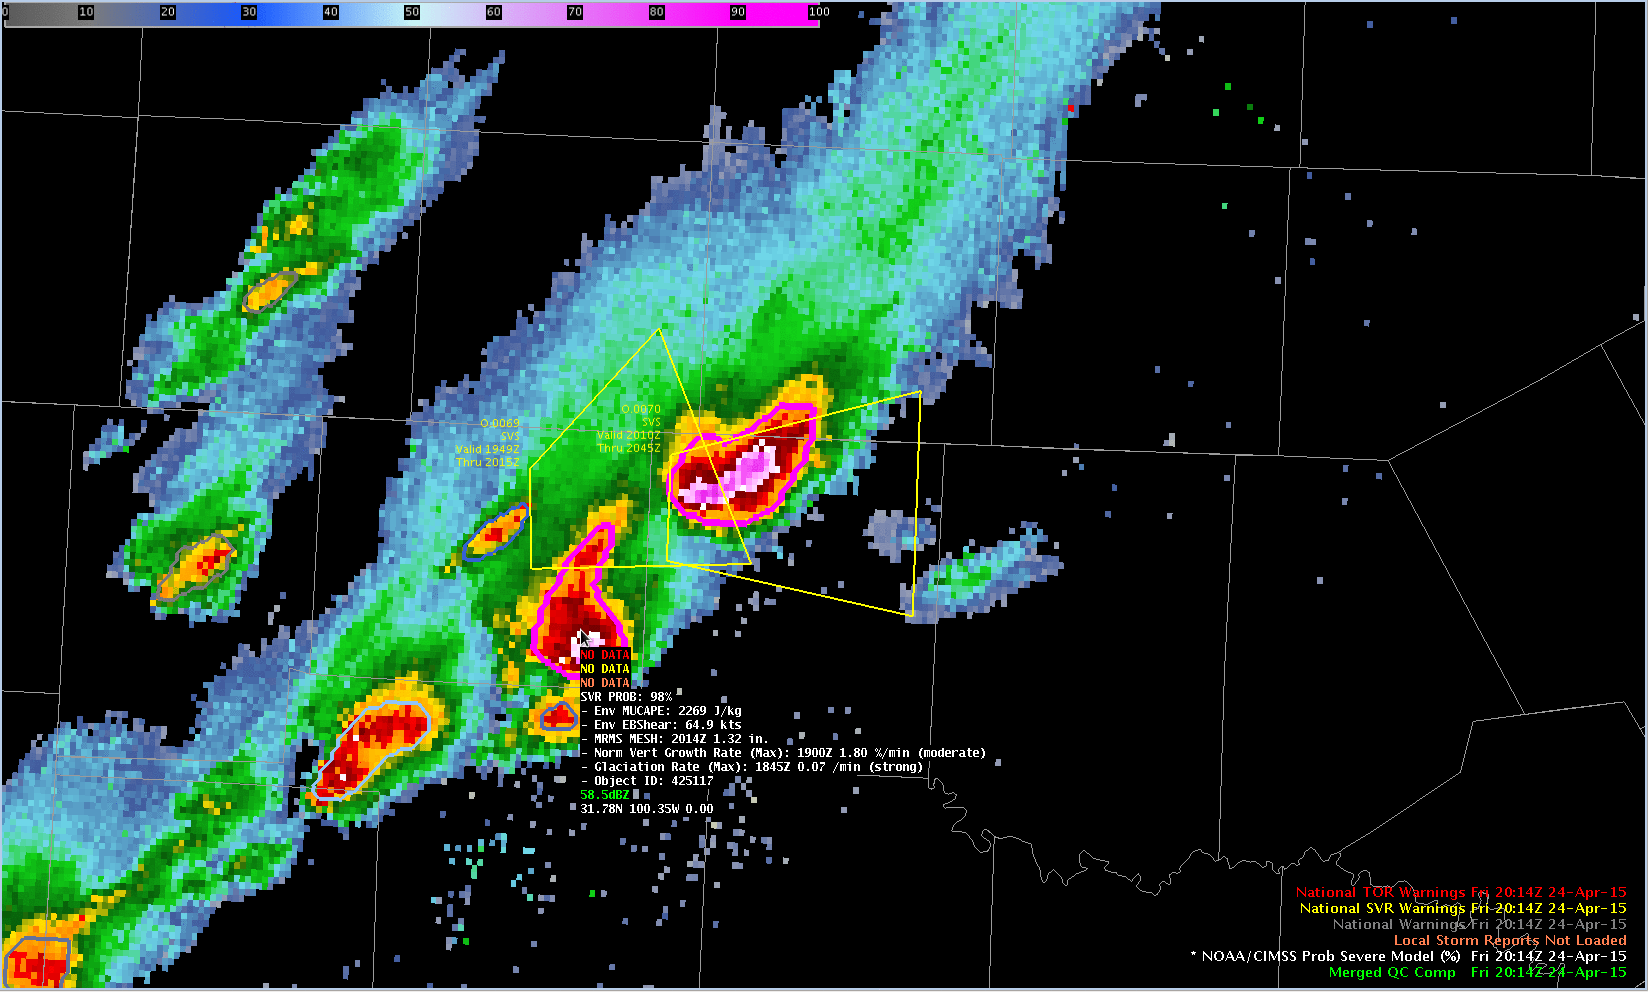
- 1930 UTC (Northern Cell) ProbSevere 95%
- 1932 UTC (Northern Cell) ProbSevere 95% (Severe Thunderstorm Warning active)
- 1948 UTC (Southern Cell) ProbSevere 23%
- 1950 UTC (Southern Cell) ProbSevere 50%
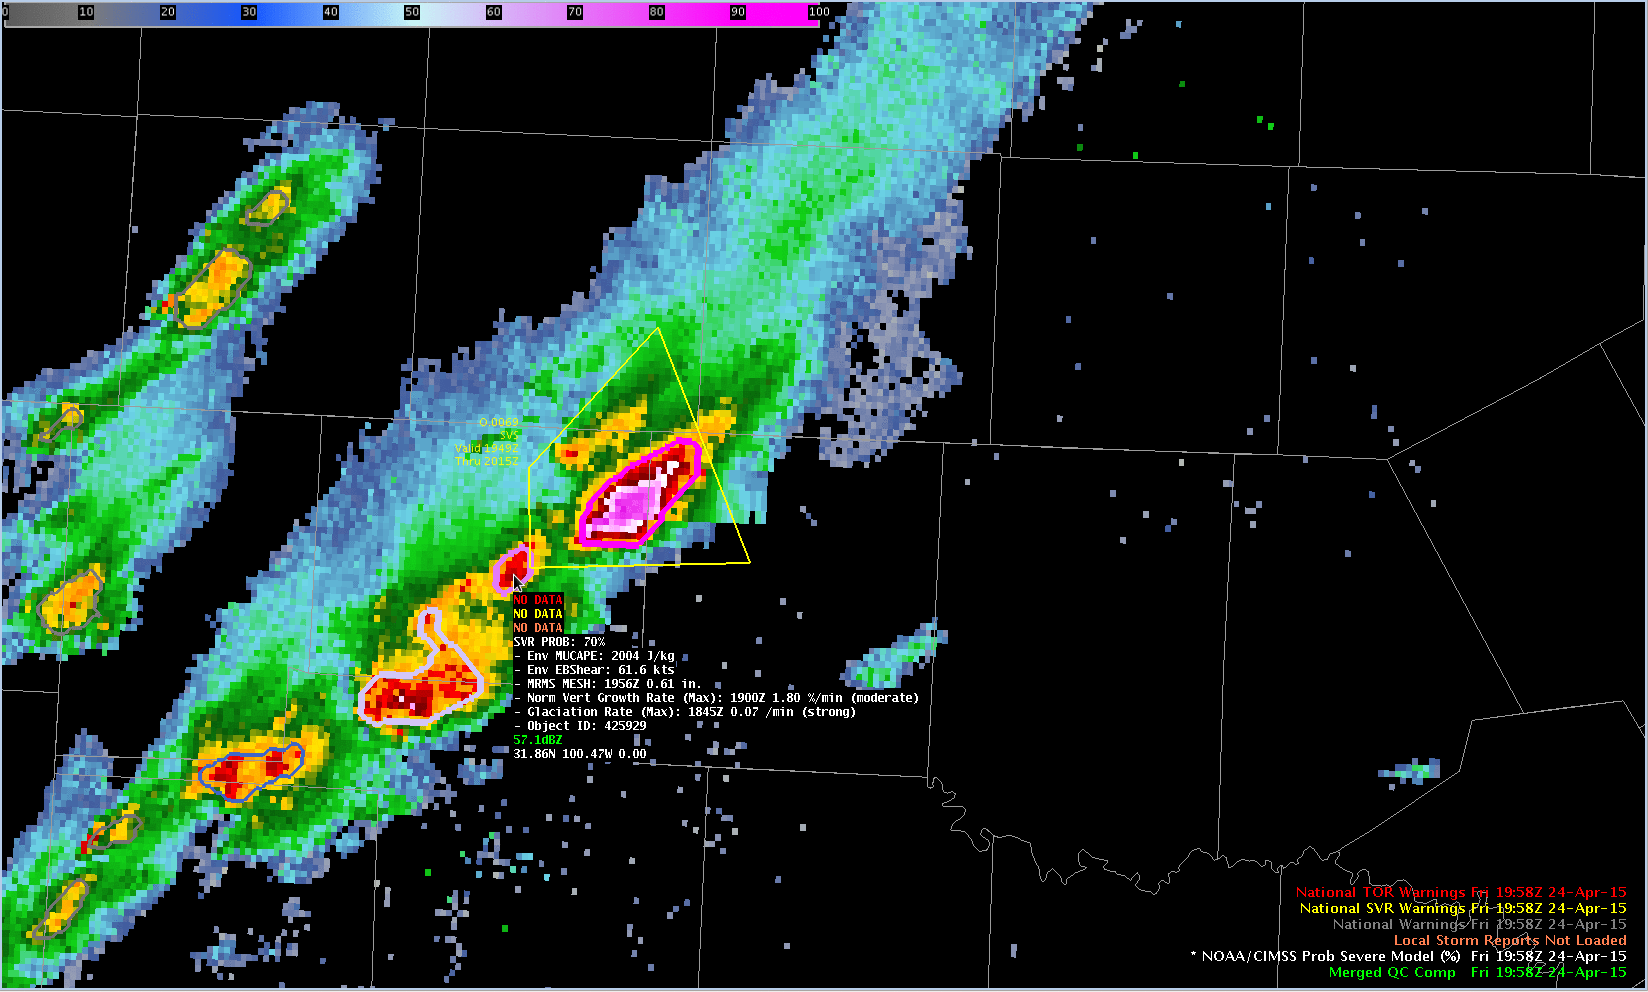
- 1954 UTC (Middle Cell) ProbSevere 57%
- 1956 UTC (Middle Cell) ProbSevere 70%
So, the northern cell crossed the 50% ProbSevere threshold at 1908 UTC, the southern cell crossed the 50% ProbSevere threshold at 1950 UTC, and the small middle cell had a >50% ProbSevere from the start, at 1954 UTC.
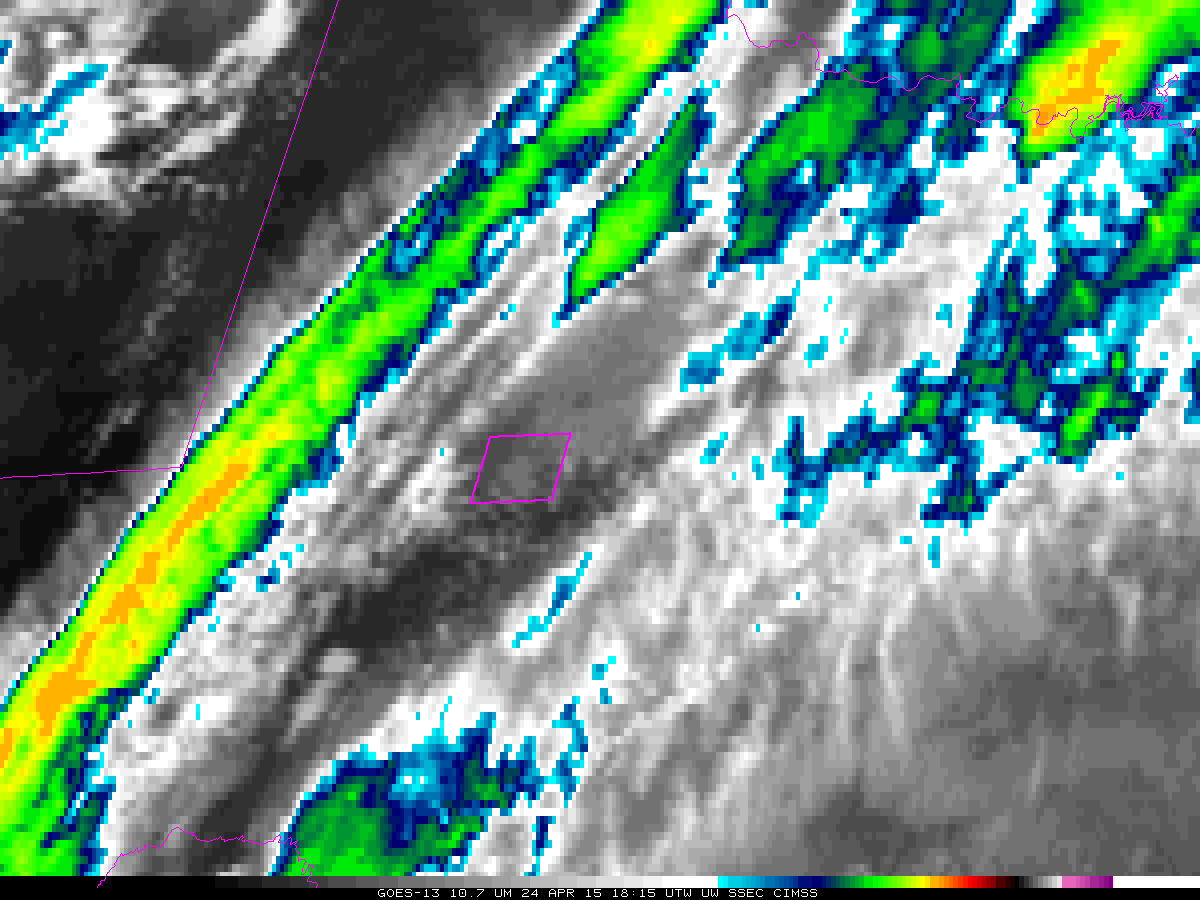
Severe hail (1.25″ in diameter) was reported at 1928 UTC (20 minutes after ProbSevere crossed the 50% threshold) 8 miles west (31.89 N, 100.62 W)of Robert Lee, TX (the county seat of Coke County). At 1957 UTC, 1.75″ Hail was reported four miles north (31.94 N, 100.30 W) of Bronte, TX (also in Coke County).
The middle cell in the animation above eventually merged with the southern cell, and intensified. The animation from 1958 through 2014 UTC is below. ProbSevere with the middle storm (that merges with the southern cell) is 70%, rising to 98% at 2014 UTC.

NOAA/CIMSS ProbSevere Output from AWIPS on 24 April, 1958, 2000, 2008, 2010, 2012, 2014 UTC (click to play animation)
At 2015 UTC, the National Weather Service issued a Severe Thunderstorm Warning. At this time, 2.75″ Hail was falling five miles northwest of Tennyson in Coke County. (31.79N, 100.35W). The 2016 UTC ProbSevere output is here.
The ProbSevere product is something that distills many bytes of information: model output that describes the environmental conditions, satellite data that describes the initial growth of convection, and MRMS radar data that captures the present state of a storm. The distilled data can be used to increase the confidence that a severe event will occur within the next 60 minutes.
An animation of the 10.7 µm imagery from 1800 through 2015 UTC is shown below. The locations of the severe hail reports noted above are included on the relevant images.
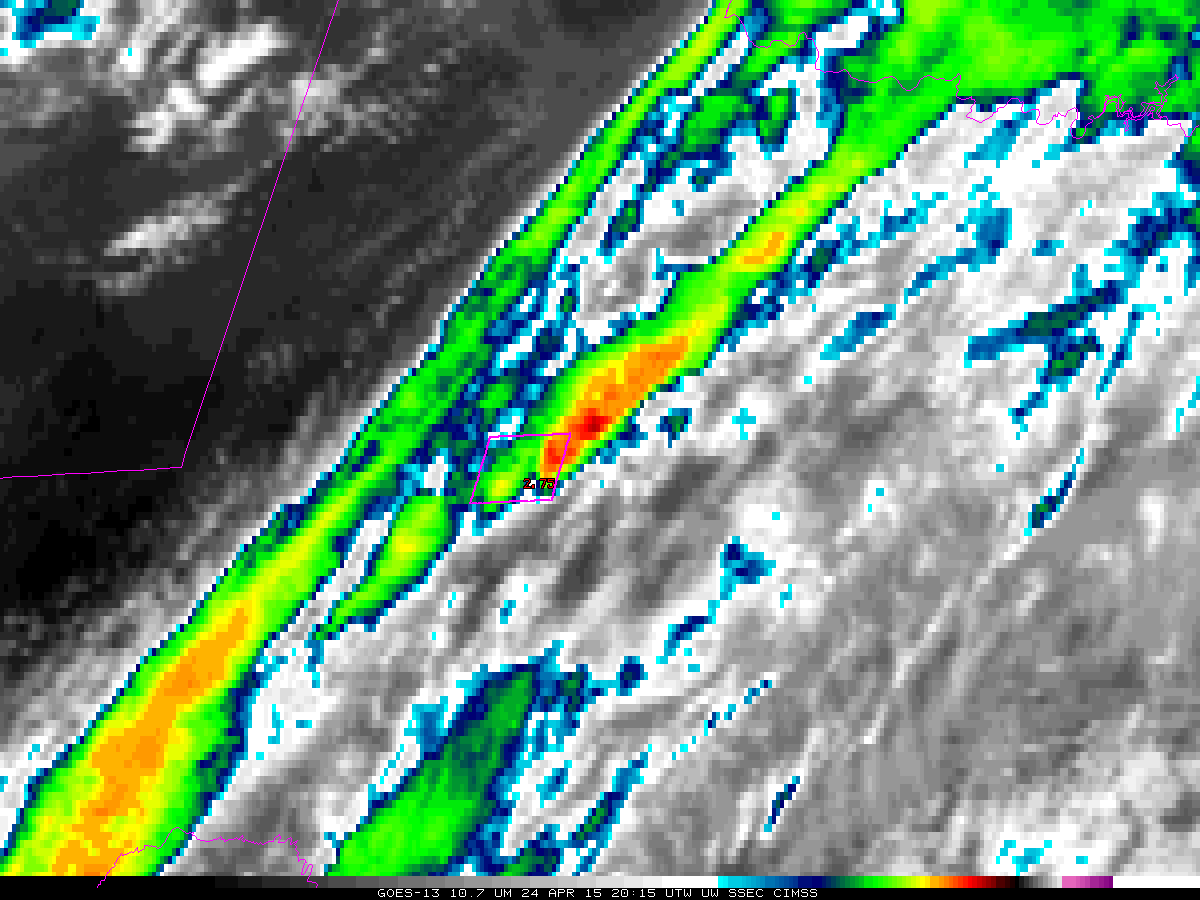
GOES-13 10.7 Brightness Temperature 1800-2015 UTC on 24 April 2015; Coke County is highlighted (click to play animation)
View only this post
Read Less


