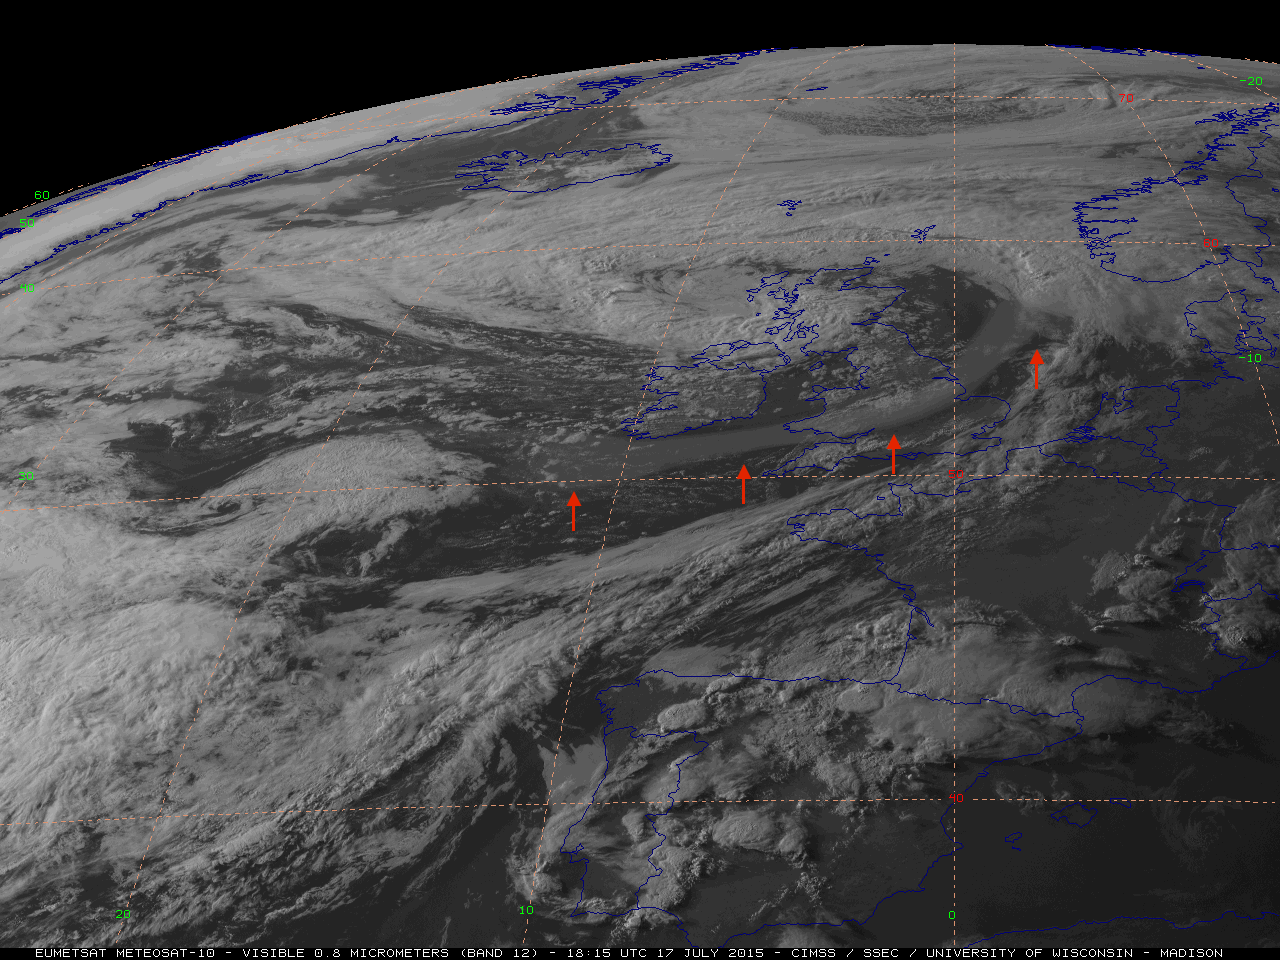
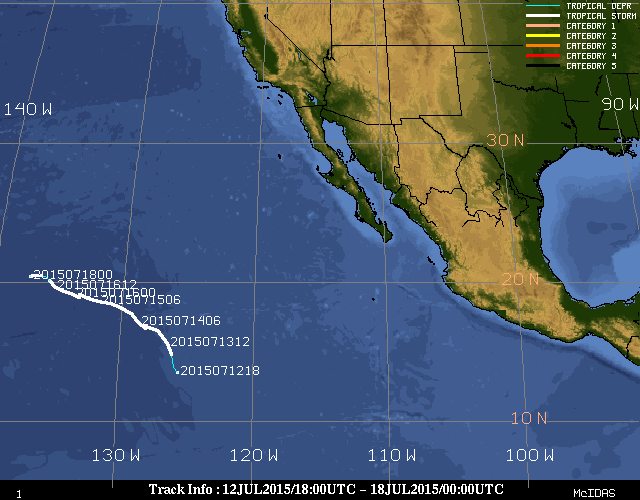
EUMETSAT Meteosat-10 High Resolution Visible (0.8 µm) images (above; click to play animation; also available as an MP4 movie file) revealed the hazy signature of what appeared to be a ribbon of smoke aloft being transported eastward across the North Atlantic Ocean by the circulation of a large area of low pressure... Read More
![Meteosat-10 0.8 µm visible channel images [click to play animation]](http://pyrocb.ssec.wisc.edu/wp-content/uploads/2015/07/A_150717_MET10_VISIBLE_ATLANTIC_SMOKE_PLUME_51.gif)
Meteosat-10 0.8 µm visible channel images [click to play animation]
Meteosat-10 High Resolution Visible (0.8 µm) images
(above; click to play animation; also available as an MP4 movie file) revealed the hazy signature of what appeared to be a ribbon of smoke aloft being transported eastward across the North Atlantic Ocean by the circulation of a large area of low pressure (
surface |
500 hPa) on 17 July 2015. Early in the day, the smoke feature stretched from the east coast of Greenland to the central Atlantic Ocean; by the end of the day, the leading edge of the smoke had moved over the British Isles and was headed toward Scandinavia.
A portion of the smoke plume could be seen on Aqua MODIS and Suomi NPP VIIRS true-color Red/Green/Blue (RGB) images (below) as it was approaching the southern portion of Great Britain.
![Aqua MODIS and Suomi NPP VIIRS true-color images [click to enlarge]](http://pyrocb.ssec.wisc.edu/wp-content/uploads/2015/07/150717_aqua_modis_suomi_npp_viirs_truecolor_Atlantic_smoke_plume_anim.gif)
Aqua MODIS and Suomi NPP VIIRS true-color images [click to enlarge]
On the following morning, Meteosat-10 visible images
(below; click to play animation) showed that the leading edge of the smoke ribbon was moving over southern Norway.
![Meteosat-10 0.8 µm visible channel images [click to play animation]](http://pyrocb.ssec.wisc.edu/wp-content/uploads/2015/07/A_150718_MET10_VISIBLE_ATLANTIC_SMOKE_PLUME_02.gif)
Meteosat-10 0.8 µm visible channel images [click to play animation]
The transport pathway of this smoke feature was rather interesting, as we shall explore with the following sets of images.
![Suomi NPP VIIIRS 3.74 µm shortwave IR and 0.64 µm visible images on 06 July [click to enlarge]](http://pyrocb.ssec.wisc.edu/wp-content/uploads/2015/07/150706_2131-2312utc_suomi_npp_viirs_swir_visible_AK_fires_anim.gif)
Suomi NPP VIIIRS 3.74 µm shortwave IR and 0.64 µm visible images on 06 July [click to enlarge]
The 2015 wildfire season in Alaska had been very active — as of 17 July, it was rated as the 4th worst in terms of total acreage burned. In early July, numerous wildfires burning across the interior of Alaska were producing a large amount of smoke, as can be seen in a comparison of of Suomi NPP VIIRS 3.74 µm shortwave IR and 0.64 µm visible channel images at 2131 and 2312 UTC on 06 July
(above). The thermal signature of the wildfire “hot spots” showed up as yellow to red to black pixels on the 2 shortwave IR images, while the widespread smoke plumes from the fires are evident on the 2 visible images; even in the relatively short 101 minutes separating the two sets of VIIRS images, notable changes in fire activity could be seen.
Looking a bit farther to the north and west, a sequence of VIIRS 0.64 µm visible images centered over Cape Lisburne (station identifier PALU) in northwestern Alaska covering a 2-day period from 06 to 08 July (below) showed the initial transport of large amounts of smoke from the interior of Alaska northwestward over the Chukchi Sea between Alaska and Russia.
![Suomi NPP VIIRS 0.64 µm visible channel images covering the 06-08 July period [click to enlarge]](http://pyrocb.ssec.wisc.edu/wp-content/uploads/2015/07/150706-08_suomi_npp_viirs_visible_Alaskan_smoke_anim.gif)
Suomi NPP VIIRS 0.64 µm visible channel images covering the 06-08 July period [click to enlarge]
Daily composites of Suomi NPP
OMPS Aerosol Index covering the period of 04-17 July
(below; courtesy of Colin Seftor; see his OMPS Blog post) showed the strong signal of this dense Alaskan smoke
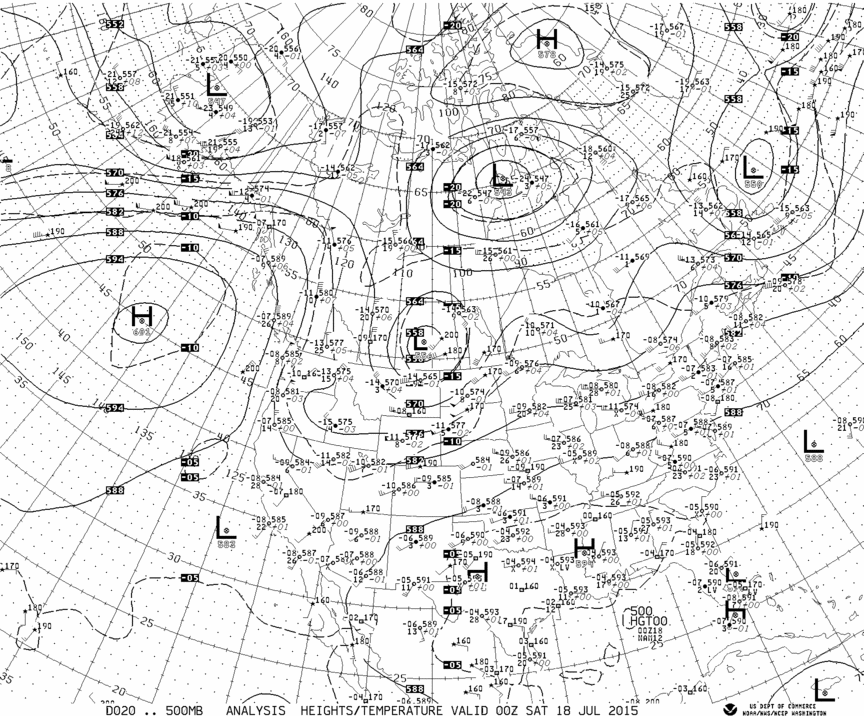
(denoted by the red arrows) as it moved from east to west over the far southern Arctic Ocean and along the far northern coast of Russia from 06-10 July. The Aerosol Index signal seemed to stall north of Scandinavia on 12-13 July, but then a small portion began to move toward Iceland and Greenland on 13-15 July around the periphery of a large upper-level low (
500 hPa analyses). Finally, some of this smoke was then transported eastward across the Atlantic Ocean around the southern periphery of this upper-level low on 17 July, as was seen on the Meteosat-10 visible images at the beginning of this blog post.
![Suomi NPP OMPS Aerosol Index images, covering the period 04-17 July [click to enlarge]](http://pyrocb.ssec.wisc.edu/wp-content/uploads/2015/07/150704-17_suomi_npp_omps_AI_anim.gif)
Suomi NPP OMPS Aerosol Index images, covering the period 04-17 July [click to enlarge]
CALIOP lidar data from the CALIPSO satellite
(below) showed the vertical distribution of the Alaskan smoke over and off the coast of northern Norway on
11 July. The signal of the smoke was located in the center portion of the images; while there appeared to be some smoke at various altitudes within the middle to upper troposphere, a significant amount of smoke was seen in the lower stratosphere in the 10-12 km altitude range.
![CALIPSO CALIOP lidar data showing the smoke over northern Norway on 11 July [click to enlarge]](http://pyrocb.ssec.wisc.edu/wp-content/uploads/2015/07/150711_calipso_caliop_Alaska_smoke_anim.gif)
CALIPSO CALIOP lidar data showing the smoke over northern Norway on 11 July [click to enlarge]
View only this post
Read Less
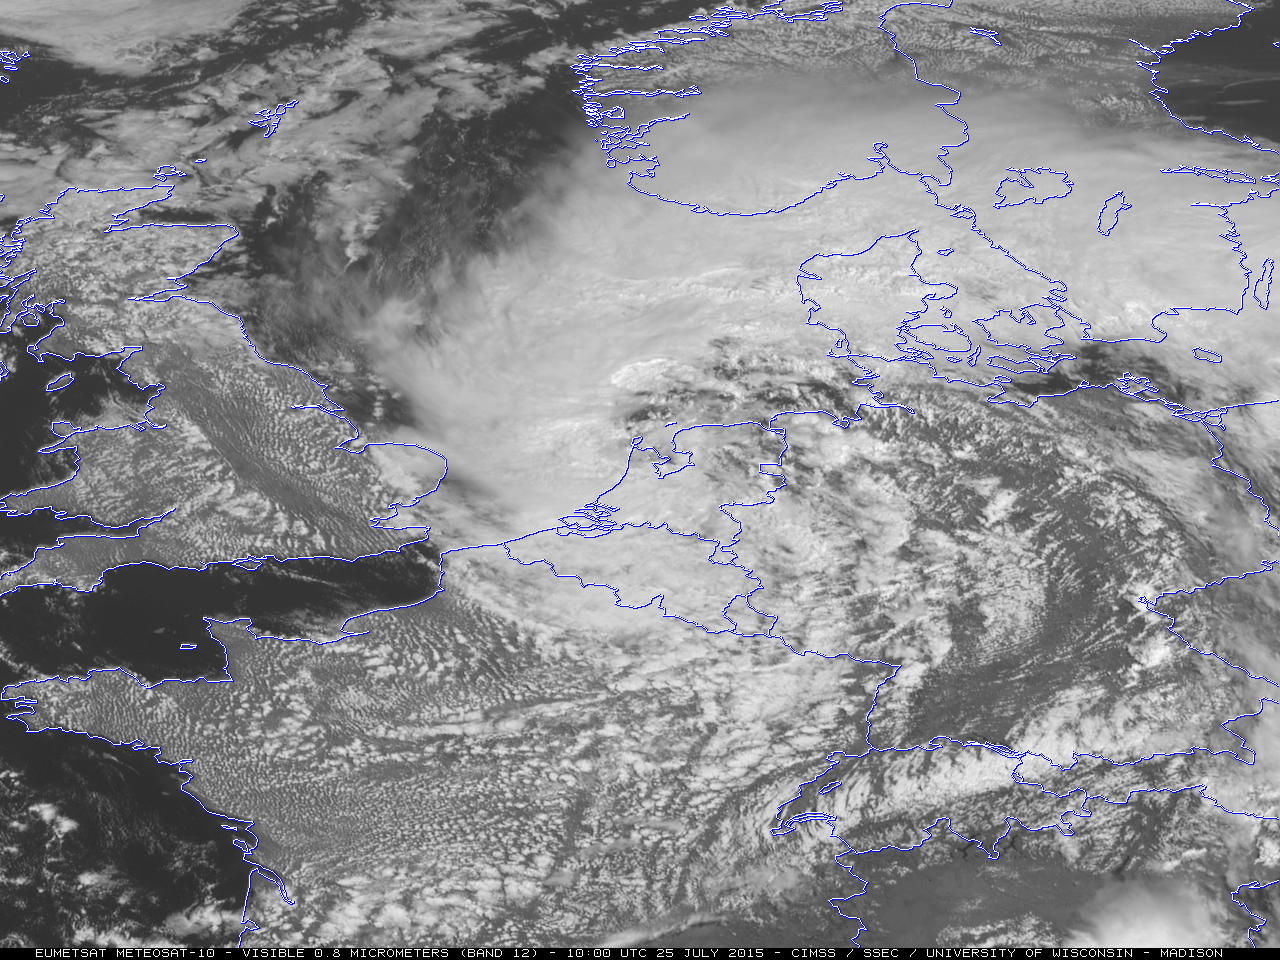
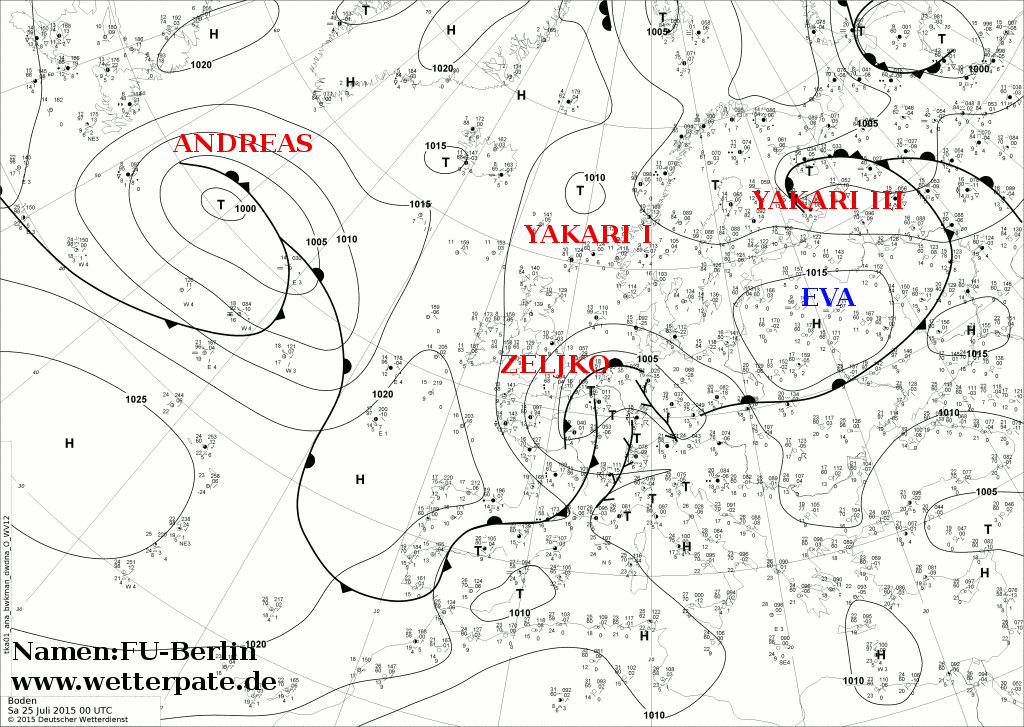
![Meteosat-10 6.25 µm water vapor channel images [click to play animation]](https://cimss.ssec.wisc.edu/satellite-blog/wp-content/uploads/sites/5/2015/07/150725_meteosat10_water_vapor_Storm_Zeljko_anim.gif)
![Meteosat-10 0.8 µm visible channel images [click to play animation]](https://cimss.ssec.wisc.edu/satellite-blog/wp-content/uploads/sites/5/2015/07/150725_meteosat10_visible_Storm_Zeljko_anim.gif)
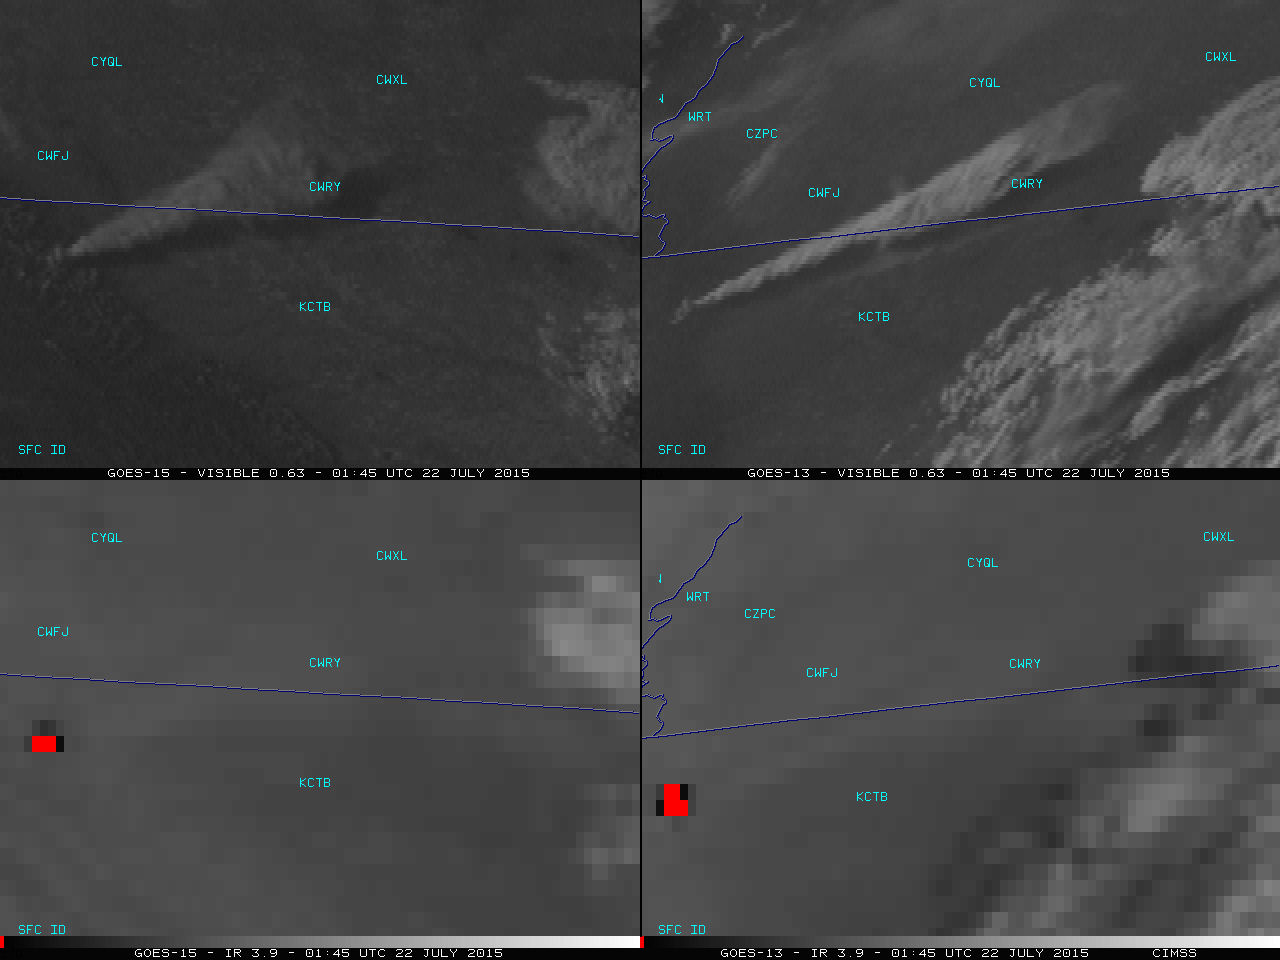
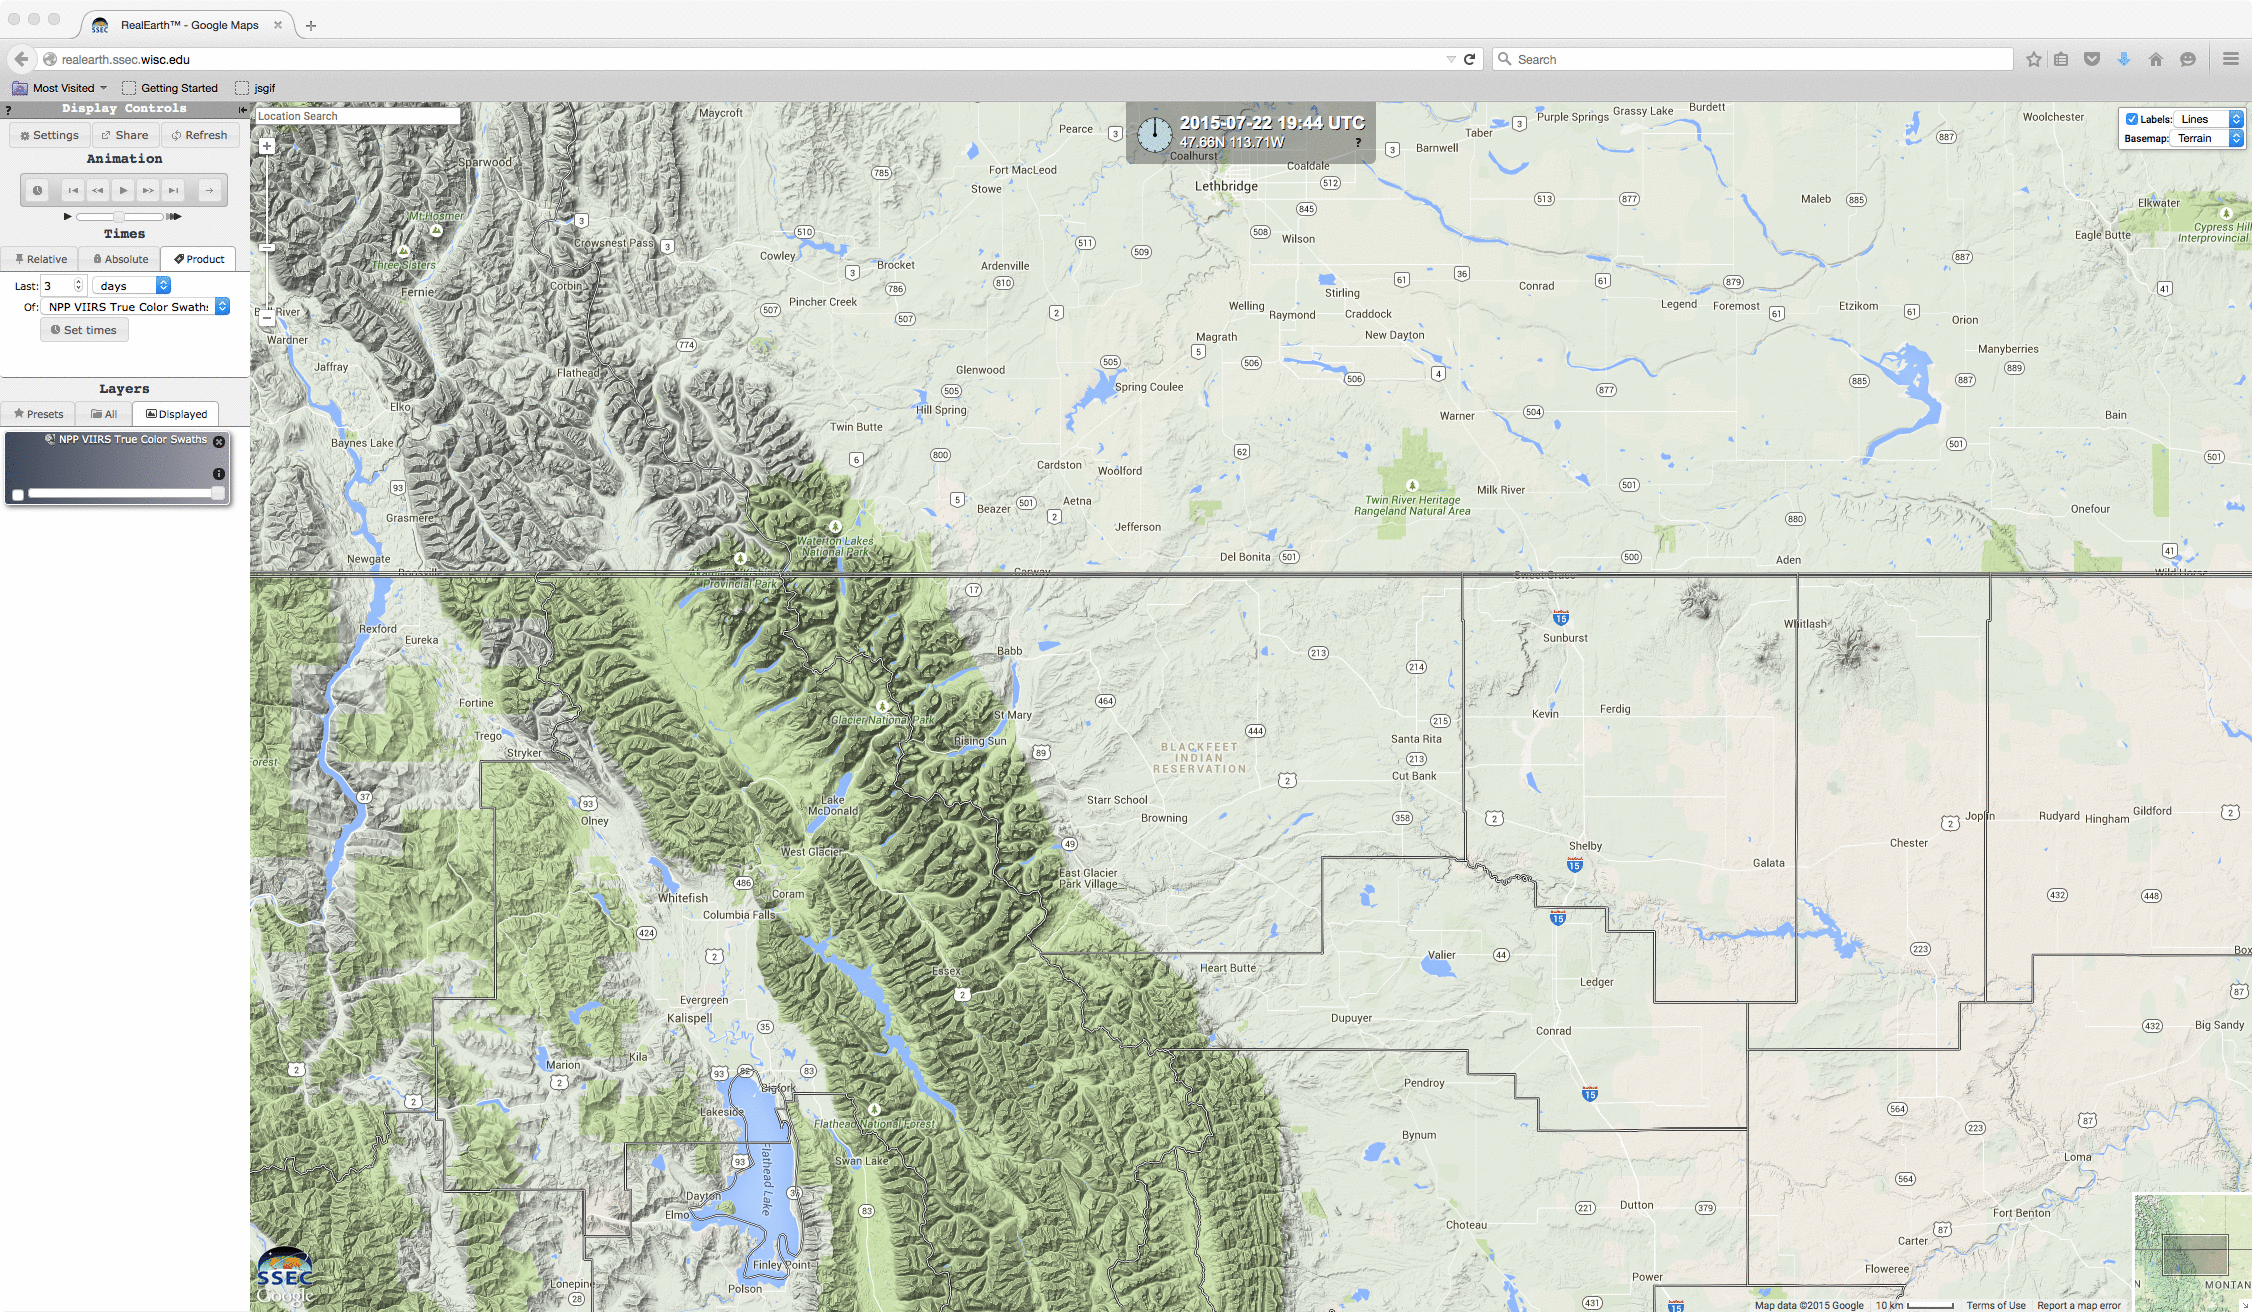
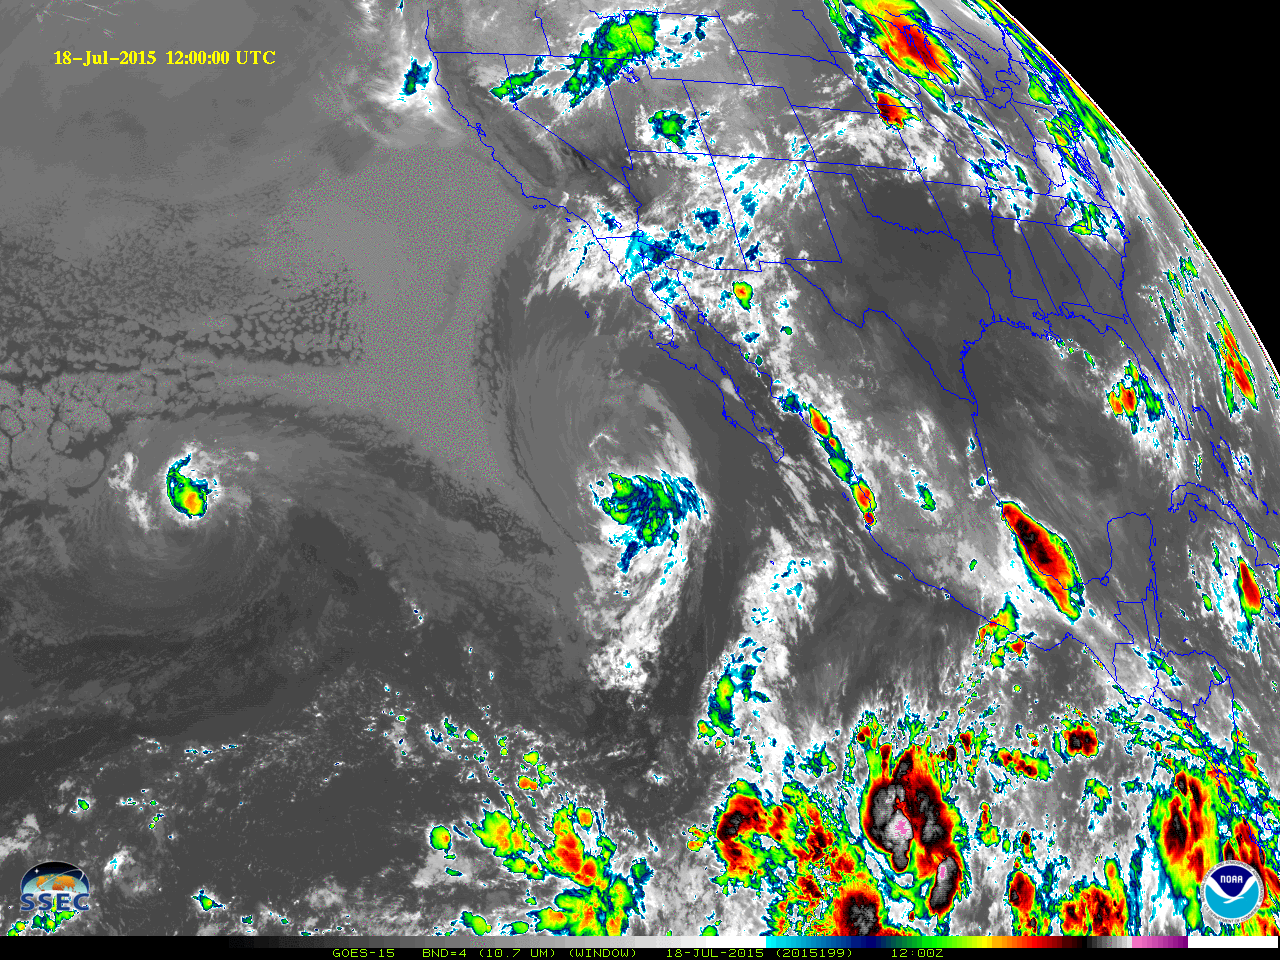
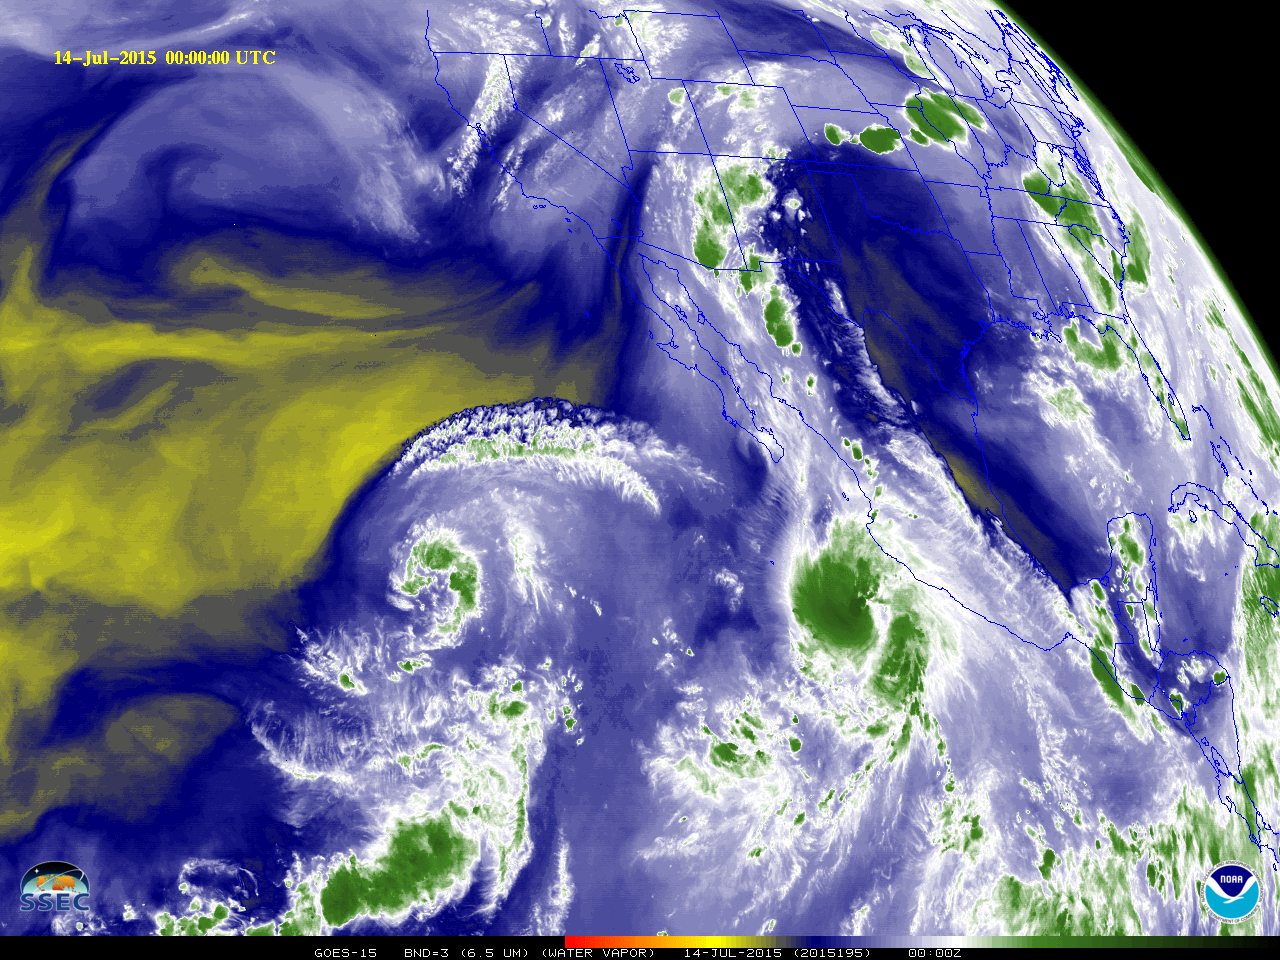
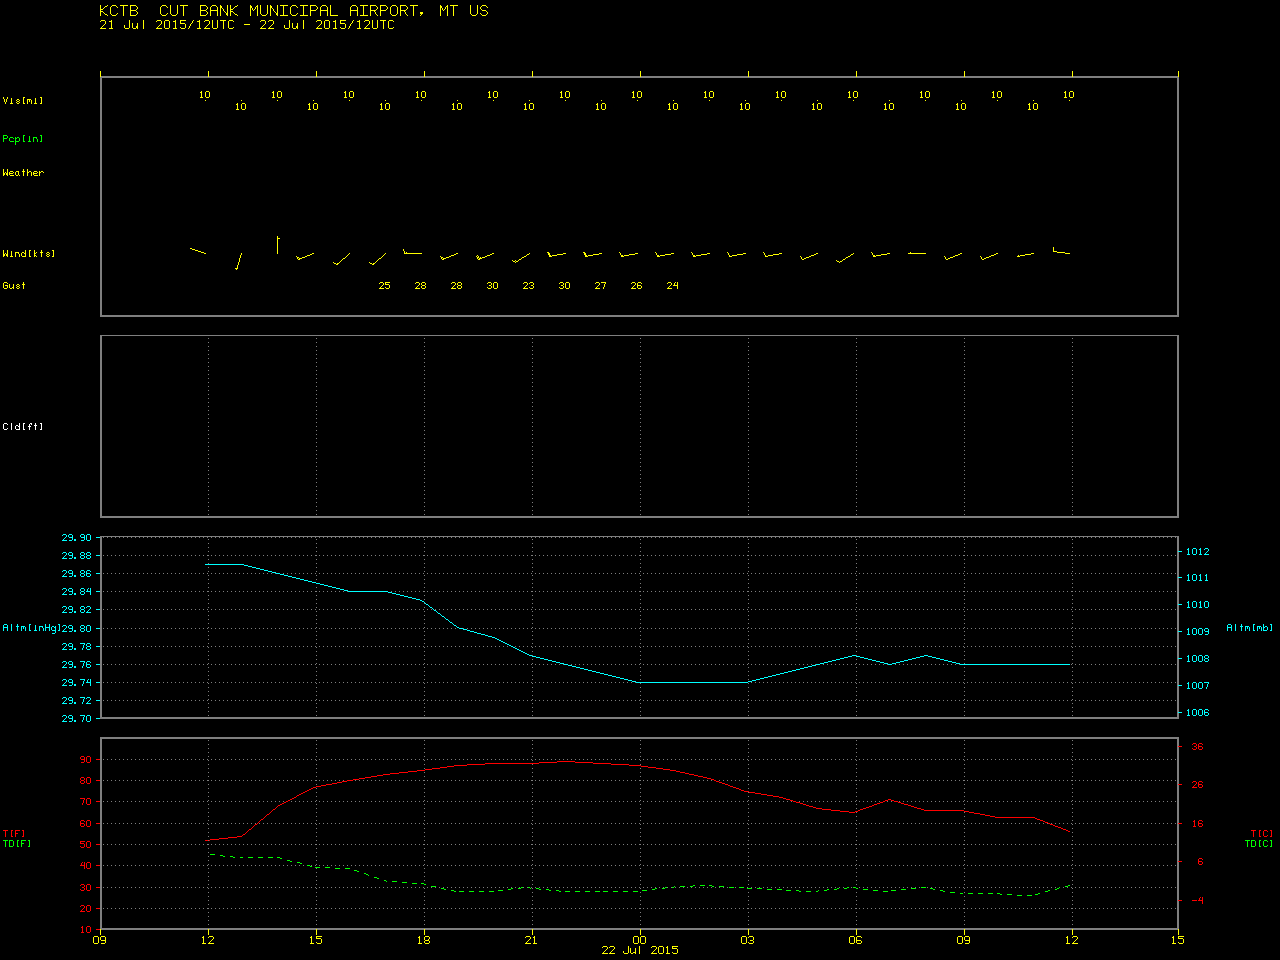
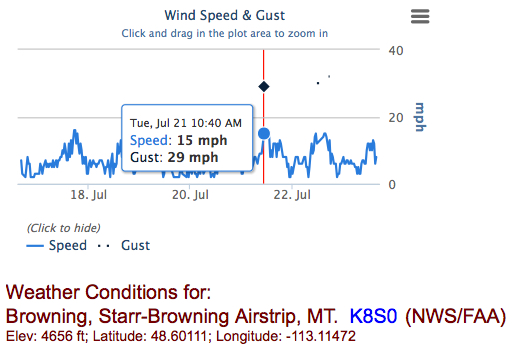
![GOES-15 (left) and GOES-13 (right) visible and shorwave IR images [click to play animation]](https://cimss.ssec.wisc.edu/satellite-blog/wp-content/uploads/sites/5/2015/07/150721_goes15_goes13_visible_swir_Glacier_National_Park_MT_fire_anim.gif)
![GOES-15 visible channel images [click to play animation]](https://cimss.ssec.wisc.edu/satellite-blog/wp-content/uploads/sites/5/2015/07/800x1000_AGOES15_B1_MT_FIRES_animated_2015202_183000_184_2015203_030000_184_GRAY.gif)
![Suomi NPP VIIRS shortwave IR and Day/Night Band images [click to enlarge]](https://cimss.ssec.wisc.edu/satellite-blog/wp-content/uploads/sites/5/2015/07/150722_0958utc_suomi_npp_viirs_swir_dnb_MT_fire_anim.gif)
![Suomi NPP VIIRS 3.74 µm shortwave IR images [click to enlarge]](https://cimss.ssec.wisc.edu/satellite-blog/wp-content/uploads/sites/5/2015/07/150722_2122utc_suomi_npp_viirs_swir_Glacier_National_Park_fire_anim.gif)
![Suomi NPP VIIRS 3.74 µm shortwave IR and true-color RGB images [click to enlarge]](https://cimss.ssec.wisc.edu/satellite-blog/wp-content/uploads/sites/5/2015/07/150723_suomi_npp_viirs_swir_truecolor_MT_fire_anim.gif)
![Meteosat-10 0.8 µm visible channel images [click to play animation]](http://pyrocb.ssec.wisc.edu/wp-content/uploads/2015/07/150717_meteosat10_visible_Atlantic_smoke_plume_anim.gif)
![Meteosat-10 0.8 µm visible channel images [click to play animation]](http://pyrocb.ssec.wisc.edu/wp-content/uploads/2015/07/150718_meteosat10_visible_Atlantic_smoke_plume_anim.gif)
