![MIMIC Total Precipitable Water [click to play animation]](https://cimss.ssec.wisc.edu/satellite-blog/wp-content/uploads/sites/5/2015/08/MIMIC_TPW_20150804anim.gif)
MIMIC Total Precipitable Water [click to play animation]
After a July with rainfall that was significantly above normal (Link), Tampa experienced heavy rain on both August 1st and August 3rd, leading to flooding conditions. The animation of Total Precipitable Water, above, from 2-4 August, shows the moisture-rich environment in which the showers and thunderstorms developed. Tampa appears to be in a corridor of moisture transport between tropical easterlies over the Atlantic and more westerly motion in advance of a surface trough that had sagged into the northern Gulf of Mexico. As a result of the rains (3.89″ on 1 August and 4.39″ on 3 August), Flood Warnings and Flood Watches persist on 4 August, and River Gauges (Source: http://water.weather.gov/ahps/index.php) continue to show conditions above flood stage (below).
![River Gauge Observations (Left) and National Weather Service (Tampa Bay) County Warning Area warnings (right) [click to enlarge]](https://cimss.ssec.wisc.edu/satellite-blog/wp-content/uploads/sites/5/2015/08/TampaFlood.gif)
River Gauge Observations (Left) and National Weather Service (Tampa Bay) County Warning Area warnings (right) [click to enlarge]
GOES-13 Imagery, below, captured the evolution of the heavy rains on 1 August (Loop available here as mp4). These rains fell mostly during the day, and satellite data suggests training convection (that is, repeated development of thunderstorms over one region) produced the rain.
![GOES-13 10.7 µm infrared imagery [click to play animation]](https://cimss.ssec.wisc.edu/satellite-blog/wp-content/uploads/sites/5/2015/08/960x1280_AGOES13_B4_TAMPA1_IR4_animated_2015213_114500_180_2015213_234500_180_IR4AVHRR4.gif)
GOES-13 10.7 µm infrared imagery [click to play animation]
![GOES-13 0.63 µm visible imagery [click to play animation]](https://cimss.ssec.wisc.edu/satellite-blog/wp-content/uploads/sites/5/2015/08/960x1280_AGOES13_B1_TAMPA2_VIS_animated_2015213_111500_180_2015213_234500_180_GRAY.gif)
GOES-13 0.63 µm visible imagery [click to play animation]
Visible imagery (Click here for mp4) during the day on 1 August (above) confirm the training nature of the convection over Tampa.
In contrast, the heavy rains early on 3 August were associated with a strong mesoscale convective system (loop shown below, or available here as mp4) that developed over the northeast Gulf of Mexico and then sagged southward over Tampa.
![GOES-13 10.7 µm infrared imagery [click to play animation]](https://cimss.ssec.wisc.edu/satellite-blog/wp-content/uploads/sites/5/2015/08/960x1280_AGOES13_B4_TAMPA2_IR4_animated_2015215_054500_180_2015215_190000_180_IR4AVHRR4.gif)
GOES-13 10.7 µm infrared imagery [click to play animation]
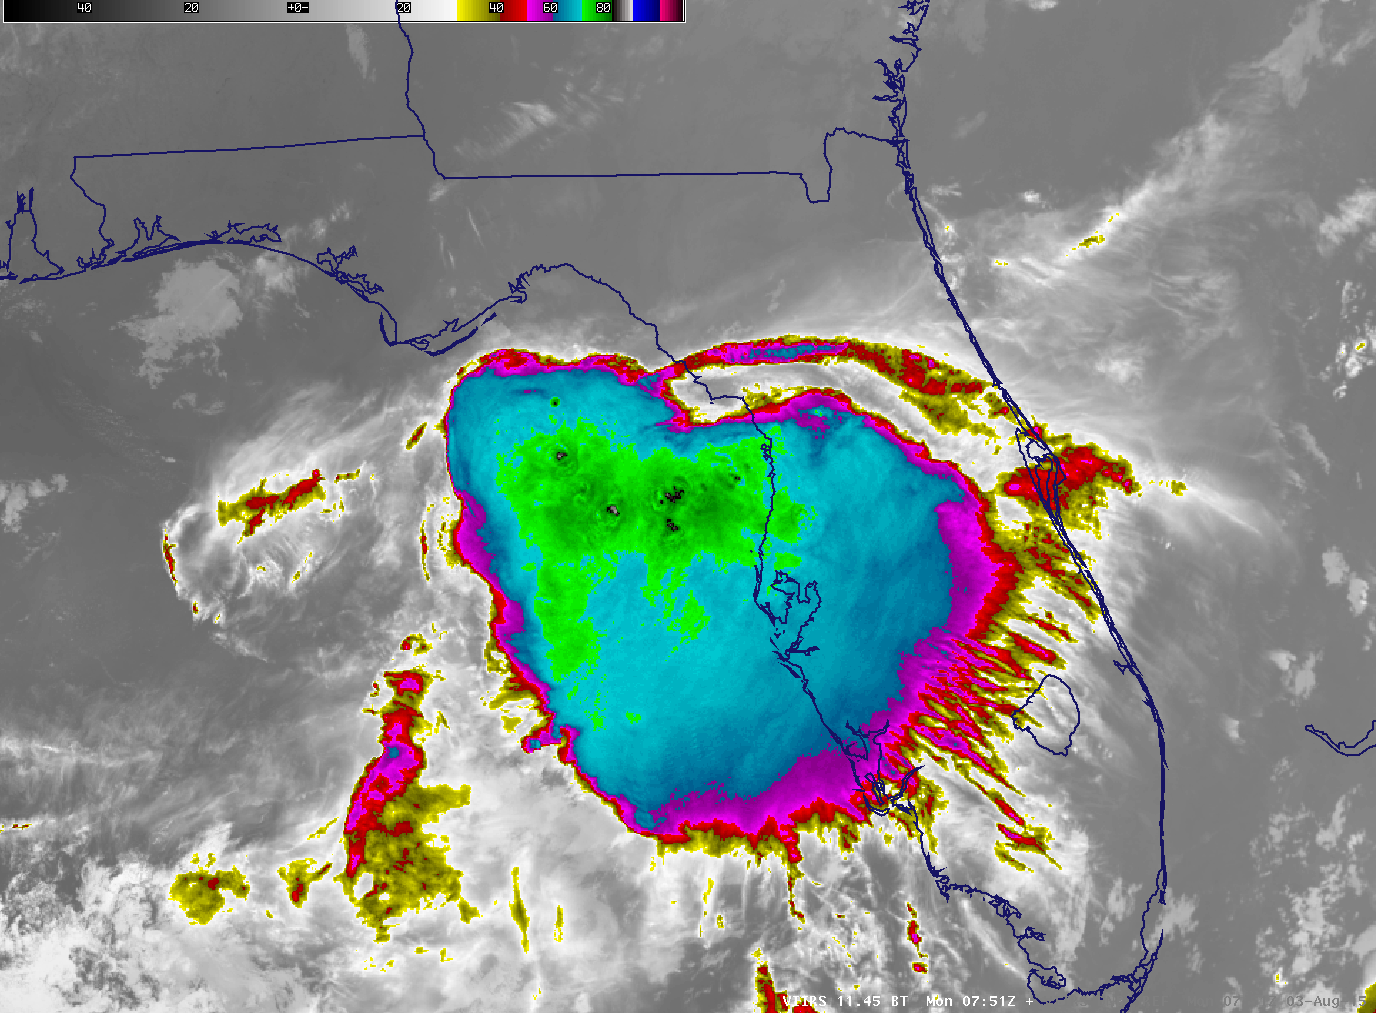
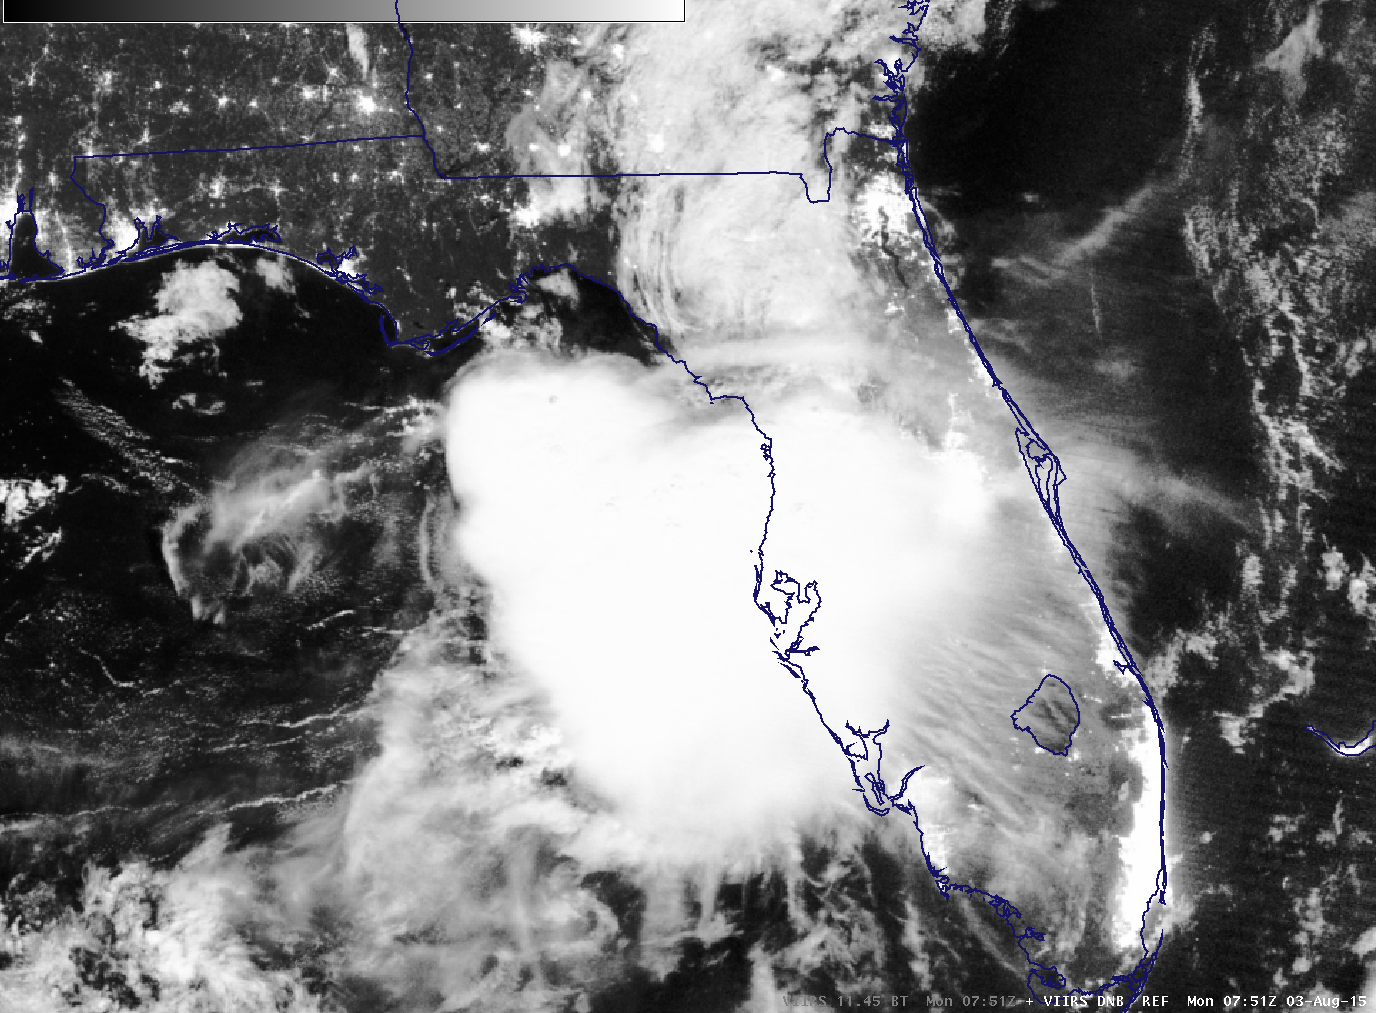
The toggle below of 11.45 µm Brightness Temperature and Day Night band visible (0.70 µm) imagery from 0751 UTC on 3 August shows very cold overshooting tops with temperatures as cold as -88 C over the northwest Gulf. Transverse banding around the periphery of the system is also apparent. Such bands are a signal of turbulence (although no reports were issued at that time).
![Suomi NPP VIIRS Infrared Imagery (11.45 µm) and Day Night Band Visible (0.70 µm) Imagery, 0751 UTC 3 August 2015 [click to enlarge]](https://cimss.ssec.wisc.edu/satellite-blog/wp-content/uploads/sites/5/2015/08/VIIRS_DNB_11.45_BT_20150803_0751_Tampatoggle.gif)
Suomi NPP VIIRS Infrared Imagery (11.45 µm) and Day Night Band Visible (0.70 µm) Imagery, 0751 UTC 3 August 2015 [click to enlarge]
How much rain has fallen in the week ending 4 August 2015? The image below, from this site, shows totals exceeding 10″ just north of Tampa.
![Weekly Rain Totals over Florida [click to enlarge]](https://cimss.ssec.wisc.edu/satellite-blog/wp-content/uploads/sites/5/2015/08/FloridaWeeklyRainsEnding4August.jpg)
Weekly Rain Totals over Florida [click to enlarge]
View only this post Read Less
![GOES-13 Visible (0.63µm) imagery [click to play animation]](https://cimss.ssec.wisc.edu/satellite-blog/wp-content/uploads/sites/5/2015/08/960x1280_EASTL_B1_G13_VIS_animated_2015214_104500_180_2015215_014500_180_GRAY.gif)
![GOES-13 Sounder DPI Lifted Index, times as indicated [click to play animation]](https://cimss.ssec.wisc.edu/satellite-blog/wp-content/uploads/sites/5/2015/08/GOESSounderDPI_LI_2-3August-24anim.gif)
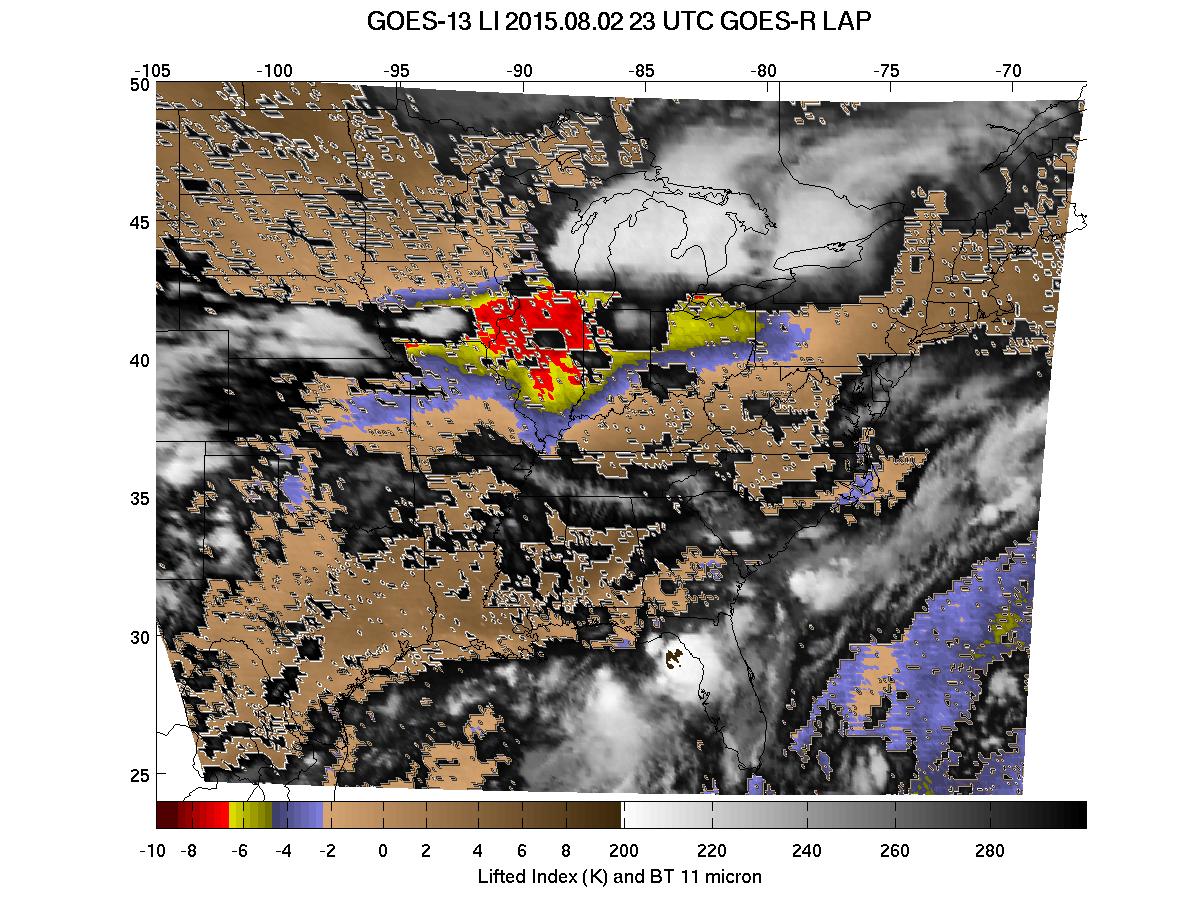
![GOES-R LAP Lifted Index, times as indicated [click to play animation]](https://cimss.ssec.wisc.edu/satellite-blog/wp-content/uploads/sites/5/2015/08/LIGOESRP1_20150802_17_23Zanim.gif)
![GOES-13 Sounder DPI Convective Available Potential Energy (CAPE), times as indicated [click to play animation]](https://cimss.ssec.wisc.edu/satellite-blog/wp-content/uploads/sites/5/2015/08/https://cimss.ssec.wisc.edu/satellite-blog/wp-content/uploads/sites/5/2015/08/GOES_CAPE_20150802_03anim.gif)
![GOES-R LAP Convective Available Potential Energy (CAPE), times as indicated [click to play animation]](https://cimss.ssec.wisc.edu/satellite-blog/wp-content/uploads/sites/5/2015/08/CAPEGOESRP1_20150802_12_23anim.gif)
![Suomi NPP VIIRS Day Night Band Visible (0.70 µm) Imagery [click to enlarge]](https://cimss.ssec.wisc.edu/satellite-blog/wp-content/uploads/sites/5/2015/08/VIIRS_DNB__REF_20150803_0751.png)
![Suomi NPP VIIRS Infrared (11.45 µm) Imagery [click to enlarge]](https://cimss.ssec.wisc.edu/satellite-blog/wp-content/uploads/sites/5/2015/08/VIIRS_11.45_BT_20150803_0751.png)
![Color-enhanced Infrared (10.7 µm) imagery from GOES-15 (left) and GOES-13 (right), times as indicated [click to play animation]](https://cimss.ssec.wisc.edu/satellite-blog/wp-content/uploads/sites/5/2015/07/GOES13GOES15_28July_ManitobaTornadoanim.gif)
![GOES-15 (left) and GOES-13 (right) 10.7 µm Infrared images, with surface reports [click to play animation]](https://cimss.ssec.wisc.edu/satellite-blog/wp-content/uploads/sites/5/2015/07/150727-28_goes15_goes13_ir_MB_tornado_anim.gif)
![Terra MODIS 11.0 µm Infrared image [click to enlarge]](https://cimss.ssec.wisc.edu/satellite-blog/wp-content/uploads/sites/5/2015/07/MODIS_IR_20150728_0331.png)
![GOES-13 Visible (0.63 µm) imagery, times as indicated [click to play animation]](https://cimss.ssec.wisc.edu/satellite-blog/wp-content/uploads/sites/5/2015/07/GOES13_VIS_28July2015animMANITOBATORNADO.gif)
![GOES-15 Visible (0.62 µm) imagery, times as indicated [click to play animation]](https://cimss.ssec.wisc.edu/satellite-blog/wp-content/uploads/sites/5/2015/07/GOES15_VIS_28July2015animMANITOBATORNADO.gif)
![GOES-15 (left) and GOES-13 (right) 0.63 µm visible channel images, with surface reports [click to play animation]](https://cimss.ssec.wisc.edu/satellite-blog/wp-content/uploads/sites/5/2015/07/150727-28_goes15_goes13_visible_MB_tornado_anim.gif)
![GOES sounder CAPE derived product images [click to play animation]](https://cimss.ssec.wisc.edu/satellite-blog/wp-content/uploads/sites/5/2015/07/150727-28_goes_sounder_cape_MB_tornado_anim.gif)
![GOES sounder Lifted Index derived product images [click to play animation]](https://cimss.ssec.wisc.edu/satellite-blog/wp-content/uploads/sites/5/2015/07/150727-28_goes_sounder_li_anim.gif)
![GOES sounder Total Precipitable Water derived product images [click to play animation]](https://cimss.ssec.wisc.edu/satellite-blog/wp-content/uploads/sites/5/2015/07/150727-28_goes_sounder_tpw_MB_tornado_anim.gif)
![GOES-15 visible (top) and shortwave IR (bottom) images [click to play animation]](https://cimss.ssec.wisc.edu/satellite-blog/wp-content/uploads/sites/5/2015/07/150722-25_goes15_swir_visible_AK_fires_anim.gif)
![Suomi NPP VIIRS shortwave IR images [click to play animation]](https://cimss.ssec.wisc.edu/satellite-blog/wp-content/uploads/sites/5/2015/07/150722-25_suomi_npp_viirs_shortwaveIR_AK_fires_anim.gif)
![Time series of surface observation from Utopia Creek, Indian Mountain airport [click to enlarge]](https://cimss.ssec.wisc.edu/satellite-blog/wp-content/uploads/sites/5/2015/07/150723-25_PAIM_SFCMG.GIF)
![Suomi NPP VIIRS true-color images [click to enlarge]](https://cimss.ssec.wisc.edu/satellite-blog/wp-content/uploads/sites/5/2015/07/150722-25_suomi_npp_viirs_truecolor_AK_smoke_anim.gif)
