
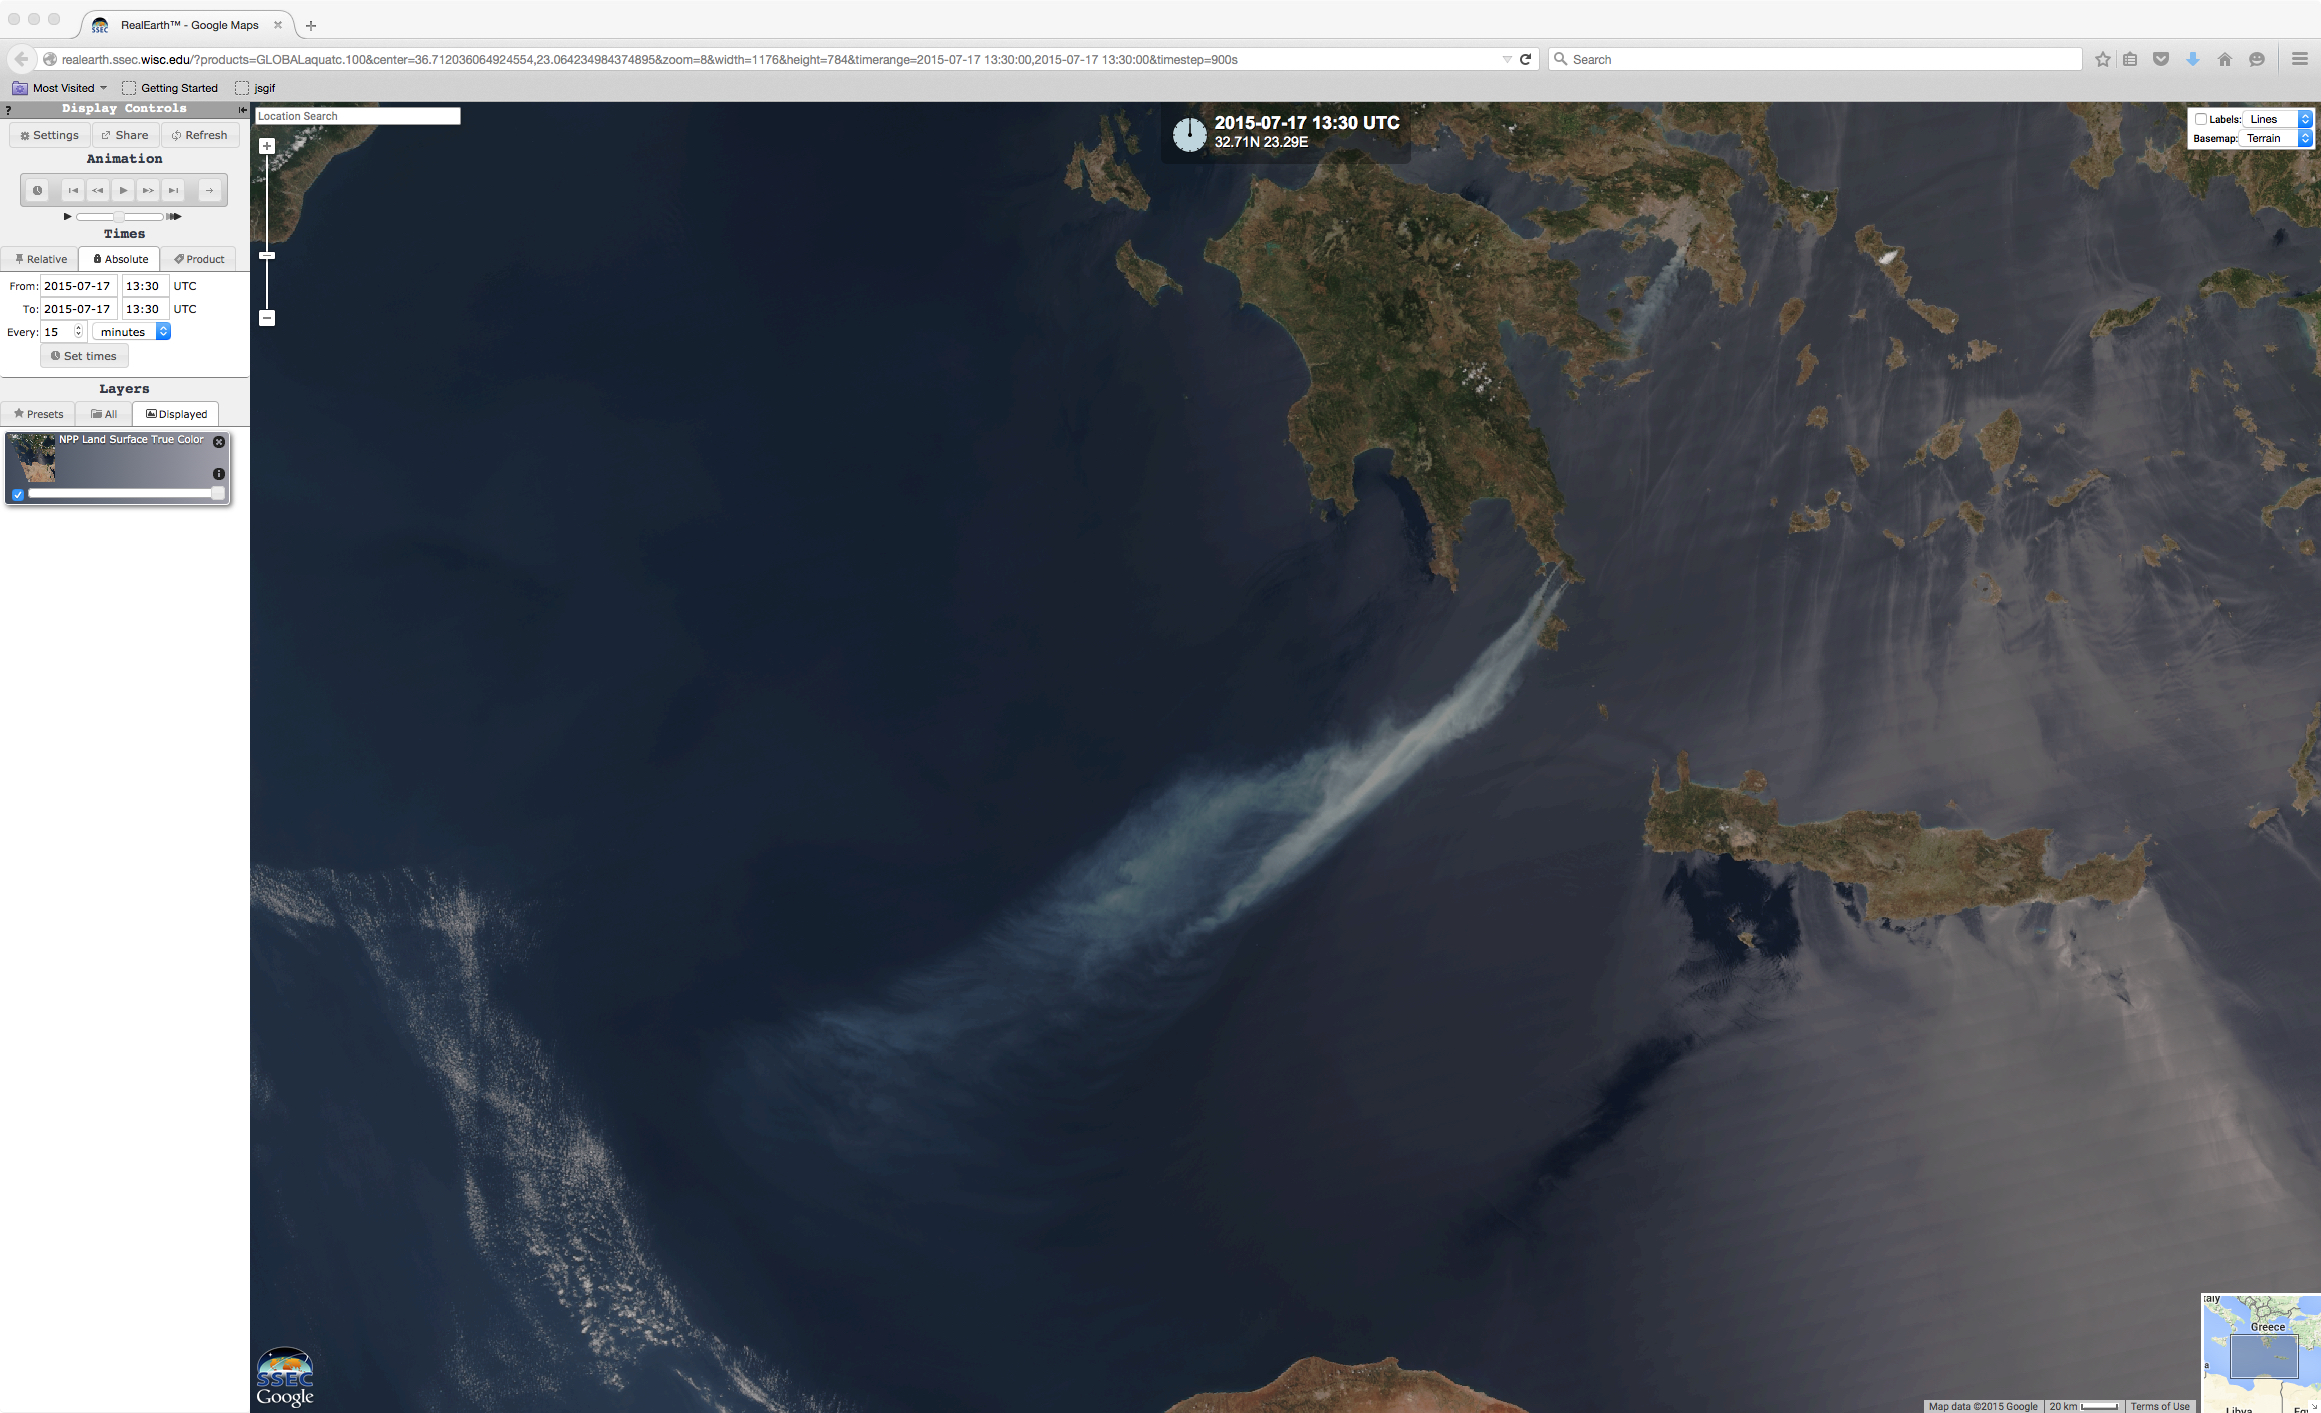
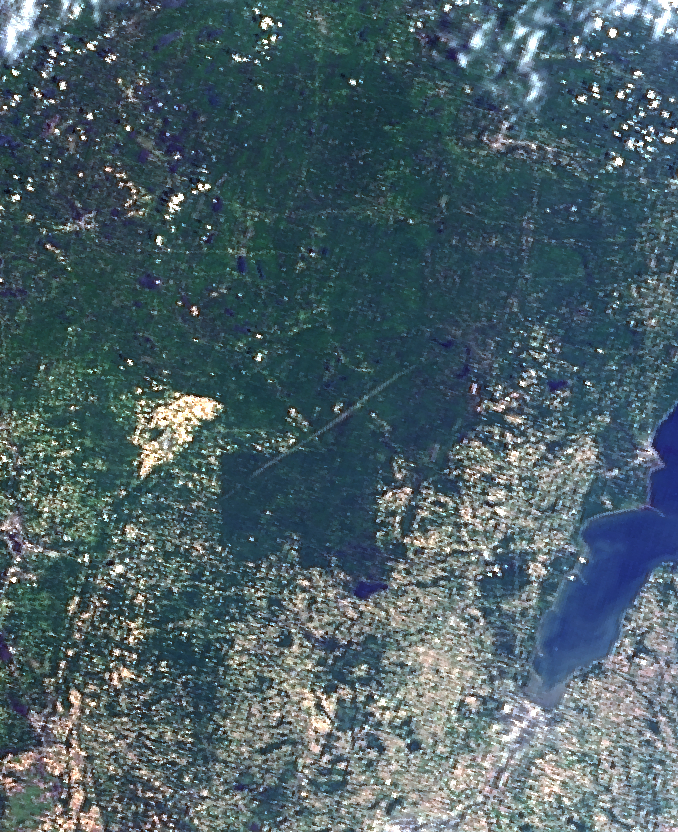
Suomi NPP VIIRS true-color image (actual satellite overpass time 1112 UTC)
Suomi NPP VIIRS (above; toggle with Google maps) and Aqua MODIS (below; toggle with Google maps) true-color Red/Green/Blue (RGB) images visualized using SSEC RealEarth showed 2 smoke plumes from wildfires burning in Greece on 17 July 2015. These fires were causing evacuations in some areas, according to the Wildfire Today site.

Aqua MODIS true-color image composite (actual satellite overpass times 1102 UTC and 1240 UTC)
Surface observations around the time of the images (below) indicated that air temperatures were in the 90-100º F (32.2-37.8º C) range at many sites across the region. Winds at Athens were from the northeast at 26 knots, with gusts to 36 knots (time series plot of surface data). Near the edge of the larger smoke plume to the southwest, the surface visibility was restricted to 5 miles at Kithira (but was as low as 3 miles at 10 UTC: time series plot of surface data).
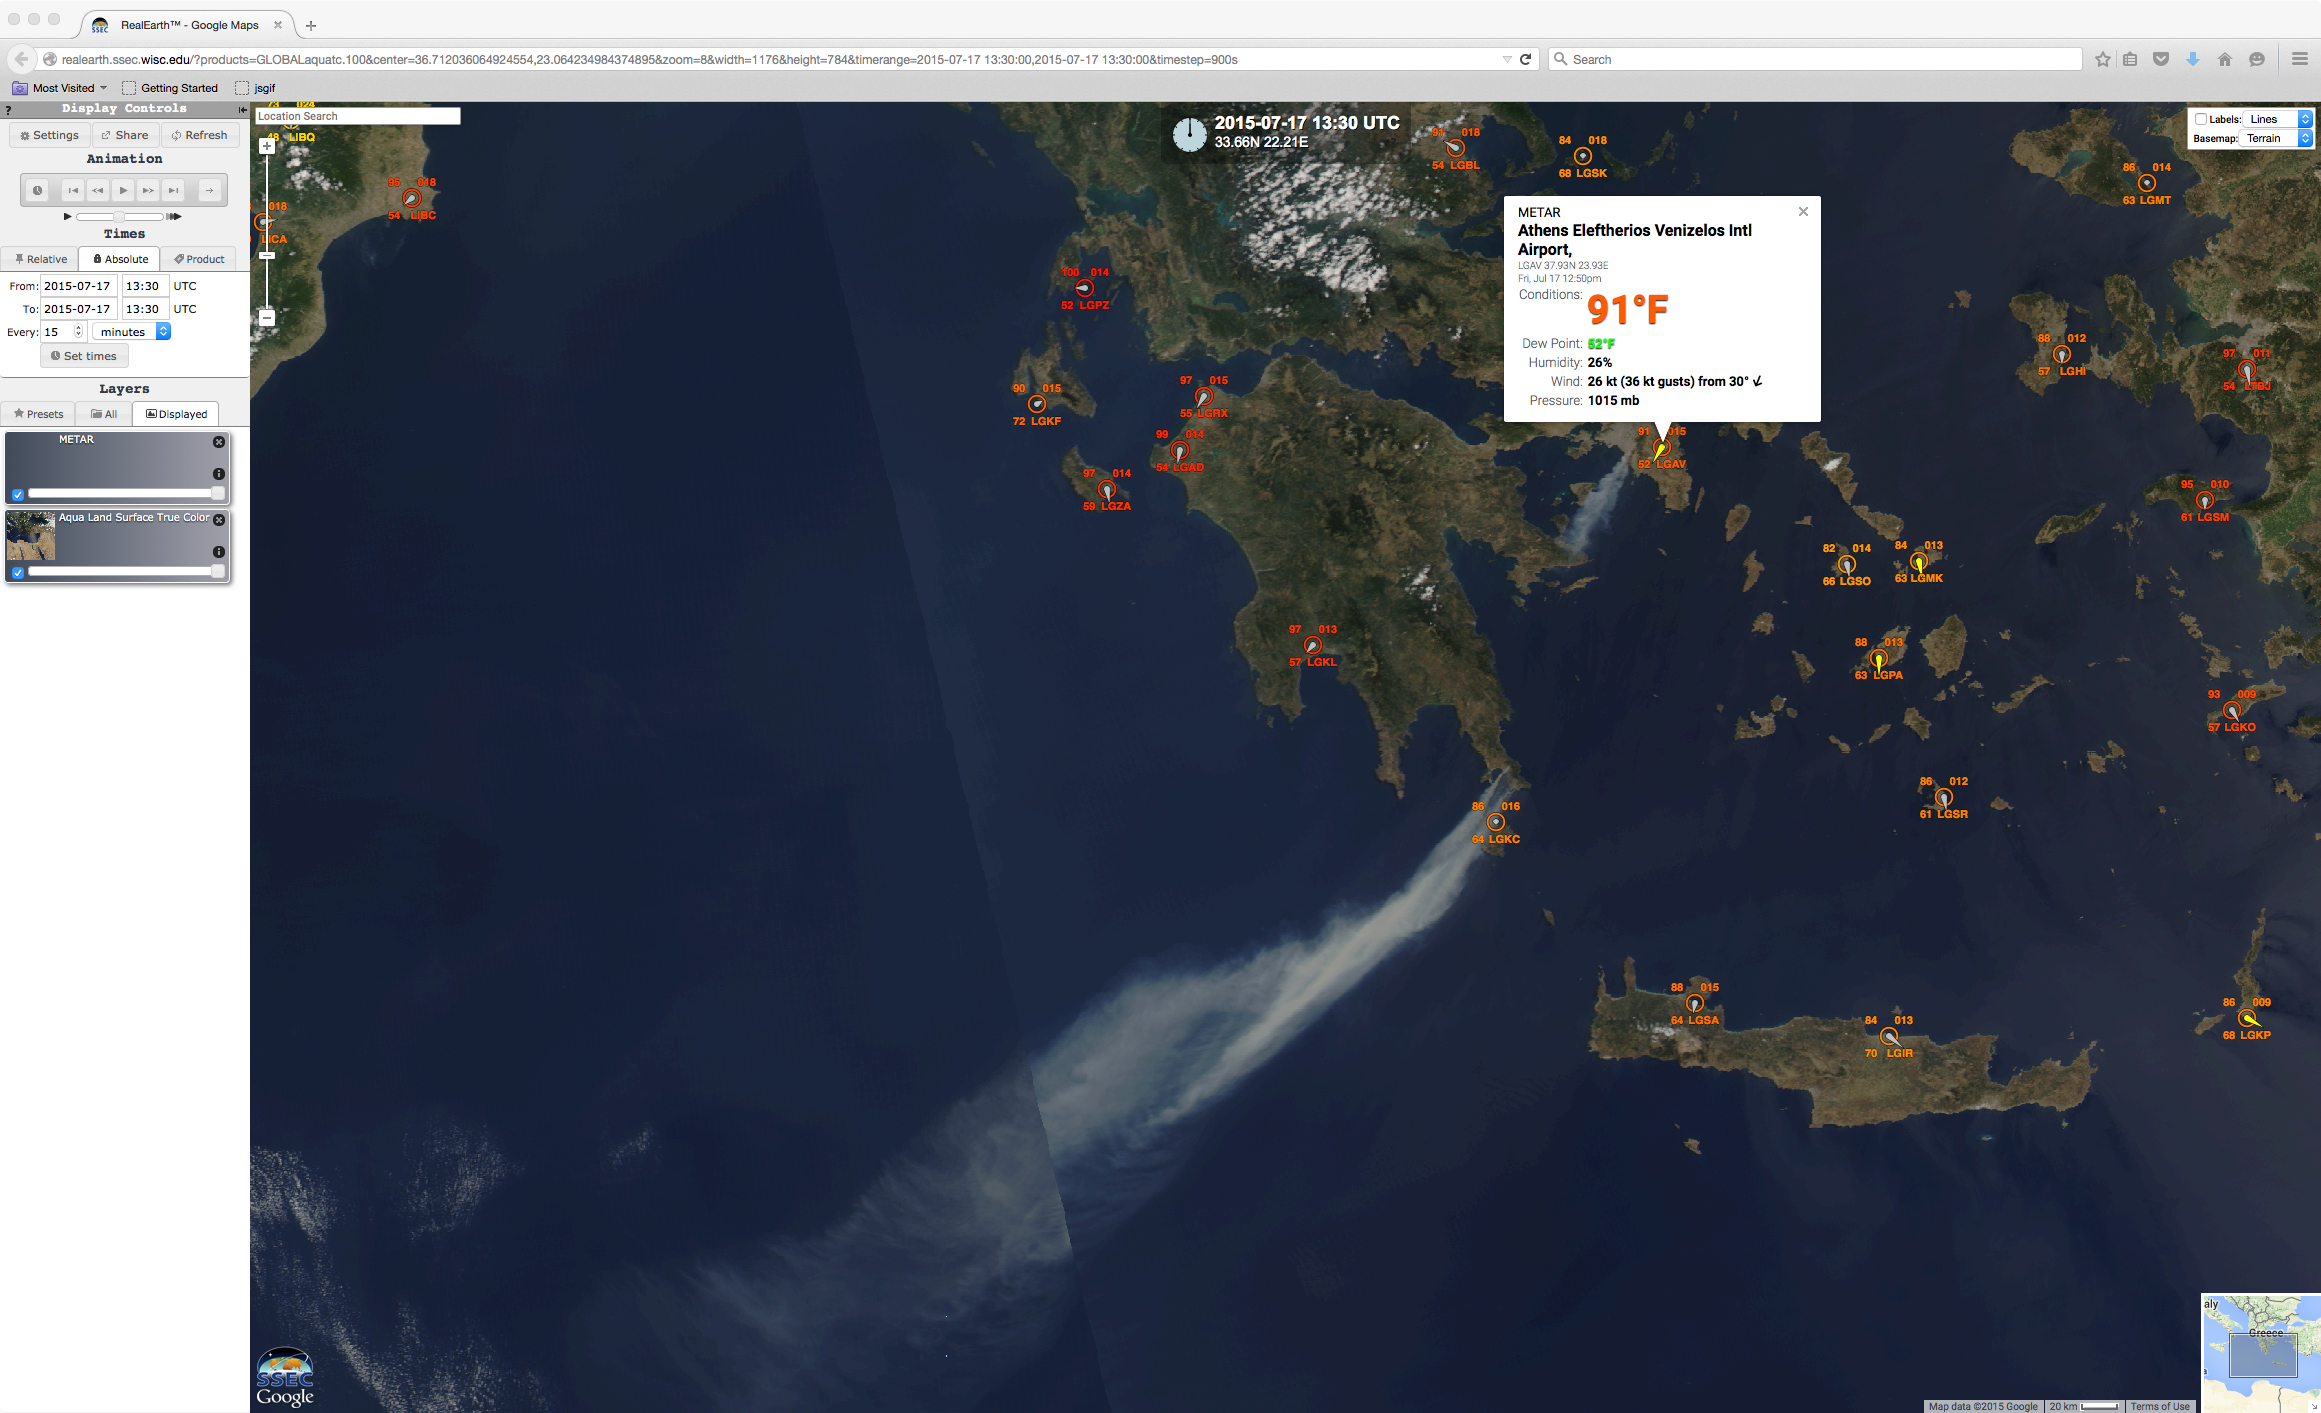
Aqua MODIS true-color image, with Athens, Greece surface observation (click to enlarge)
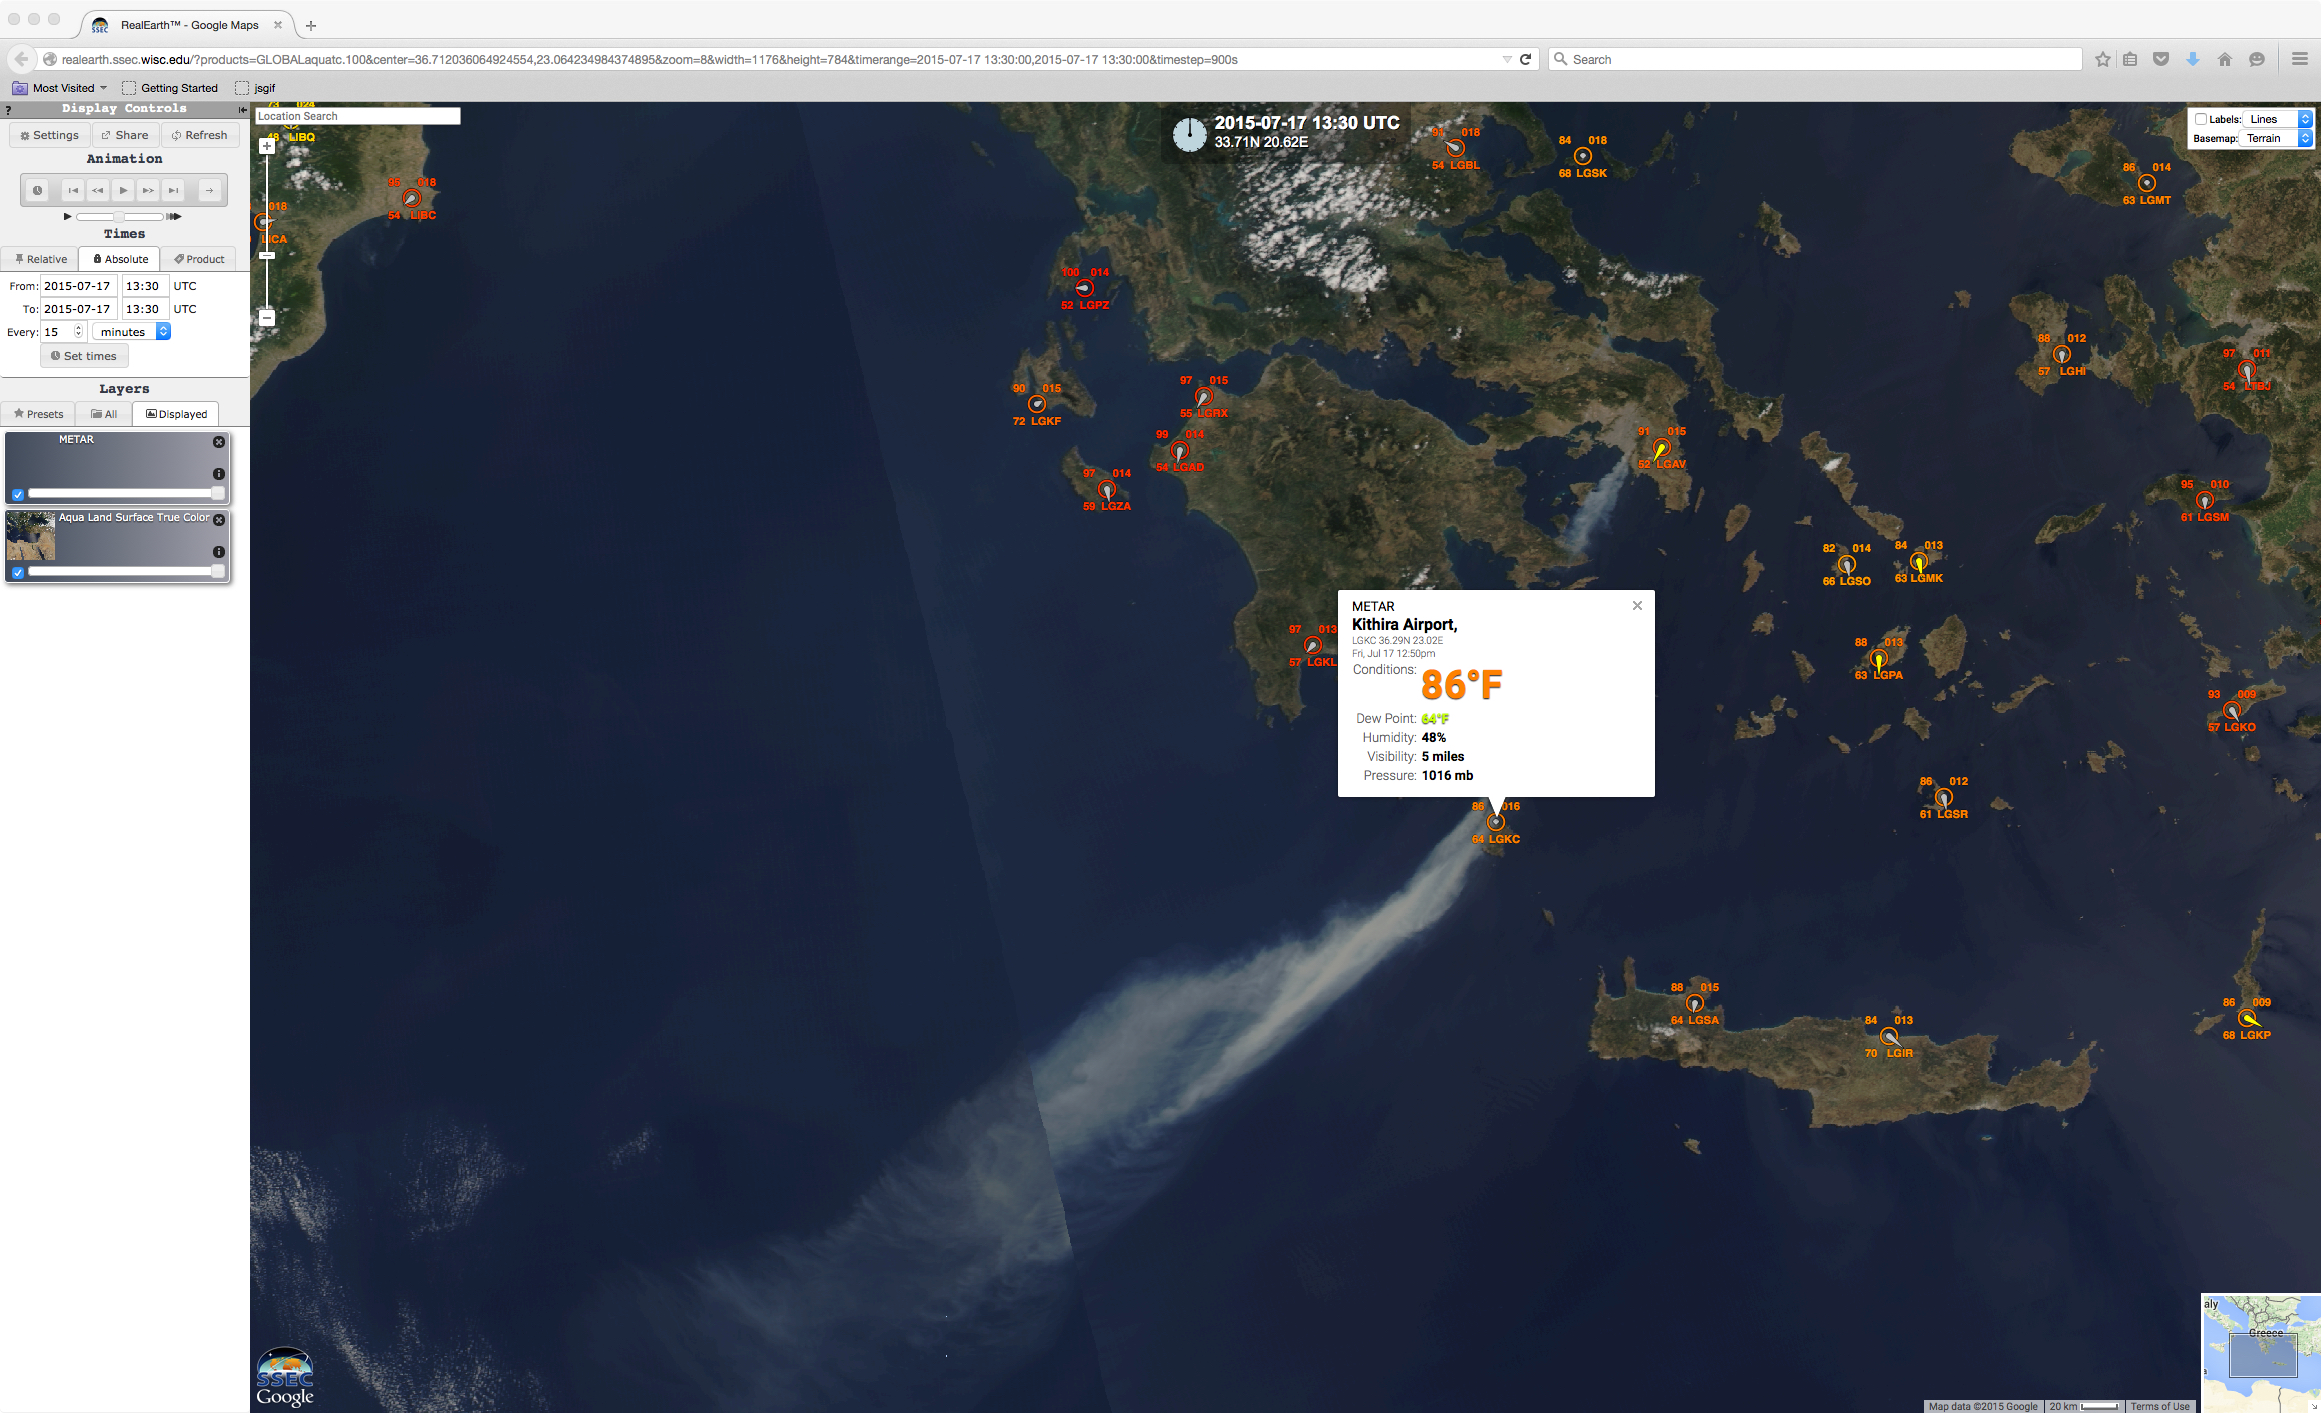
Aqua MODIS true-color image, with Kithira, Greece surface observation (click to enlarge)
EUMETSAT Meteosat-10 High Resolution Visible (0.8 µm) and shortwave IR (3.92 µm) images (below; click to play animation; also available as an MP4 movie file) showed thee temporal evolution of the smoke plume and the associated fire hot spots (dark black to red pixels). Athens is located within the cyan circle on the images.
Meteosat-10 visible and shortwave IR images (click to play animation)
View only this post Read Less

![Terra MODIS 0.65 µm visible channel and 11.0 µm IR channel images (with SPC storm reports) at 1657 UTC [click to enlarge]](https://cimss.ssec.wisc.edu/satellite-blog/wp-content/uploads/sites/5/2015/07/150714_1657utc_terra_modis_visible_ir_MCS_anim.gif)
![Suomi NPP VIIRS 0.64 µm visible channel and 11.45 µm IR channel images (with SPC storm reports) at 1851 UTC [click to enlarge]](https://cimss.ssec.wisc.edu/satellite-blog/wp-content/uploads/sites/5/2015/07/150714_1851utc_suomi_npp_viirs_visible_ir_MCS_anim.gif)
![POES AVHRR 0.86 µm visible channel and 12.0 µm IR channel images (with SPC storm reports) at 1916 UTC [click to enlarge]](https://cimss.ssec.wisc.edu/satellite-blog/wp-content/uploads/sites/5/2015/07/150714_1916utc_poes_avhrr_visible_ir_MCS_anim.gif)


/na2015_07_15_196.gif)