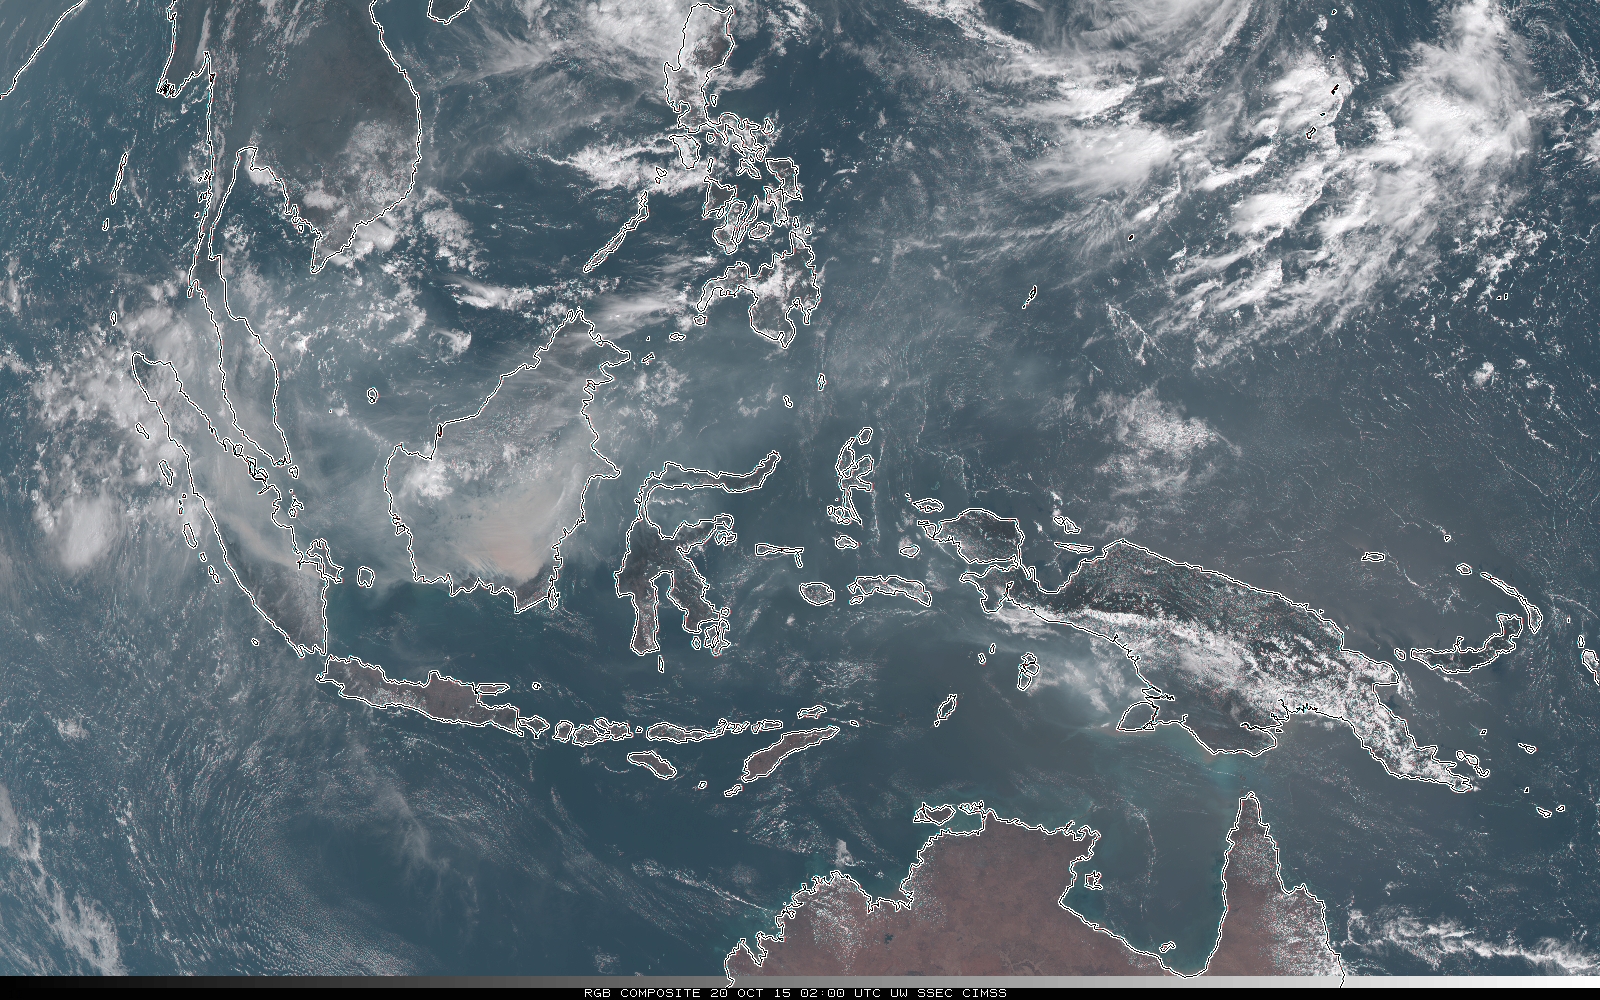
RGB Composites from Himawari-8 (0.47 µm, 0.51 µm and 0.64 µm used for blue, green and red, respectively) 0200 UTC from 08-26 October 2015. (Click to animate)
Many of the islands in Indonesia have been shrouded in smoke for much of October. RGB composites from Himawari-8, above, for 0200 UTC on each day from 08-26 October 2015 testify to the dense smoke, especially over the island of Borneo. News reports suggest the haze will persist through the end of the year. This is in part due to the strong El Nino event ongoing; El Nino events typically suppress rainfall over the western tropical Pacific basin.
Smoke detection using visible channels, such as those combined in the true color imagery above, is straightforward. At night, however, visible imagery is not available. The animation below shows the difficulty in detecting smoke using infrared imagery. Although parts of the smoke plume show up, the widespread pall of smoke is not captured. Hot spots can be detected using the 3.9 µm (and 2.3 µm) bands on Himawari-8, but viewing the transport of the resultant smoke is a challenge. Except for the VIIRS Day/Night Band imagery from Suomi NPP, then, nighttime smoke detection relies on model output (Source).
16-panel Himawari-8 multispectral animation, hourly from 0000 UTC/20 October to 0100/21 October. Top row: 0.47µm, 0.51µm, 0.64µm, 0.86µm ; Second Row: 1.6µm, 2.3µm, 3.9µm, 6.2µm; Third Row: 6.9µm, 7.3 µm, 8.6 µm, 9.6 µm; Bottom Row: 10.4µm, 11.2 µm, 12.4µm, 13.3µm (Click to animate)
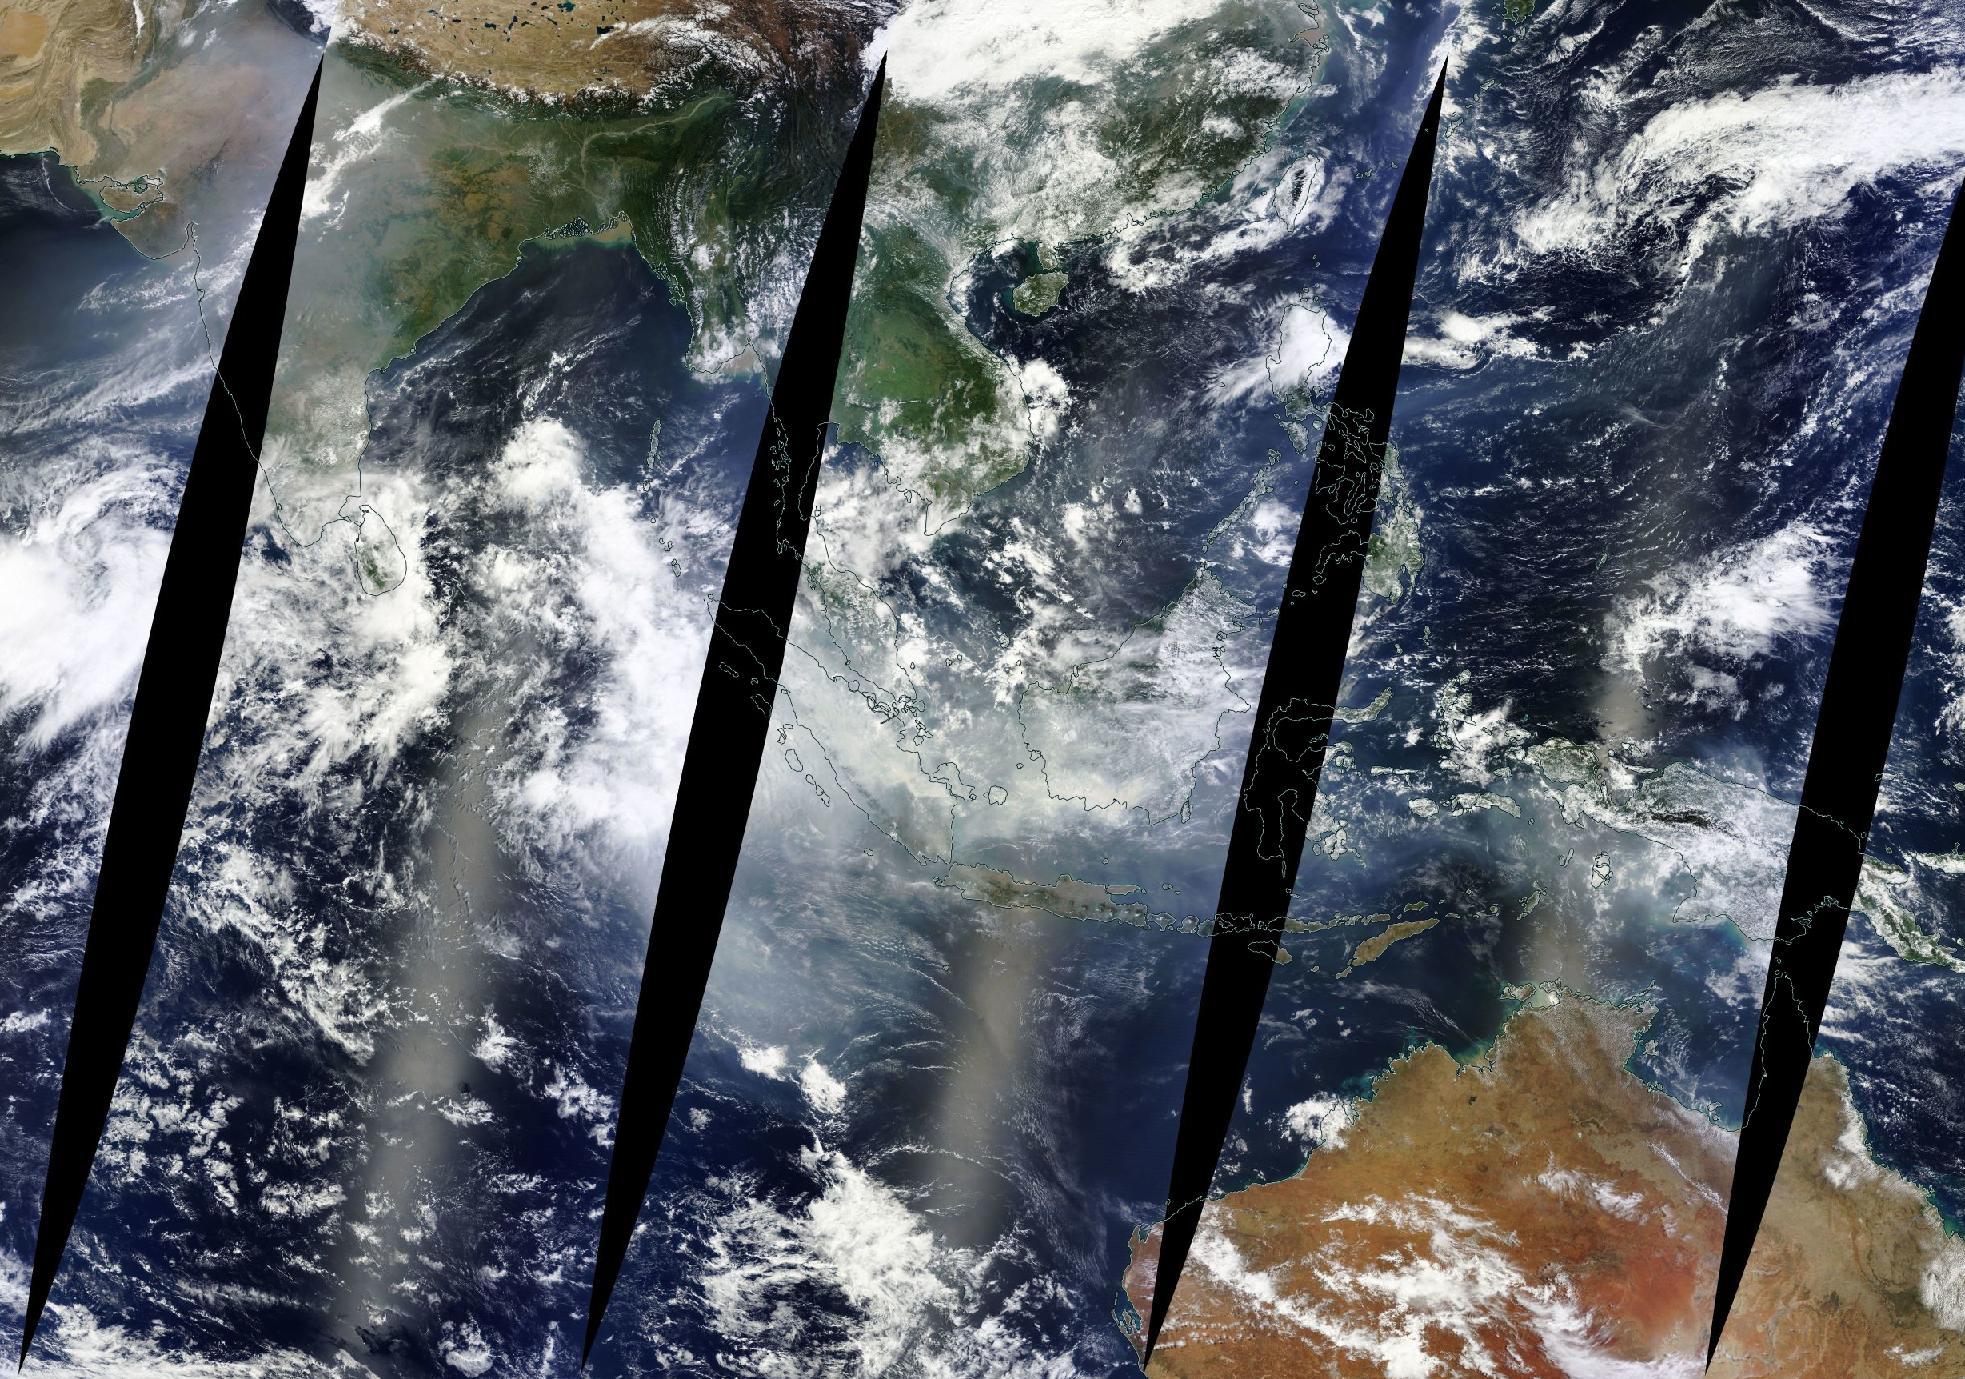
The SSEC RealEarth web map server can be used to take a closer look at the islands of Borneo and Sumatra from 20-26 October. Daily comparisons of Suomi NPP VIIRS fire detections and true-color RGB images shown below revealed that although there was a gradual decreasing trend in the number and areal coverage of fires by 26 October, a great deal of smoke still remained over much of the region.
![Daily comparisons of Suomi NPP VIIRS fire detections and true-color RGB images, from 20-26 October [click to animate]](https://cimss.ssec.wisc.edu/satellite-blog/wp-content/uploads/sites/5/2015/10/151020-26_suomi_npp_viirs_fire_detections_truecolor_Borneo_anim.gif)
Daily comparisons of Suomi NPP VIIRS fire detections and true-color RGB images, from 20-26 October [click to animate]
![Daily time series of surface reports from Kuala Lumpur [click to animate]](https://cimss.ssec.wisc.edu/satellite-blog/wp-content/uploads/sites/5/2015/10/151020-26_WMKK_SFCMG_anim.gif)
Daily time series of surface reports from Kuala Lumpur [click to animate]
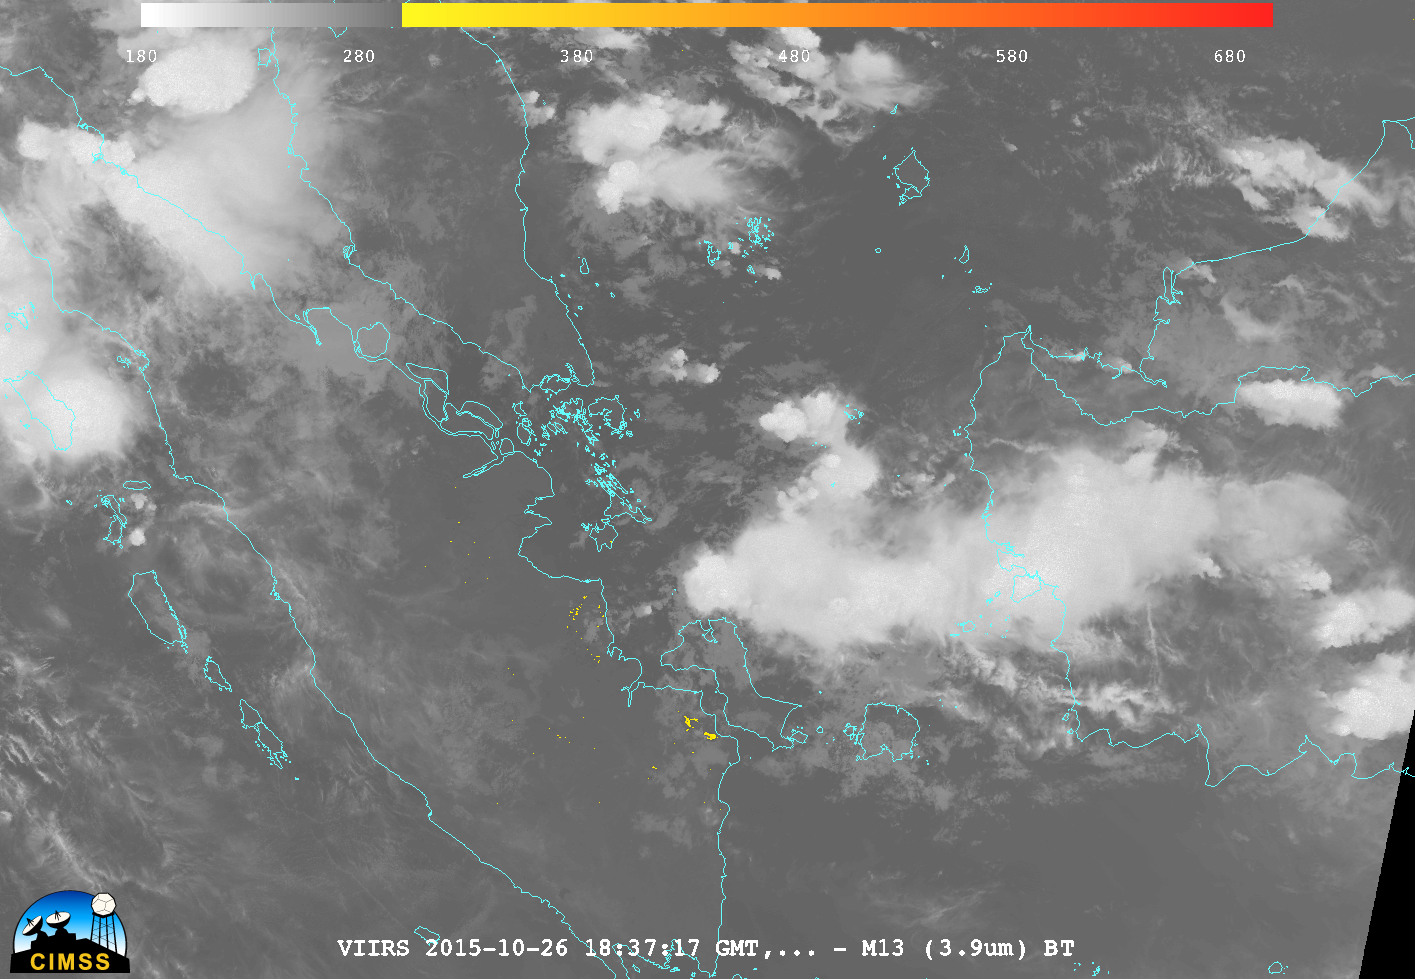
![Suomi NPP VIIRS Day/Night Band Visible Imagery (0.70 µm) 1837 UTC on 26 October 2015 [click to enlarge]](https://cimss.ssec.wisc.edu/satellite-blog/wp-content/uploads/sites/5/2015/10/DNB_102615_1837_5E-8_smoke_tstormsIndonesia.png)
Suomi NPP VIIRS Day/Night Band Visible Imagery (0.70 µm) 1837 UTC on 26 October 2015 [click to enlarge]
The Suomi NPP VIIRS instrument contains a day-night sensor that produces useful visible imagery when illuminated by the Moon (and a full Moon occurred on 27 October 2015). The image above from 1837 UTC on 26 October (Courtesy William Straka, SSEC) shows a pall of smoke from Borneo to Sumatra. Thunderstorms are also present over the South China Sea and Borneo. An toggle of the Day Night Band, the 3.9 µm infrared and the 1.6 µm infrared imagery shows that hot spots associated with fires can be detected (enhanced as orange in the 3.9 µm and white in the 1.6 µm), but the associated smoke is mostly undetected in the infrared.
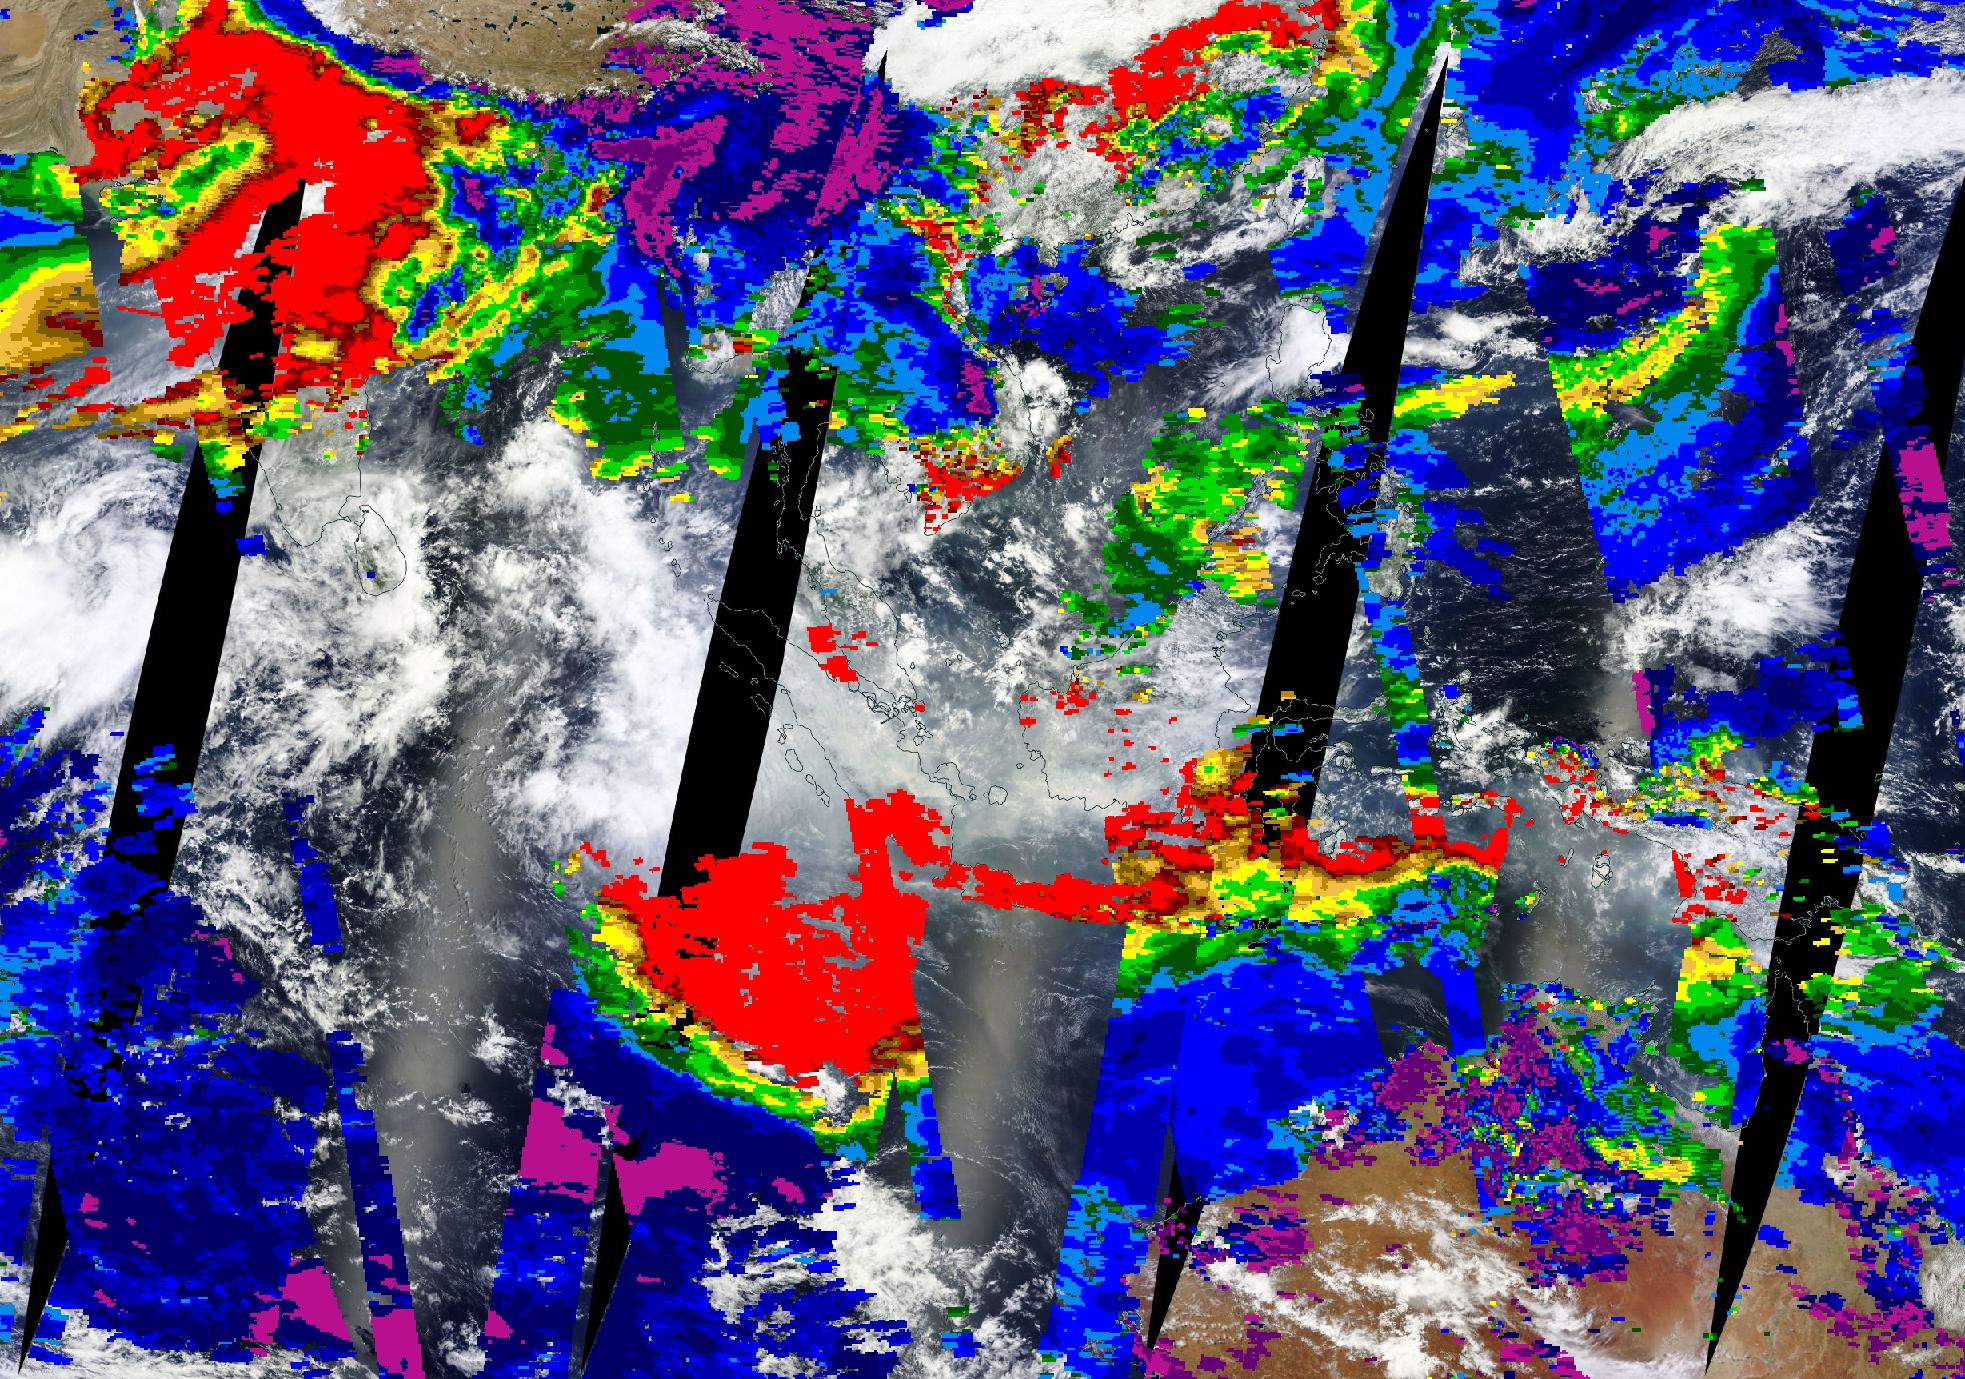
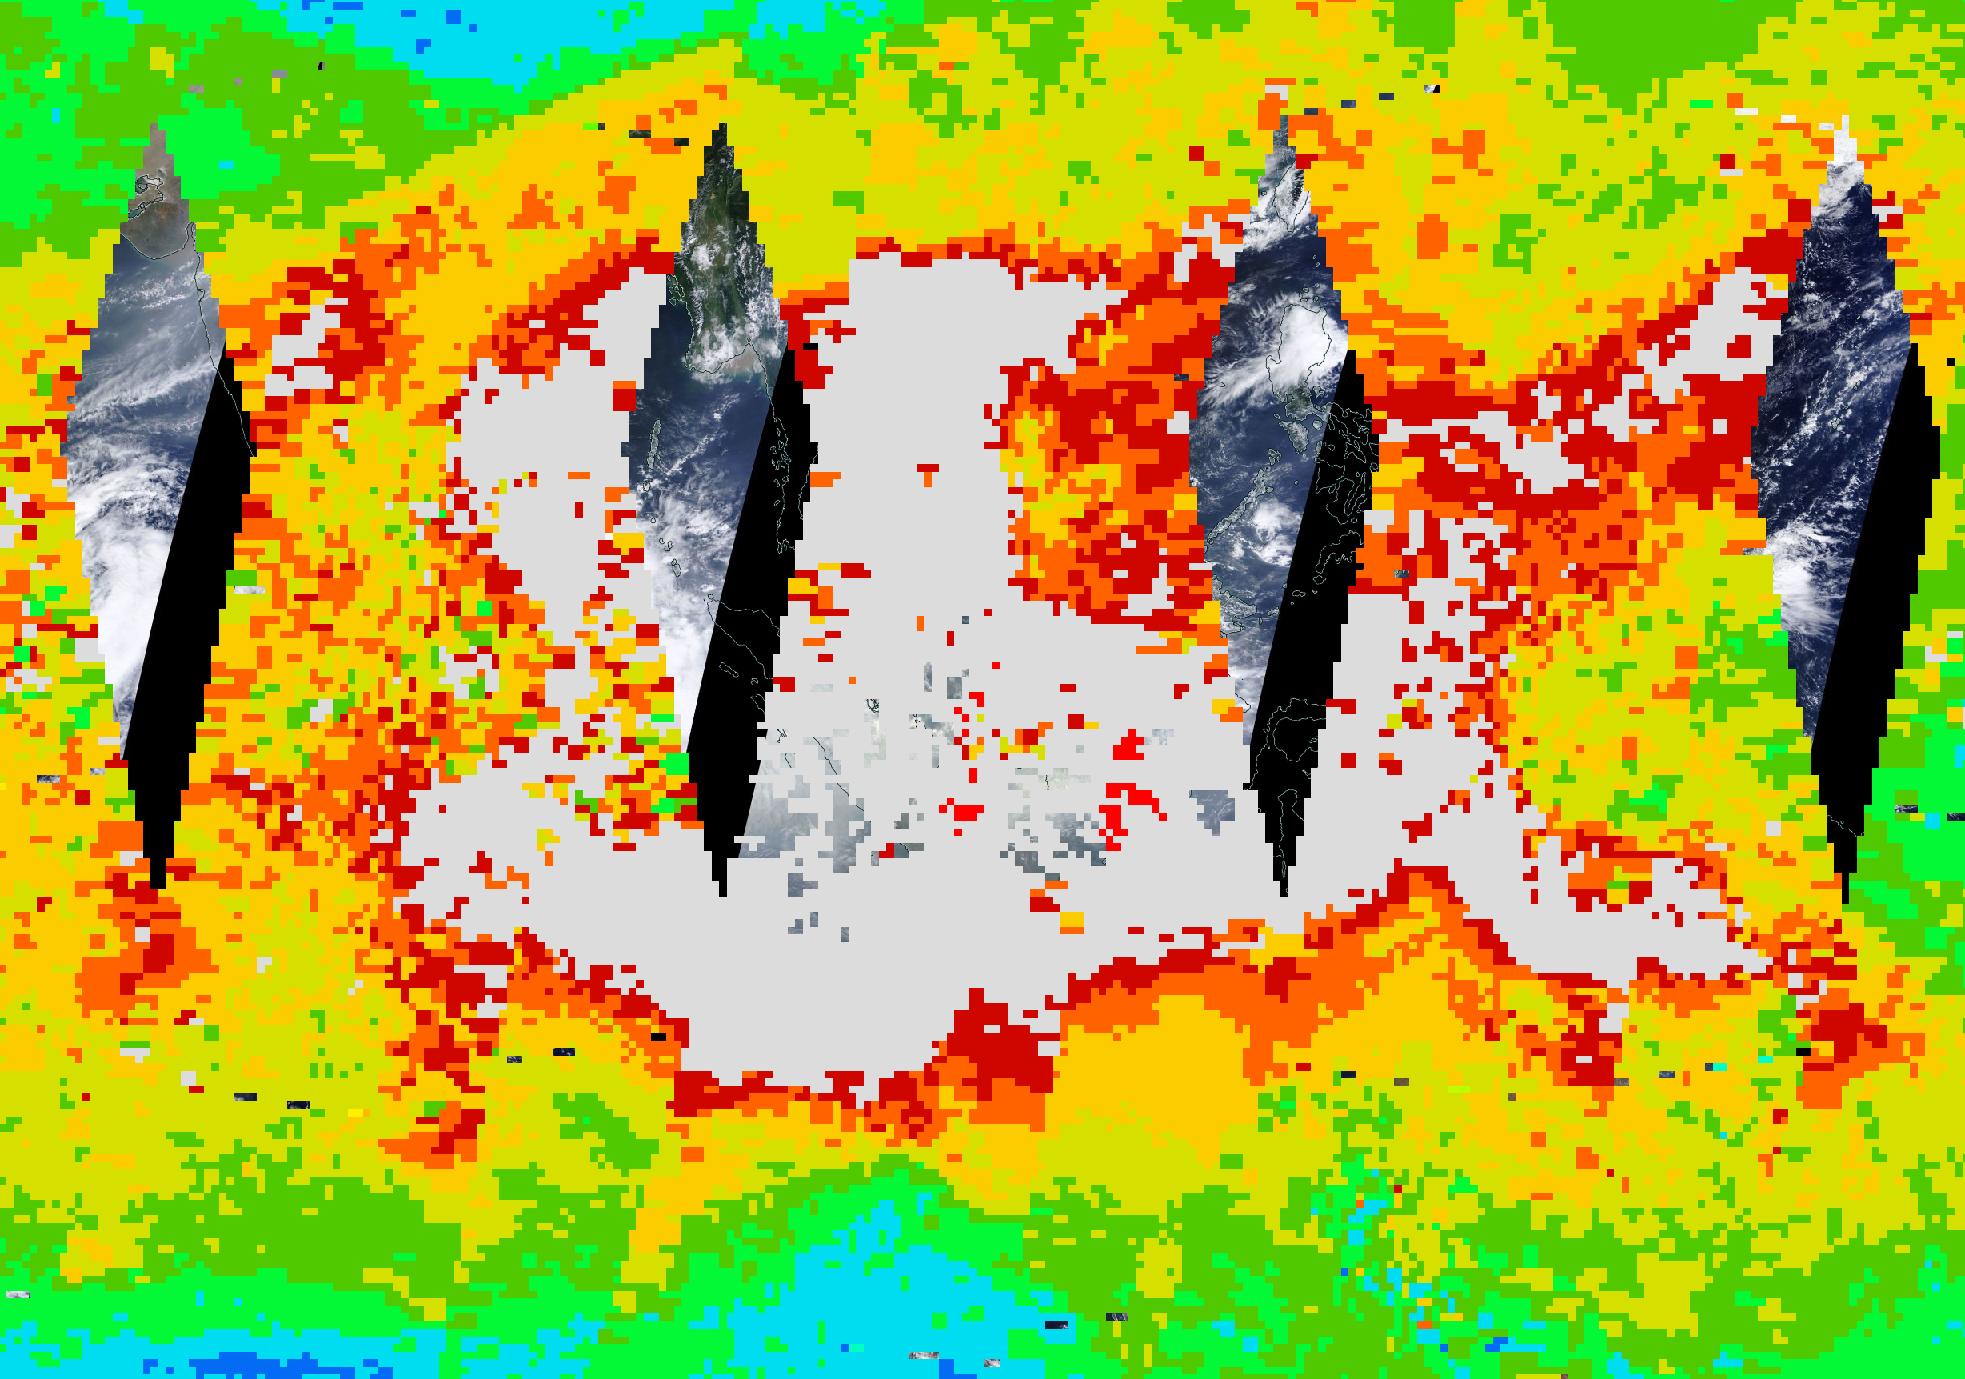
Two sites, one NASA and one NOAA, can give additional information about the smoke. The toggle below, taken from imagery at the NASA site, shows MODIS True-Color imagery, Aeorosol Optical Depth (AOD) (in NASA Worldview, with units) (in cloud-free regions) and retrieved Carbon Monoxide concentrations (in NASA Worldview, with units). AODs are very large, and CO concentrations are off the scale.
![MODIS True Color Imagery, Aerosol Optical Depth and CO Concentrations on 26 October 2015 [click to enlarge]](https://cimss.ssec.wisc.edu/satellite-blog/wp-content/uploads/sites/5/2015/10/image-download__TrueColor_AOD_COconcentrationtoggle.gif)
MODIS True Color Imagery, Aerosol Optical Depth and CO Concentrations on 26 October 2015 [click to enlarge]
View only this post Read Less
![GOES-15 Infrared (10.7 µm) images [click to play animation]](https://cimss.ssec.wisc.edu/satellite-blog/wp-content/uploads/sites/5/2015/10/151022-23_goes15_ir_Hurricane_Patricia_anim.gif)
![Advanced Dvorak Technique (ADT) intensity estimate plot [click to enlarge]](https://cimss.ssec.wisc.edu/satellite-blog/wp-content/uploads/sites/5/2015/10/151020-23_adt_Patricia.gif)
![GOES-15 Visible (0.63 µm) images [click to play animation]](https://cimss.ssec.wisc.edu/satellite-blog/wp-content/uploads/sites/5/2015/10/151022_goes15_visible_Hurricane_Patricia_anim.gif)

![GOES-15 (left) and GOES-13 (right) 0.63 µm visible images [click to play animation]](https://cimss.ssec.wisc.edu/satellite-blog/wp-content/uploads/sites/5/2015/10/151023_goes15_goes13_visible_Hurricane_Patricia_anim.gif)
![MIMIC morphed microwave imagery [click to enlarge]](https://cimss.ssec.wisc.edu/satellite-blog/wp-content/uploads/sites/5/2015/10/151022-23_mimic_Patricia_anim.gif)
![Suomi NPP VIIRS true-color images from 23, 24, and 25 October [click to enlarge]](https://cimss.ssec.wisc.edu/satellite-blog/wp-content/uploads/sites/5/2015/10/151023-25_suomi_npp_viirs_truecolor_Patricia_sediment_anim.gif)
![GOES-15 Infrared (10.7 µm) images [click to play animation]](https://cimss.ssec.wisc.edu/satellite-blog/wp-content/uploads/sites/5/2015/10/151019-20_goes15_ir_Hurricane_Olaf_anim.gif)
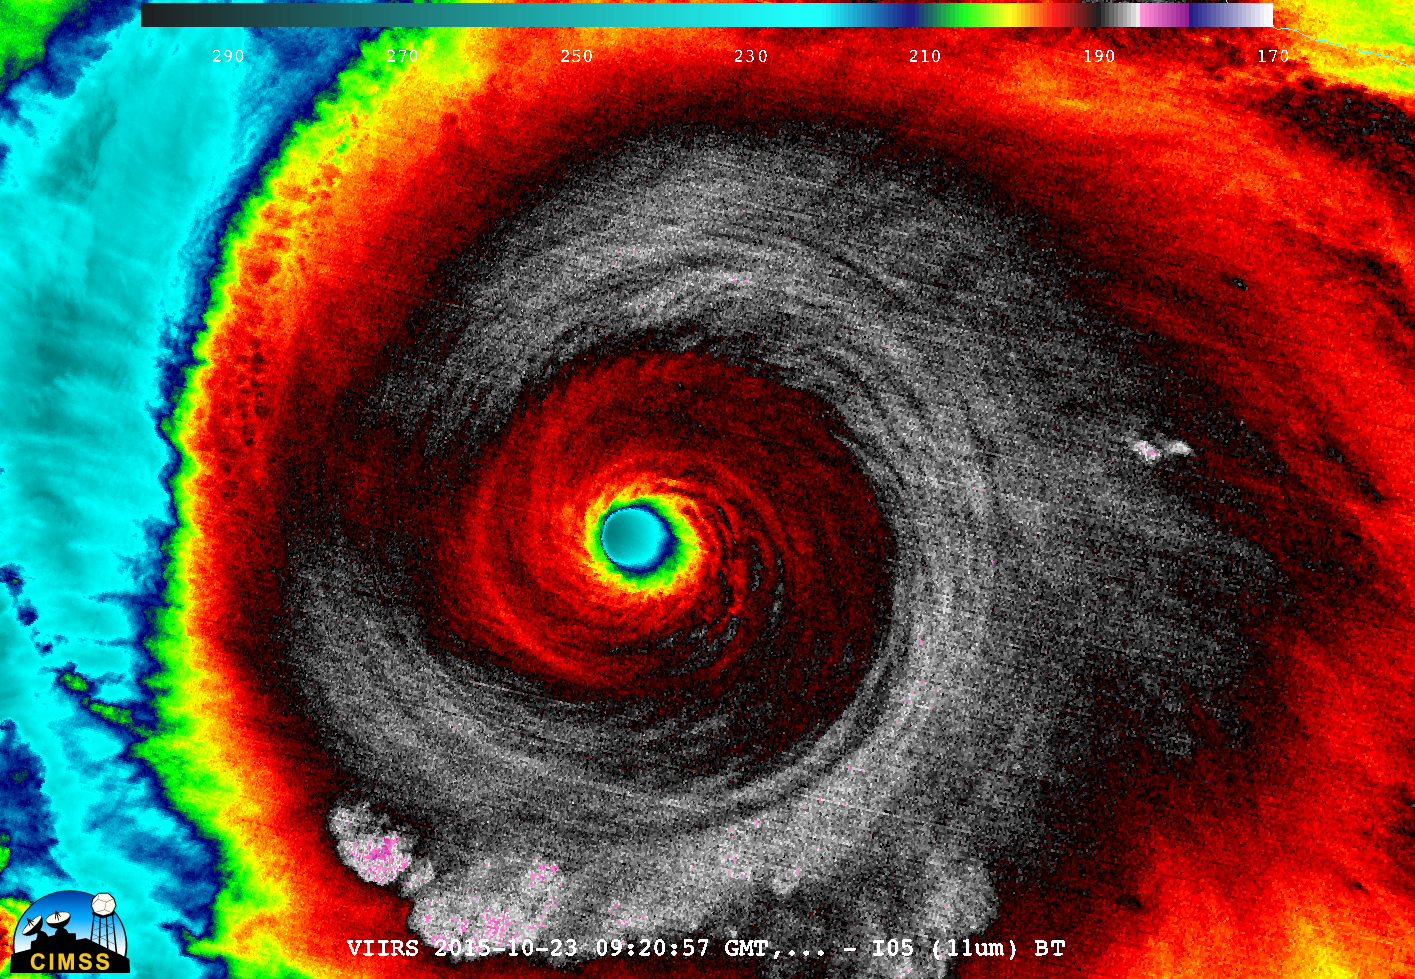
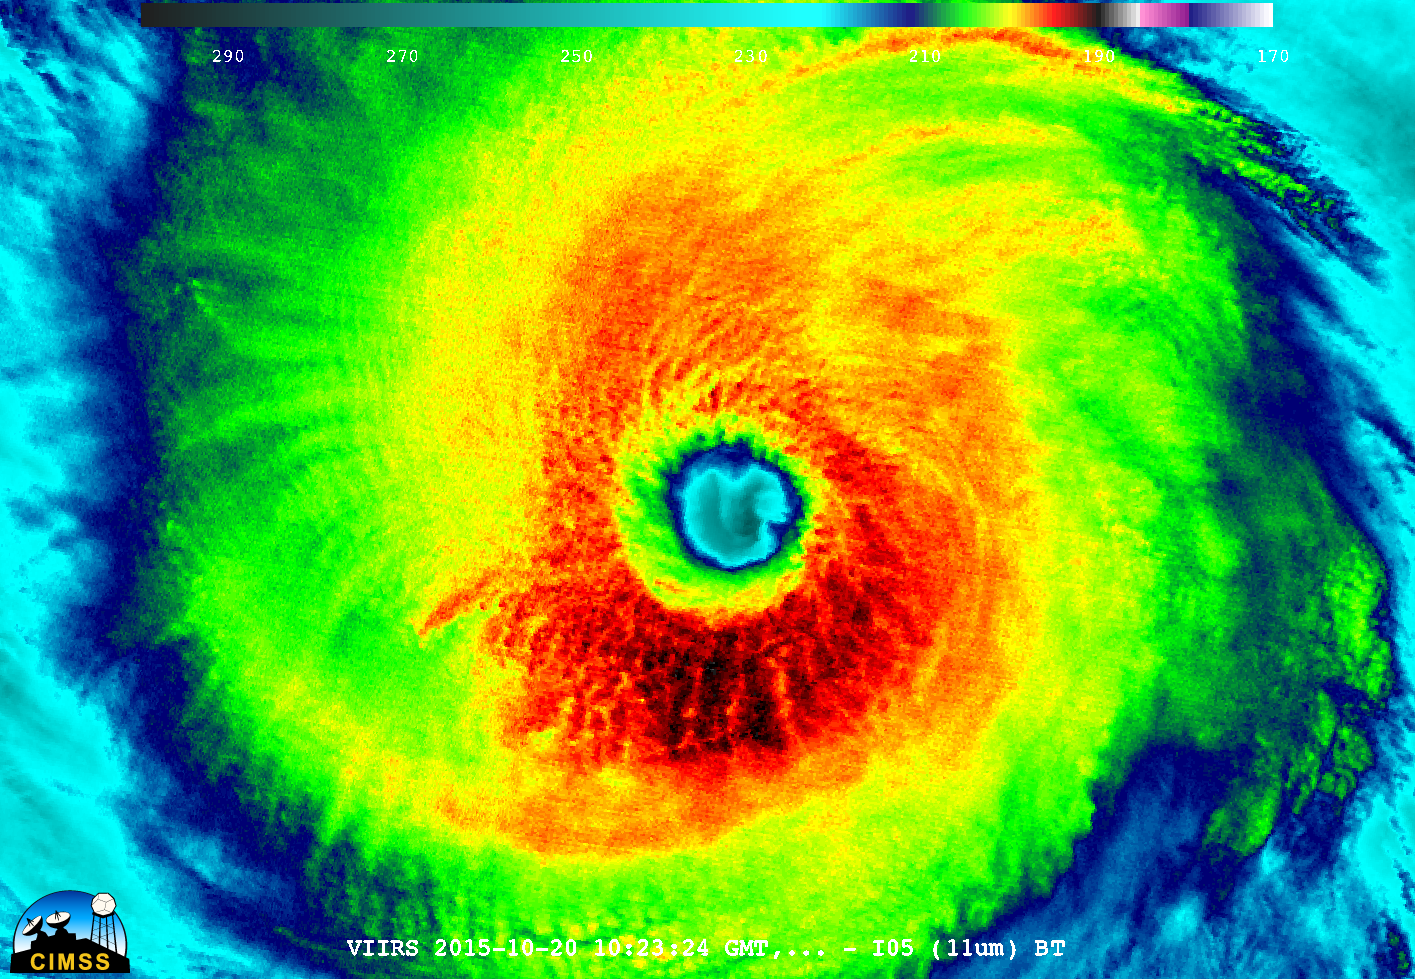
![Suomi NPP VIIRS Infrared (11.45 µm) image [click to enlarge]](https://cimss.ssec.wisc.edu/satellite-blog/wp-content/uploads/sites/5/2015/10/151020_1023utc_suomi_npp_viirs_ir_Hurricane_Olaf.png)
