A major eruption of the Mount Pavlof volcano on the Alaska Peninsula began shortly before 0000 UTC on 28 March, or 4:00 pm on 27 March Alaska time (AVO report), as detected by a thermal anomaly (or “hot spot”, yellow to red color enhancement) on Himawari-8 AHI Shortwave Infrared (3.9 µm) images... Read More
![Himawari-8 AHI Shortwave Infrared (3.9 µm) images [click to play animation]](https://cimss.ssec.wisc.edu/satellite-blog/wp-content/uploads/sites/5/2016/03/960x1280_H8F_B7_HIM08_SWIR_PAVLOF_28MAR_2016088_000000_0001PANEL.GIF)
Himawari-8 AHI Shortwave Infrared (3.9 µm) images [click to play animation]
A major eruption of the
Mount Pavlof volcano on the Alaska Peninsula began shortly before 0000 UTC on 28 March, or 4:00 pm on 27 March Alaska time (
AVO report), as detected by a thermal anomaly
(or “hot spot”, yellow to red color enhancement) on Himawari-8
AHI Shortwave Infrared (3.9 µm) images
(above). The hot spot decreased in size and intensity toward the later hours of the day, signaling a lull in the volcanic eruption.
It is interesting to note on a comparison of the 0000 UTC Himawari-8 and GOES-15 Shortwave Infrared (3.9 um) images the large difference in the magnitude of the thermal anomaly — even though the viewing angle was larger for Himawari-8, the superior spatial resolution (2 km at nadir, compared to 4 km with GOES-15) detected a hot spot with an Infrared Brightness Temperature (IR BT) that was 36.6 K warmer (below). The Infrared channels on the GOES-R ABI instrument will also have a 2 km spatial resolution.
![Himawari-8 AHI (left) and GOES-15 Imager (right) 3.9 µm Shortwave Infrared images [click to enlarge]](https://cimss.ssec.wisc.edu/satellite-blog/wp-content/uploads/sites/5/2016/03/160328_0000UTC_HIMAWARI8_GOES15_SHORTWAVE_IR_PAVLOF_AK.GIF)
Himawari-8 AHI (left) and GOES-15 Imager (right) 3.9 µm Shortwave Infrared images [click to enlarge]
With the aid of reflected light from the Moon (in the Waxing Gibbous phase, at 75% of Full), a nighttime view using the Suomi NPP VIIRS Day/Night Band (0.7 µm) from the SSEC RealEarth site (below) revealed the bright glow of the eruption, along with the darker (compared to adjacent meteorological clouds) volcanic ash cloud streaming northeastward. The corresponding VIIRS Shortwave Infrared (3.74 µm) image showed the dark black hot spot of the volcano summit.
![Suomi NPP VIIRS Shortwave Infrared (3.74 µm) and Day/Night Band (0.7 µm) image [click to enlarge]](https://cimss.ssec.wisc.edu/satellite-blog/wp-content/uploads/sites/5/2016/03/160328_1148utc_suomi_npp_viirs_shortwave_ir_day_night_band_Pavlof_AK_anim.gif)
Suomi NPP VIIRS Shortwave Infrared (3.74 µm) and Day/Night Band (0.7 µm) image [click to enlarge]
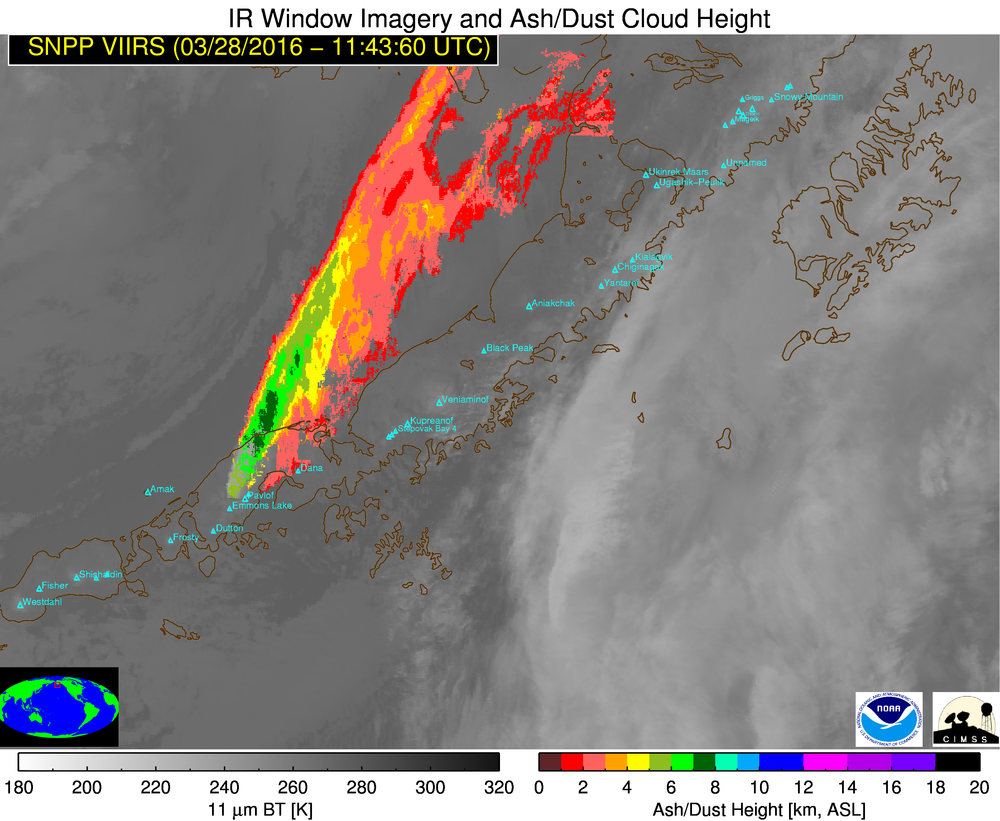
The volcanic ash cloud continued moving in a northeastward direction, as seen in a sequence of GOES-15 Infrared Window (10.7 µm) and either Terra/Aqua MODIS or Suomi NPP VIIRS retrieved Volcanic Ash Height products from the
NOAA/CIMSS Volcanic Could Monitoring site
(below).
![GOES-15 Infrared (10.7 µm) images, with Terra/Aqua MODIS and Suomi NPP VIIRS Ash Height products [click to play animation]](https://cimss.ssec.wisc.edu/satellite-blog/wp-content/uploads/sites/5/2016/03/SNPP.VIIRS.2016-03-28_11-43-60.Ash_Height.Alaskan_Peninsula_750_m.png)
GOES-15 Infrared (10.7 µm) images, with Terra/Aqua MODIS and Suomi NPP VIIRS Ash Height products [click to play animation]
Due to the oblique satellite view angle, the shadow cast by the tall volcanic ash cloud was easily seen on the following early morning (Alaska time) Himawari-8 AHI Visible (0.64 µm) images
(below). A
closer view (courtesy of Dan Lindsey, RAMMB/CIRA) revealed overshooting tops and gravity waves propagating downwind of the eruption site.
![Himawari-8 AHI Visible (0.64 um) images (click to play animation]](https://cimss.ssec.wisc.edu/satellite-blog/wp-content/uploads/sites/5/2016/03/960x1280_H8F_B3_HIM08_VIS_PAVLOF_28MAR_2016088_170000_0001PANEL.GIF)
Himawari-8 AHI Visible (0.64 um) images (click to play animation]
A few select Pilot reports (PIREPs) are shown below, plotted on GOES-15 Infrared Window (10.7 µm) and Aqua MODIS Ash Height derived products. Numerous flights were canceled as the ash cloud eventually began to drift over Western and Interior Alaska (media report).
![GOES-15 Infrared Window (10.7 um) image, with METAR surface reports and Pilot reports [click to enlarge]](https://cimss.ssec.wisc.edu/satellite-blog/wp-content/uploads/sites/5/2016/03/160328_0000utc_goes15_ir_Pavlof_pirep.png)
GOES-15 Infrared Window (10.7 µm) image, with METAR surface reports and Pilot reports [click to enlarge]
![GOES-15 Infrared Window (10.7 um) image, with METAR surface reports and Pilot reports [click to enlarge]](https://cimss.ssec.wisc.edu/satellite-blog/wp-content/uploads/sites/5/2016/03/160328_0100utc_goes15_ir_Pavlof_pirep.png)
GOES-15 Infrared Window (10.7 µm) image, with METAR surface reports and Pilot reports [click to enlarge]
![GOES-15 Infrared Window (10.7 um) image, with METAR surface reports and Pilot reports [click to enlarge]](https://cimss.ssec.wisc.edu/satellite-blog/wp-content/uploads/sites/5/2016/03/160328_0300utc_goes15_ir_Pavlof_pirep.png)
GOES-15 Infrared Window (10.7 µm) image, with METAR surface reports and Pilot reports [click to enlarge]
![Aqua MODIS Ash Height product, with METAR surface reports and Pilot reports [click to enlarge]](https://cimss.ssec.wisc.edu/satellite-blog/wp-content/uploads/sites/5/2016/03/160328_1357utc_modis_ash_height_Pavlof_pirep.png)
Aqua MODIS Ash Height product, with METAR surface reports and Pilot reports [click to enlarge]
![GOES-15 Infrared Window (10.7 um), with METAR surface reports and Pilot reports [click to enlarge]](https://cimss.ssec.wisc.edu/satellite-blog/wp-content/uploads/sites/5/2016/03/160328_1500utc_goes15_ir_Pavlof_pirep.png)
GOES-15 Infrared Window (10.7 µm), with METAR surface reports and Pilot reports [click to enlarge]
A comparison of Suomi NPP VIIRS Shortwave Infrared (3.74 µm), Day/Night Band (0.7 µm), and true-color Red/Green/Blue (RGB) images
(below) showed the volcanic hot spot and the brown to tan colored ash cloud at 2141 UTC on 28 March. Significant ash fall
(as much as 2/3 of an inch) was experienced at the village of Nelson Lagoon, located 55 miles northeast of Pavlof (
media report).
![Suomi NPP VIIRS Shortwave Infrared (3.74 µm), Day/Night Band (0.7 µm), and true-color RGB images [click to enlarge]](https://cimss.ssec.wisc.edu/satellite-blog/wp-content/uploads/sites/5/2016/03/160328_2131utc_snpp_viirs_swir_dnb_truecolor_Pavlof_AK_anim.gif)
Suomi NPP VIIRS Shortwave Infrared (3.74 µm), Day/Night Band (0.7 µm), and true-color RGB images [click to enlarge]
A comparison of the 3 Himawari-8 AHI Water Vapor bands (7.3 µm, 6.9 µm and 6.2 µm) covering the first 14 hours of the eruption from 0000 to 1400 UTC is shown below. Note that the volcanic plume was best seen on the 7.3 µm images, which indicated that it began to move over the coast of Western Alaska after around 0600 UTC; this is due to the fact that the 7.3 µm band is not only a “water vapor absorption” band, but is also sensitive to high levels of SO2 loading in the atmosphere (as was pointed out in
this blog post).
![Himawari-8 AHI Water Vapor 7.3 µm (left), 6.9 µm (center) and 6.2 µm (right) images [click to play animation]](https://cimss.ssec.wisc.edu/satellite-blog/wp-content/uploads/sites/5/2016/03/960x427_AHIM08_B1098_HIM08_WV_3PANEL_PAVLOF_28MAR_2016088_060000_0003PANELS.GIF)
Himawari-8 AHI Water Vapor 7.3 µm (left), 6.9 µm (center) and 6.2 µm (right) images [click to play animation]
View only this post
Read Less
![GOES-13 Visible (0.63 um) images [click to play animation]](https://cimss.ssec.wisc.edu/satellite-blog/wp-content/uploads/sites/5/2016/04/160410_goes13_visible_AR_blowing_dust_anim.gif)
![Time series plot of surface data for Walnut Ridge, Arkansas [click to enlarge]](https://cimss.ssec.wisc.edu/satellite-blog/wp-content/uploads/sites/5/2016/04/160410_KARG_SFCMG.GIF)
![Time series plot of surface data for Newport, Arkansas [click to enlarge]](https://cimss.ssec.wisc.edu/satellite-blog/wp-content/uploads/sites/5/2016/04/160410_KM19_SFCMG.GIF)
![Aqua MODIS Visible (0.65 um) and Normalized Difference Vegetation Index (NDVI) product [click to enlarge]](https://cimss.ssec.wisc.edu/satellite-blog/wp-content/uploads/sites/5/2016/04/160409_1849utc_modis_visible_ndvi_AR_anim.gif)
![Aqua MODIS Normalized Difference Vegetation Index (NDVI) and Land Surface Temperature products [click to enlarge]](https://cimss.ssec.wisc.edu/satellite-blog/wp-content/uploads/sites/5/2016/04/160409_1849utc_modis_lst_ndvi_AR_anim.gif)
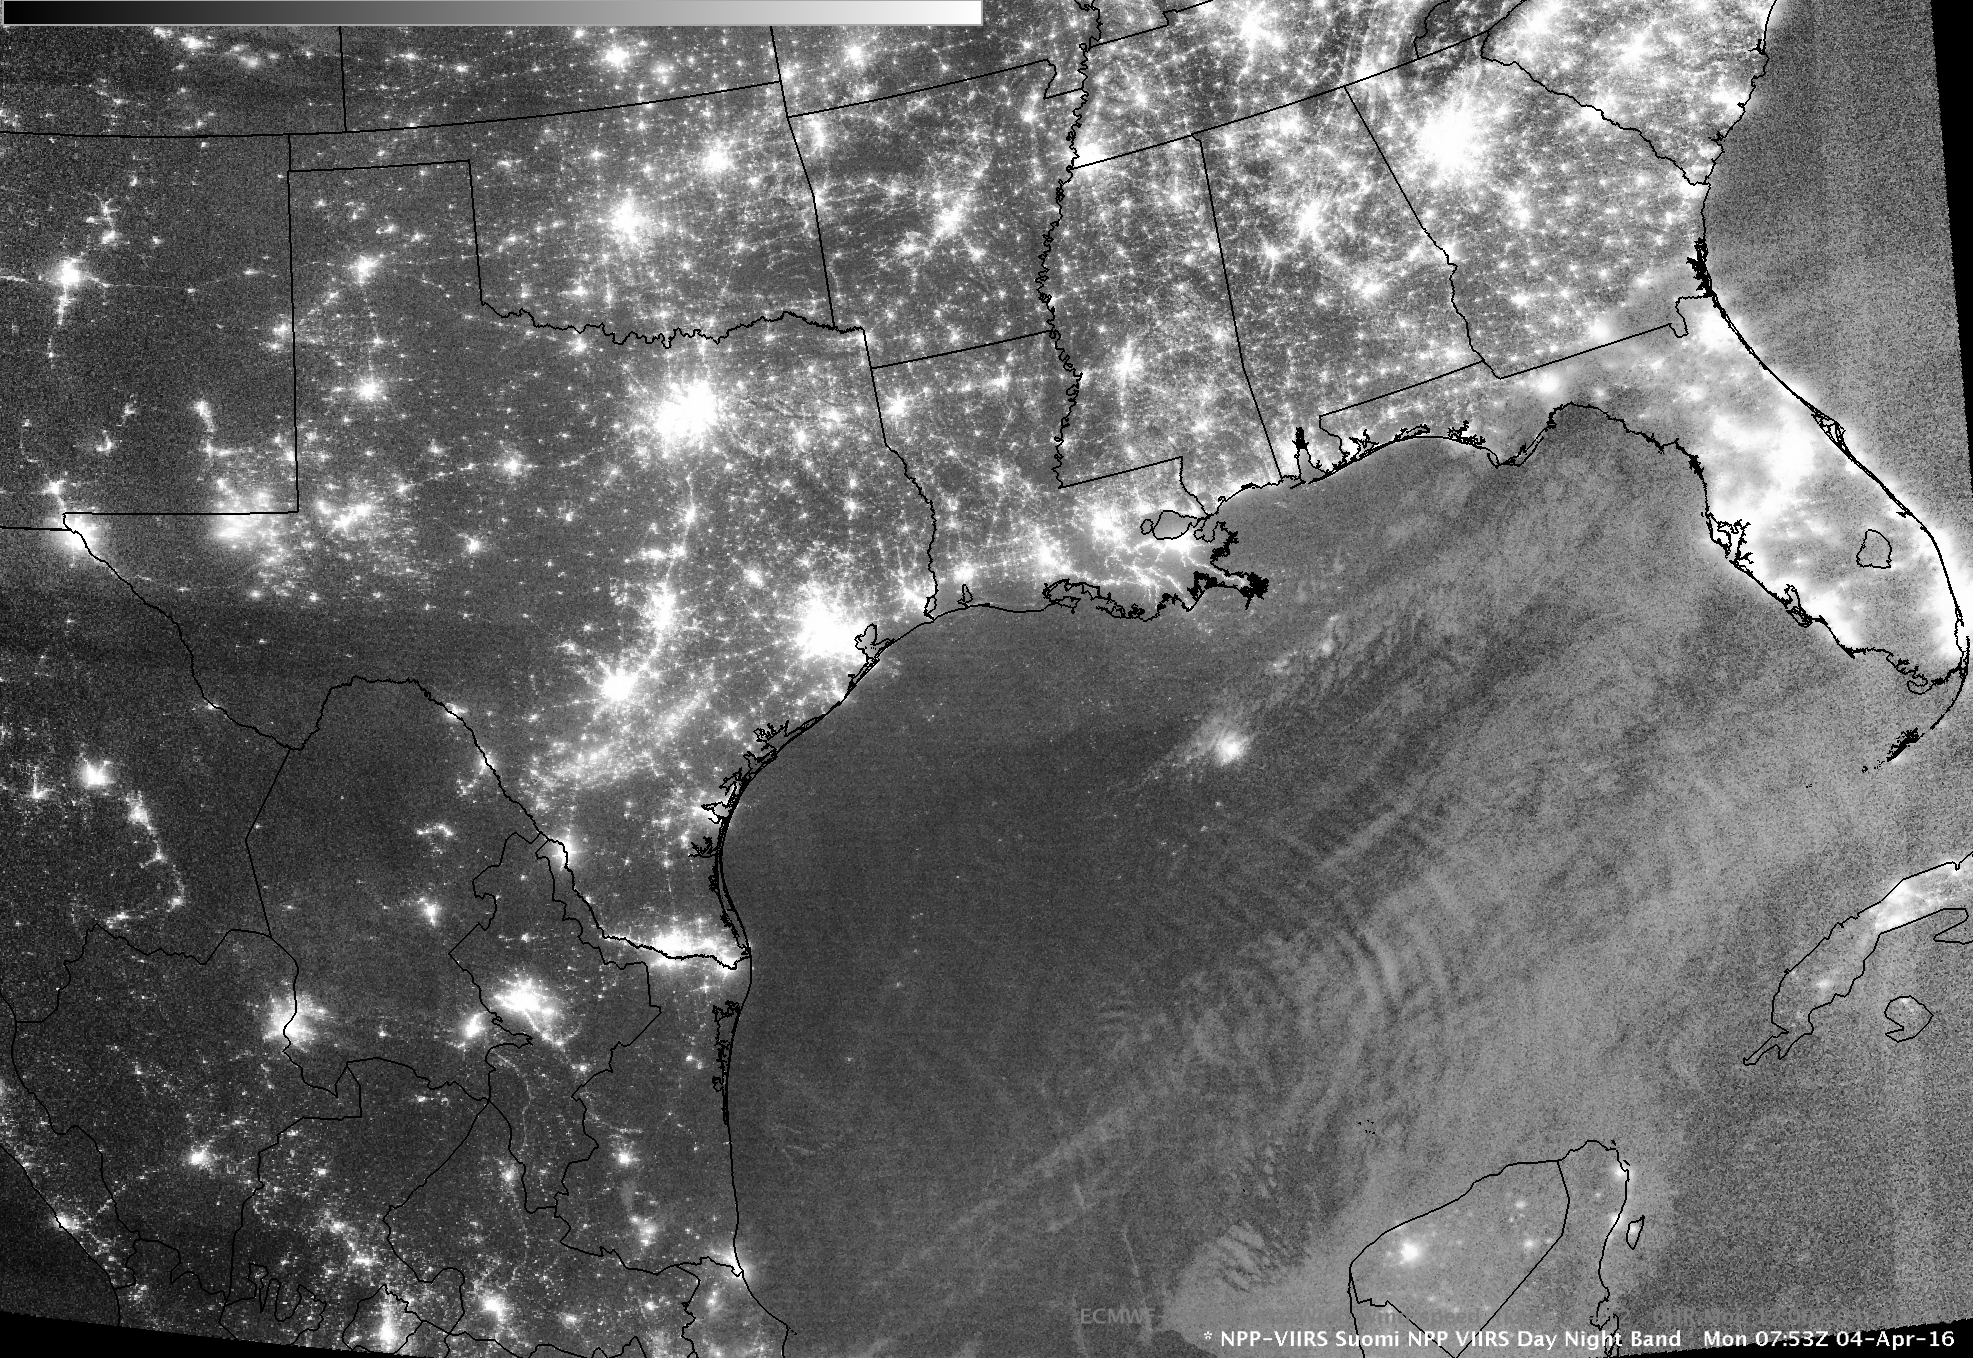
![Suomi NPP VIIRS Day/Night Band (0.7 µm) and Infrared Window (11.45 µm) images, with ECMWF model maximum wind isotachs [click to enlarge]](https://cimss.ssec.wisc.edu/satellite-blog/wp-content/uploads/sites/5/2016/04/160404_0753utc_suomi_npp_viirs_day_night_band_infrared_ecmwf_max_winds_anim.gif)
![GOES-13 Water Vapor (6.5 µm) images, with ECMWF model maximum wind isotachs [click to play animation]](https://cimss.ssec.wisc.edu/satellite-blog/wp-content/uploads/sites/5/2016/04/160403-04_goes13_water_vapor_ecmwf_max_winds_anim.gif)
![GOES-13 Visible (0.63 µm) images, with hourly surface weather symbols [click to play animation]](https://cimss.ssec.wisc.edu/satellite-blog/wp-content/uploads/sites/5/2016/04/160402_goes13_visible_surface_weather_Upper_Midwest_anim.gif)
![MODIS, VIIRS, and AVHRR visible images [click to enlarge]](https://cimss.ssec.wisc.edu/satellite-blog/wp-content/uploads/sites/5/2016/04/160402_modis_viirs_avhrr_visible_Upper_Midwest_snow_squalls_anim.gif)
![GOES-13 Water Vapor (6.5 µm) images with hourly wind gusts in knots [click to play animation]](https://cimss.ssec.wisc.edu/satellite-blog/wp-content/uploads/sites/5/2016/04/160402_goes13_water_vapor_wind_gusts_Upper_Midwest_anim.gif)
![GOES-13 Water Vapor (6.5 µm) images with METAR surface reports, surface fronts, and NAM40 500 hPa wind isotachs [click to play animation]](https://cimss.ssec.wisc.edu/satellite-blog/wp-content/uploads/sites/5/2016/04/160402_goes13_water_vapor_metars_Upper_Midwest_snow_squalls_awips_anim.gif)
![GOES-13 Infrared Window (10.7 µm) images, with hourly surface weather symbols [click to play animation]](https://cimss.ssec.wisc.edu/satellite-blog/wp-content/uploads/sites/5/2016/04/160402_goes13_infrared_surface_weather_Upper_Midwest_anim.gif)
![24-hour snowfall amounts (in inches) ending at 12 UTC on 02 and 03 April [click to enlarge]](https://cimss.ssec.wisc.edu/satellite-blog/wp-content/uploads/sites/5/2016/04/160402-03_24hour_snowfall_anim.gif)
![Himawari-8 AHI Shortwave Infrared (3.9 µm) images [click to play animation]](https://cimss.ssec.wisc.edu/satellite-blog/wp-content/uploads/sites/5/2016/03/160327-28_himawari8_shortwave_infrared_Pavlof_AK_anim.gif)
![GOES-15 Infrared (10.7 µm) images, with Terra/Aqua MODIS and Suomi NPP VIIRS Ash Height products [click to play animation]](https://cimss.ssec.wisc.edu/satellite-blog/wp-content/uploads/sites/5/2016/03/160328_goes15_Pavlof_AK_modis_viirs_ash_height_anim2.gif)
![Himawari-8 AHI Visible (0.64 um) images (click to play animation]](https://cimss.ssec.wisc.edu/satellite-blog/wp-content/uploads/sites/5/2016/03/160328_himawari8_visible_Pavlof_AK_anim2.gif)
![Himawari-8 AHI Water Vapor 7.3 µm (left), 6.9 µm (center) and 6.2 µm (right) images [click to play animation]](https://cimss.ssec.wisc.edu/satellite-blog/wp-content/uploads/sites/5/2016/03/160328_himawari8_water_vapor_bands_Pavlof_AK_nomap_anim.gif)
