Note: Matthew was upgraded to a Hurricane at 1800 UTC on 29 September. See the National Hurricane Center Website for the latest information.
![GOES-13 Visible (0.63 µm) and shortwave Infrared (3.9 µm) at 6-hour intervals, 23-28 September 2016 [Click to animate]](https://cimss.ssec.wisc.edu/satellite-blog/wp-content/uploads/sites/5/2016/09/TS_MATTHEW_23-28SepStepanim.gif)
GOES-13 Visible (0.63 µm) and shortwave Infrared (3.9 µm) at 6-hour intervals, 23-28 September 2016 [Click to animate]
![Morphed MIRS Total Precipitable Water, 25-28 September 2016 [Click to animate]](https://cimss.ssec.wisc.edu/satellite-blog/wp-content/uploads/sites/5/2016/09/MIMICTPW2_comp2016_0925_0928anim.gif)
Morphed MIRS Total Precipitable Water, 25-28 September 2016 [Click to animate]
![Observed Sea Surface Temperatures and Oceanic Heat Content [Click to enlarge]](https://cimss.ssec.wisc.edu/satellite-blog/wp-content/uploads/sites/5/2016/09/SST_OHC_valuestoggle.gif)
Observed Sea Surface Temperatures and Oceanic Heat Content [Click to enlarge]
![Wind Shear, 1500 UTC on 28 September [Click to enlarge]](https://cimss.ssec.wisc.edu/satellite-blog/wp-content/uploads/sites/5/2016/09/1500UTC_28Sep_wg8shr.GIF)
Wind Shear, 1500 UTC on 28 September [Click to enlarge]
![GOES-13 Infrared (10.7 µm) imagery, 1445-2045 UTC on 28 September 2016 [Click to animate]](https://cimss.ssec.wisc.edu/satellite-blog/wp-content/uploads/sites/5/2016/09/GOES13_IR4_1445_2045_28Sep2016animg.gif)
GOES-13 Infrared (10.7 µm) imagery, 1445-2045 UTC on 28 September 2016 [Click to animate]
============== Added, 29 September 2016 =================
Suomi NPP overflew the eastern Caribbean early on 29 September, and the Day Night Band imagery, below, (from RealEarth) shows Matthew west of the Windward Islands. A lone lightning strike is visible in the convective clouds. There appears in this very low light image to be a low-level circulation exposed to the west of the deep clouds, suggesting a sheared storm.
![Suomi NPP Day Night Band Visible (0.70 µm) imagery, ~0540 UTC on 29 September 2016 [Click to enlarge]](https://cimss.ssec.wisc.edu/satellite-blog/wp-content/uploads/sites/5/2016/09/DNB_29Sept2016.png)
Suomi NPP Day Night Band Visible (0.70 µm) imagery, ~0540 UTC on 29 September 2016 [Click to enlarge]
A GOES-13 Visible Image animation from just after sunrise shows a the circulation center exposed to the west of the deep convection.
![GOES-13 Visible (0.63 µm) imagery, 1045-1245 UTC on 29 September 2016 [Click to enlarge]](https://cimss.ssec.wisc.edu/satellite-blog/wp-content/uploads/sites/5/2016/09/G13_MATTHEW_1045_1245anim_29SEP2016.gif)
GOES-13 Visible (0.63 µm) imagery, 1045-1245 UTC on 29 September 2016 [Click to enlarge]
NOAA-19 overflew Matthew at about 1900 UTC on 29 September 2016, shortly after the storm was upgraded to a Hurricane, and visible imagery from that pass (data courtesy of the AOML Direct Broadcast antenna) shows far less evidence of a sheared storm. The Central Dense Overcast is above the surface circulation.
![NOAA-19 Visible (0.63 µm) imagery, 1931 UTC on 29 September 2016 [Click to enlarge]](https://cimss.ssec.wisc.edu/satellite-blog/wp-content/uploads/sites/5/2016/09/noaa19_avhrr_band2_vis_20160929_193127_14L_MATTHEW.png)
NOAA-19 Visible (0.63 µm) imagery, 1931 UTC on 29 September 2016 [Click to enlarge]
View only this post Read Less
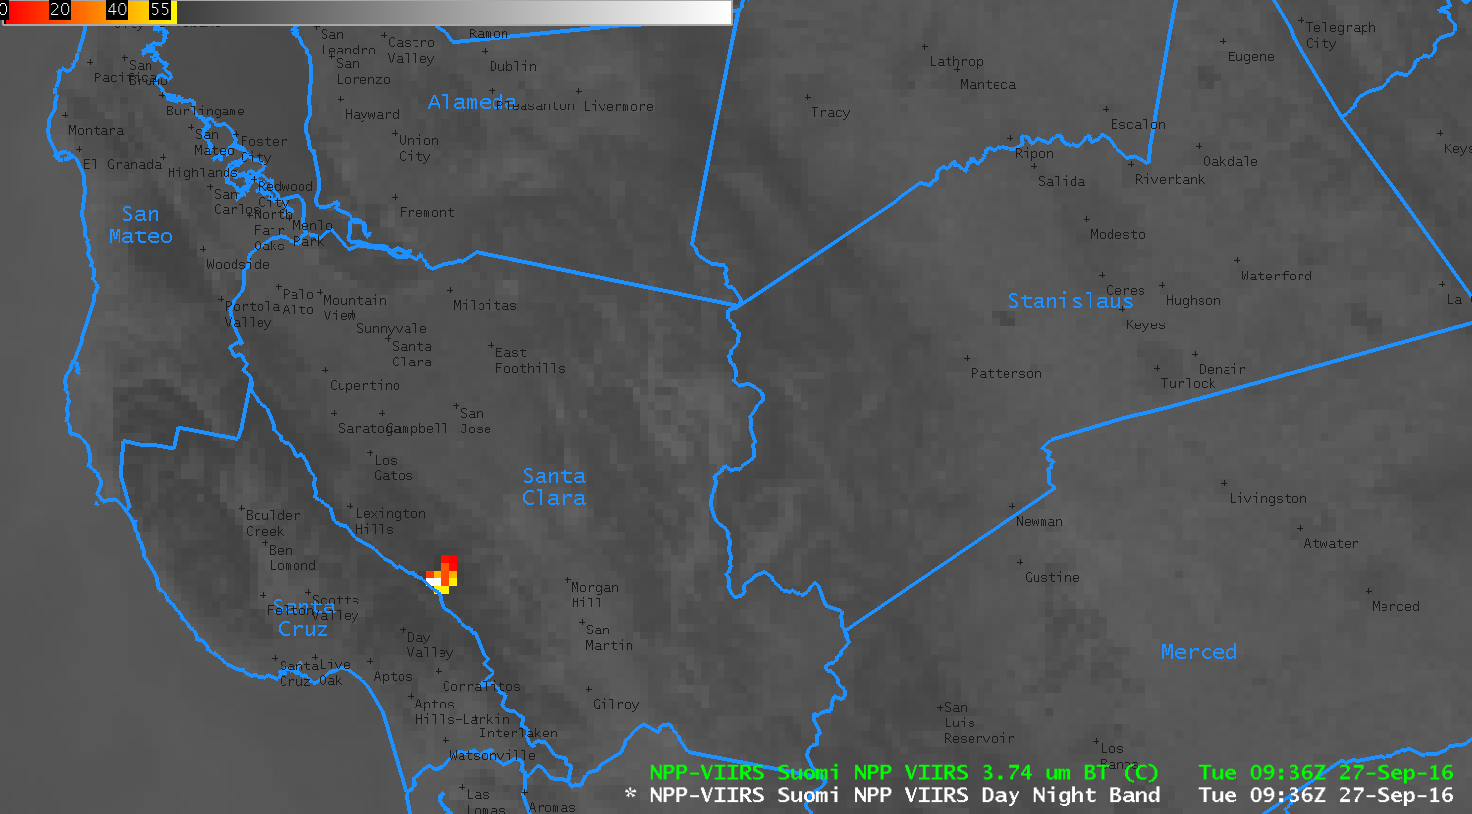
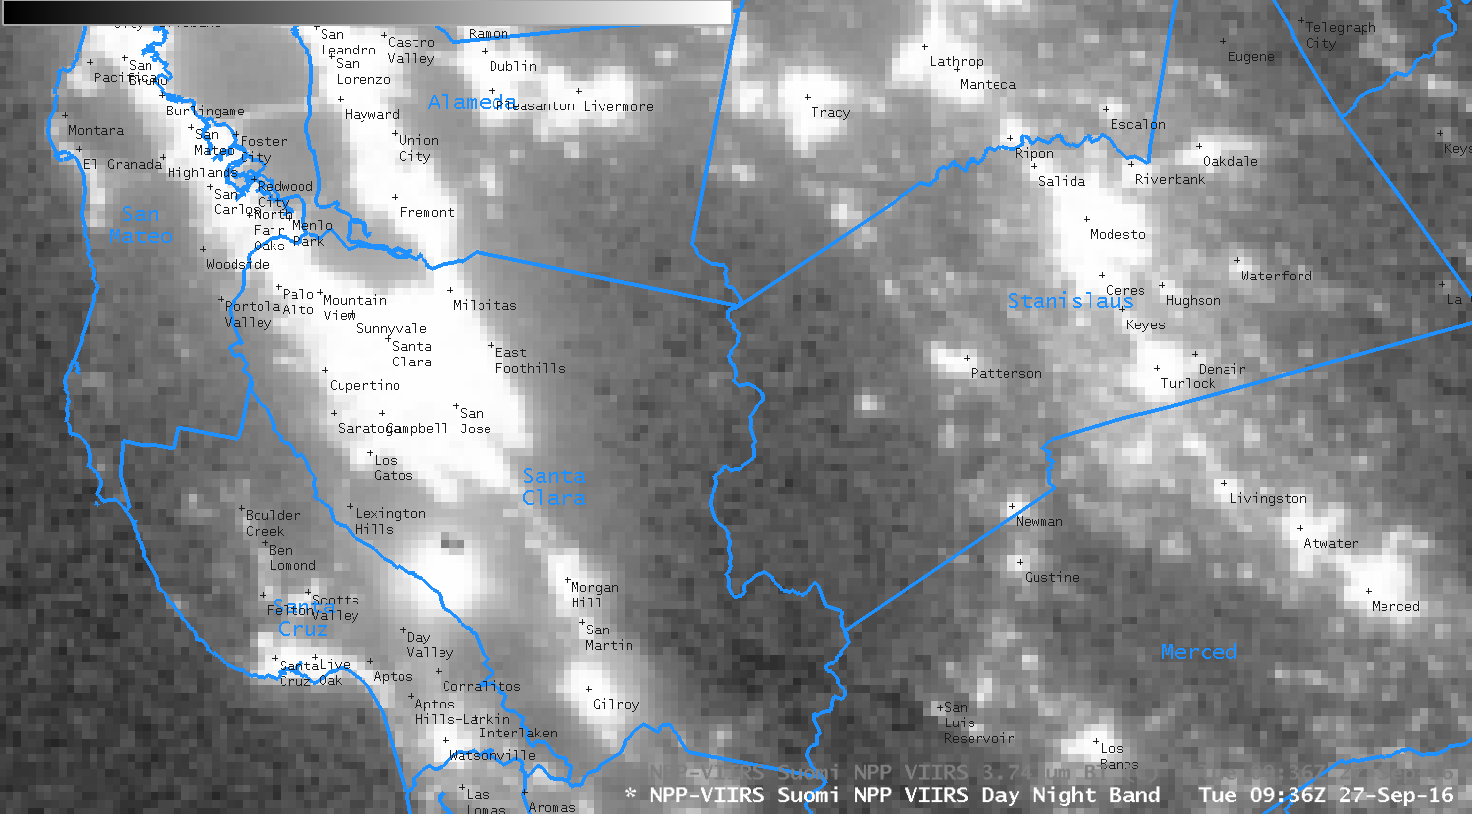
![Suomi NPP VIIRS imagery from the Day/Night Band visible (0.70 µm) and Infrared (3.74 µm) at 0936 UTC on 27 September, and terrain [Click to enlarge]](https://cimss.ssec.wisc.edu/satellite-blog/wp-content/uploads/sites/5/2016/09/NPP_DNB_3.74_0936_27Sep2016toggle.gif)
![GOES-15 shortwave infrared (3.9 µm) imagery from 0500 UTC through 1500 UTC on 27 September [Click to animate]](https://cimss.ssec.wisc.edu/satellite-blog/wp-content/uploads/sites/5/2016/09/GOES15_IR2_27SEP2016_anim_0500_1530UTC.gif)
![GOES-15 visible (0.62 µm) imagery from 1430 to 1530 UTC on 27 September [Click to enlarge]](https://cimss.ssec.wisc.edu/satellite-blog/wp-content/uploads/sites/5/2016/09/GOES15_VIS_27SEP2016_anim.gif)
![Himawari-8 0.64 µm Visible (top) and 10.4 µm Infrared Window (bottom) images [click to play MP4 animation]](https://cimss.ssec.wisc.edu/satellite-blog/wp-content/uploads/sites/5/2016/09/480x1280_H8F_B313_HIM08_VIS_IR_MEGI_27SEP2016_2016270_225215_0002PANELS.GIF)
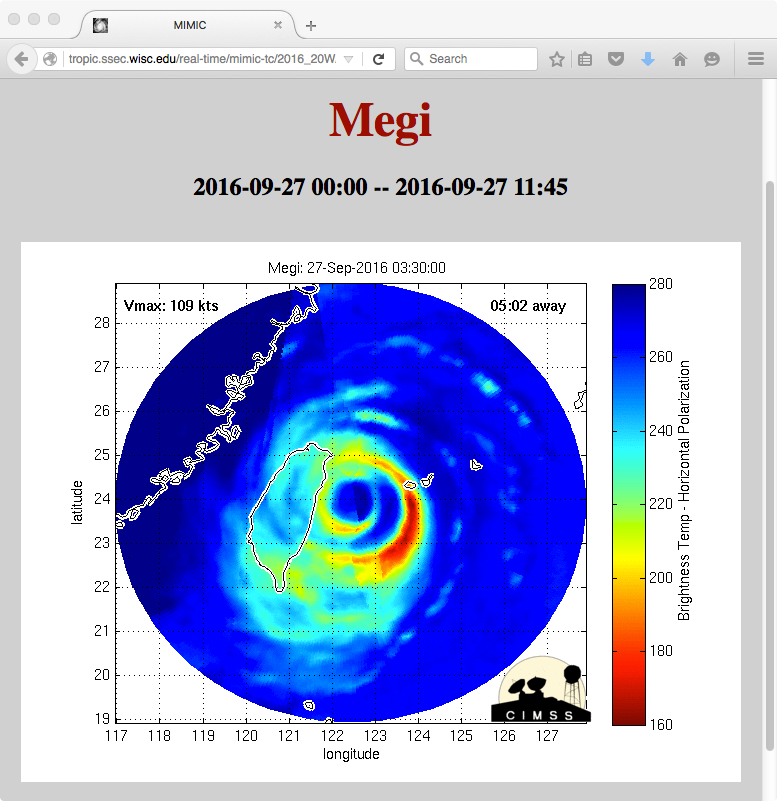
![MIMIC-TC product [click to play animation]](https://cimss.ssec.wisc.edu/satellite-blog/wp-content/uploads/sites/5/2016/09/160927_megi_mimic_tc_Taiwan_landfall.gif)
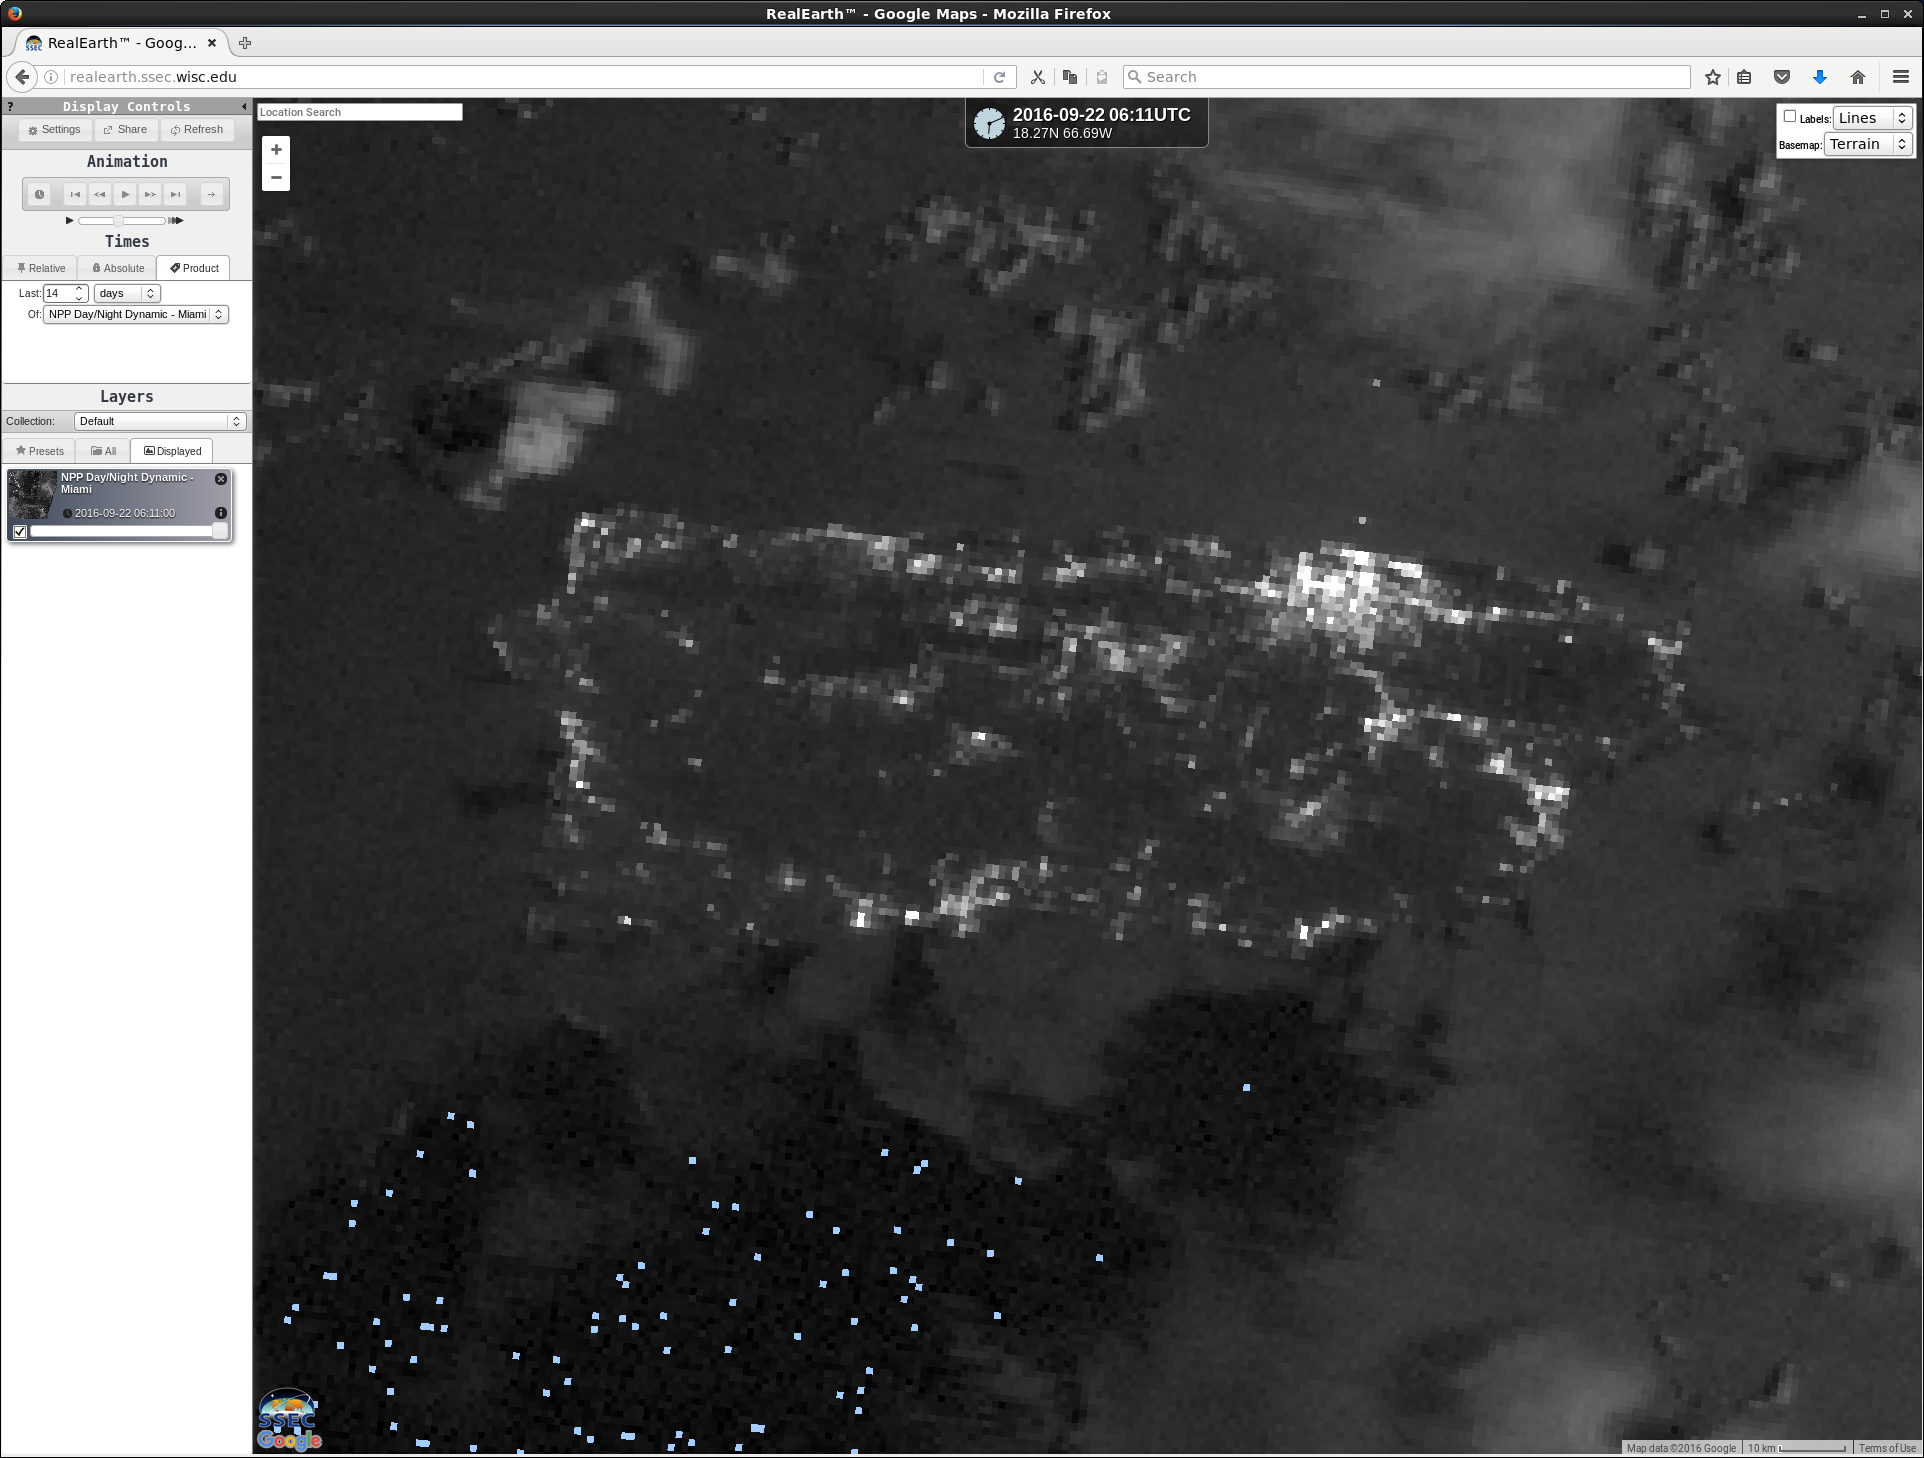
![Suomi NPP VIIRS Day/Night Band (0.7 um) images: cloud-free "clear view" (31 Dec 2015) vs 22 September and 23 September 2016 [click to enlarge]](https://cimss.ssec.wisc.edu/satellite-blog/wp-content/uploads/sites/5/2016/09/160922-23_suomi_npp_viirs_day_night_band_Puerto_Rico_power_outage_anim.gif)
