The Day/Night Band is a component of the VIIRS Instrument on board Suomi NPP, and it allows for satellite views in the visible portion of the electromagnetic spectrum at night. The nighttime light source is the Moon (if it is above the horizon), or airglow if not (or if the... Read More
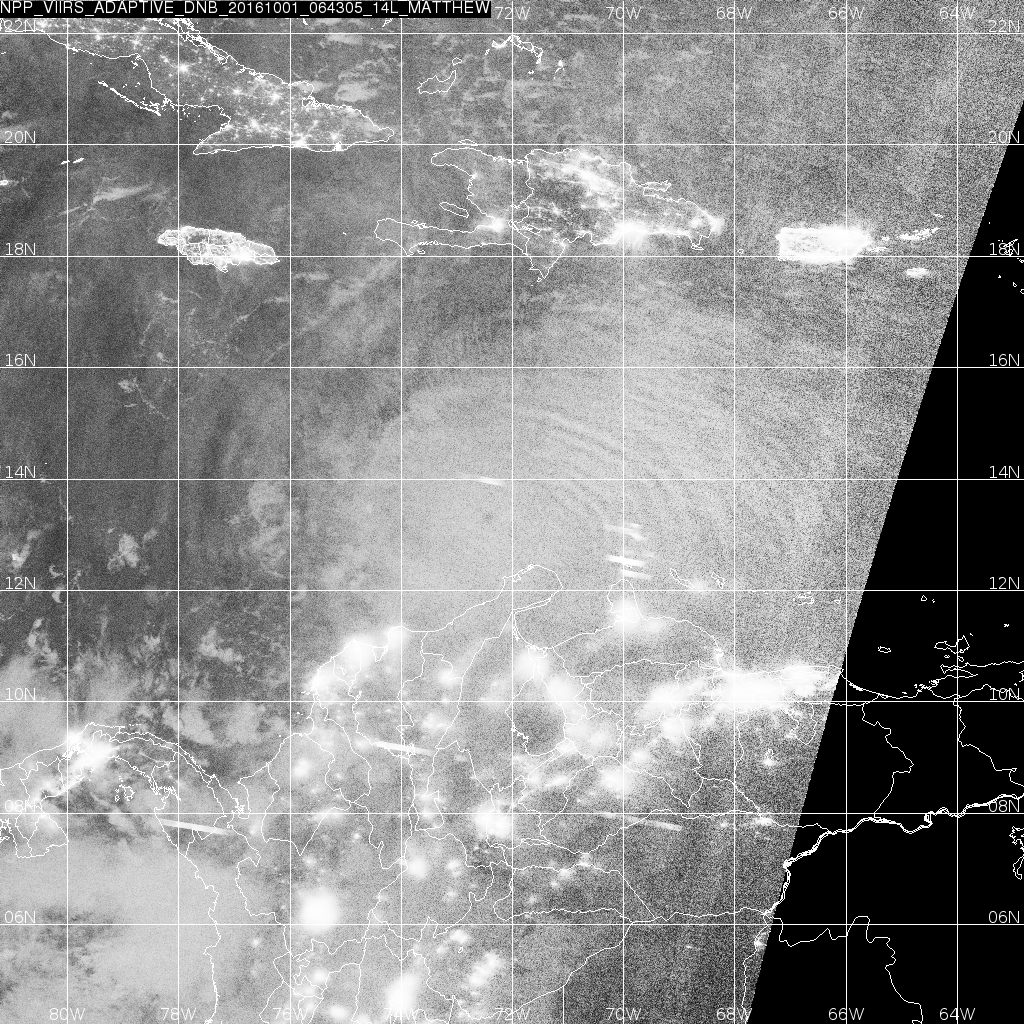
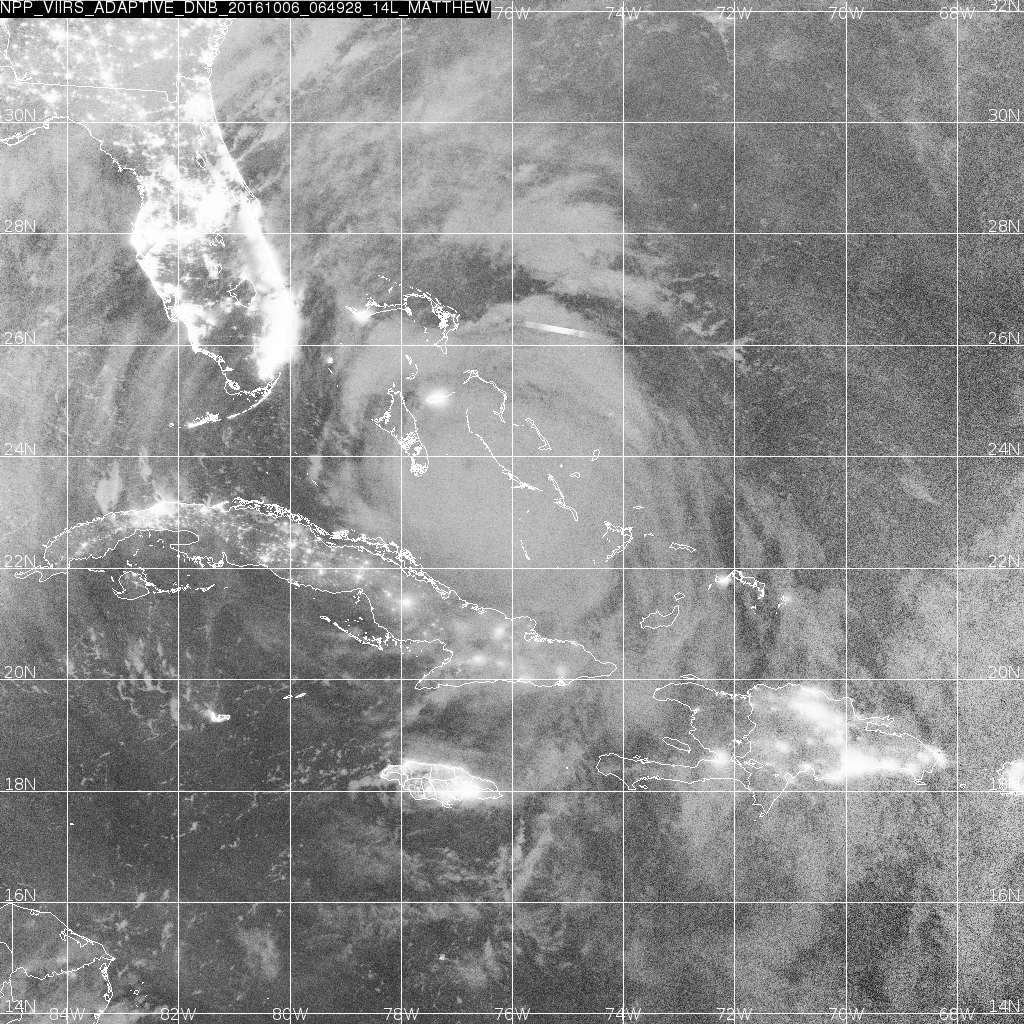
Day/Night Band Visible Imagery (0.70 µm) from VIIRS on Suomi NPP, 0643 UTC on 1 October (Click to enlarge)
The Day/Night Band is a component of the VIIRS Instrument on board Suomi NPP, and it allows for satellite views in the visible portion of the electromagnetic spectrum at night. The nighttime light source is the Moon (if it is above the horizon), or airglow if not (or if the Moon is new). When Suomi NPP overflew Matthew early in the morning on 1 and 2 October, shortly after the New Moon (on 30 September), only airglow was illuminating the storm. Those images are shown above (for 1 October 2016) and below (for 2 October 2016). This imagery was produced using Polar2Grid software that is part of the CSPP Package using data received at a direct broadcast site (in this case, Miami).
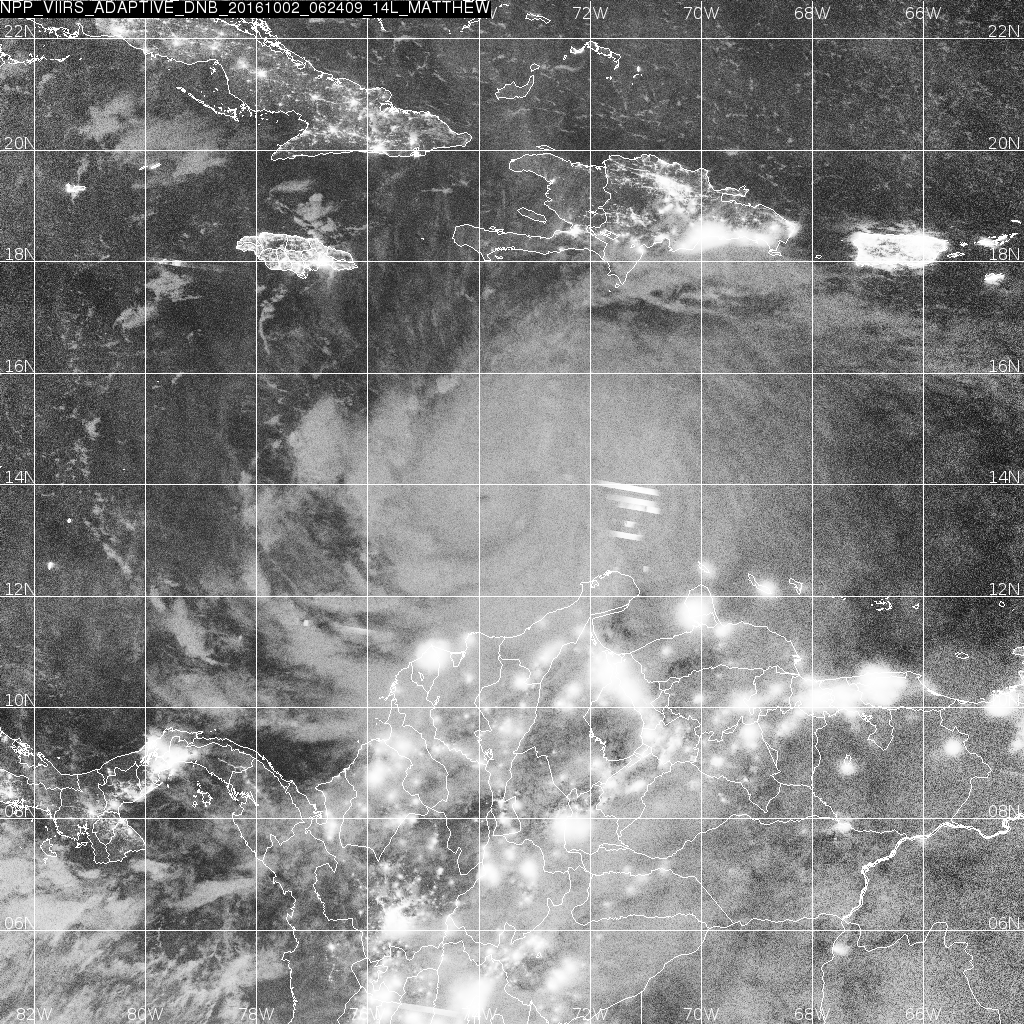
There are striking mesospheric airglow gravity waves evident to the east and north of the center on 1 October, at which time Matthew was a Category 5 storm on the Saffir-Simpson scale, having undergone remarkable intensification during the previous 24 hours. On October 2, the gravity waves are not quite so apparent (at this time, the storm was a Category 4 storm). Are the gravity waves a response to the strong intensification?
Lightning streaks are present to the east of the center, within the cluster of deep convection east of Matthew, in both images. City lights on the islands of the Greater Antilles, and over the South American landmass, are also apparent. Haiti is notable for its minimal signature of city lights.
Day/Night Band Visible Imagery (0.70 µm) from VIIRS on Suomi NPP, 0624 UTC on 2 October (Click to enlarge)
Matthew is forecast to affect Jamaica, eastern Cuba and Haiti on Monday and Tuesday, 3 and 4 October. Consult the website of the National Hurricane Center for more information.
Day/Night Band imagery will be available from JPSS-1, scheduled for launch no earlier than March 2017. After its launch, both Suomi NPP and JPSS-1 will provide Day/Night Band imagery. JPSS-2, -3 and -4 (scheduled for launch in 2021, 2026 and 2031, respectively), will also have a Day/Night Band capability. There are currently no plans for a geostationary Day/Night Band capability (In particular, GOES-R does not have a Day/Night Band).
======================== Added, 3 October =======================The Day/Night Band image from early on 3 October, below, also shows evidence of gravity waves that are perturbing the airglow, and of lightning in the convective complex well east of the center of Matthew.
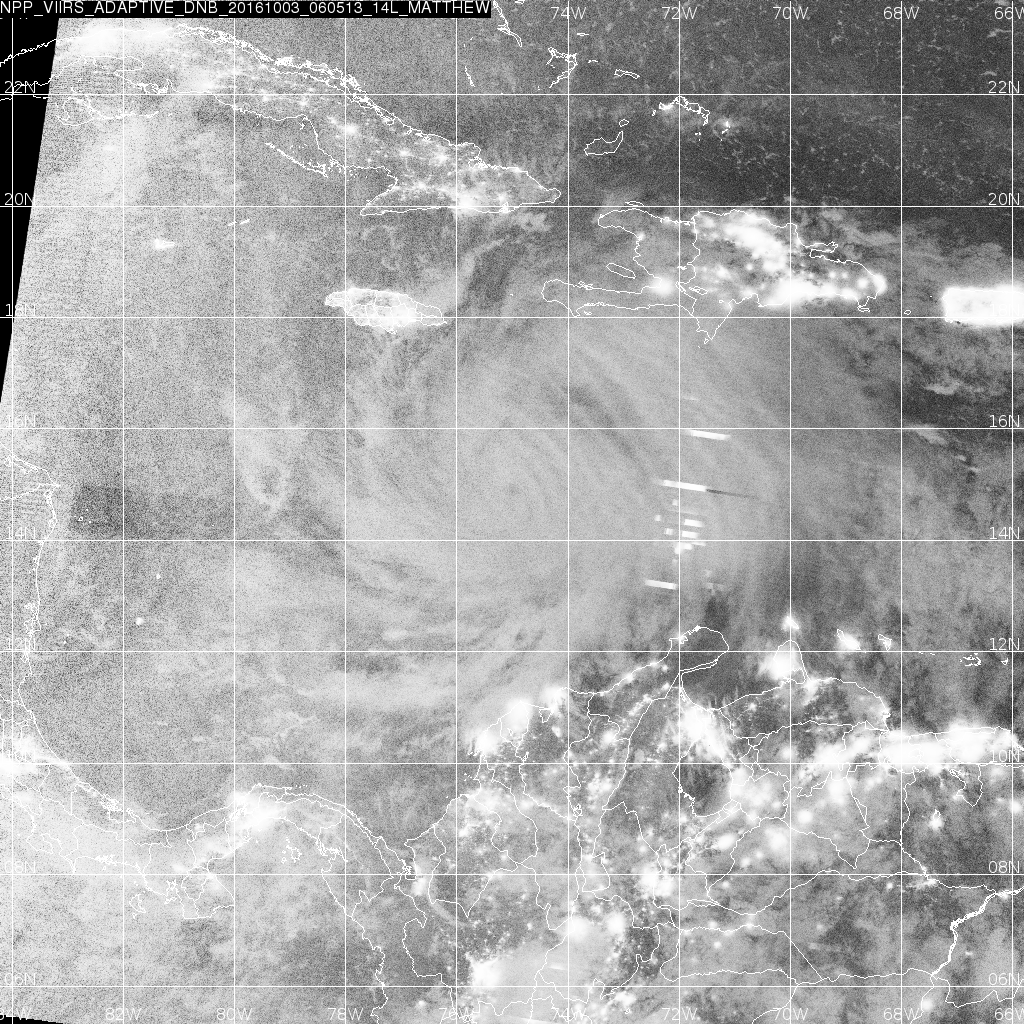
Day/Night Band Visible Imagery (0.70 µm) from VIIRS on Suomi NPP, 0605 UTC on 3 October (Click to enlarge)
Shown below is the same VIIRS Day/Night Band image, as viewed using AWIPS II with data received by the Puerto Rico ground station.
![Suomi NPP VIIRS Day/Night Band (0.70 µm) image [Click to enlarge]](https://cimss.ssec.wisc.edu/satellite-blog/wp-content/uploads/sites/5/2016/10/viirs_dnb-20161003_060750.png)
Suomi NPP VIIRS Day/Night Band (0.70 µm) image [Click to enlarge]
The
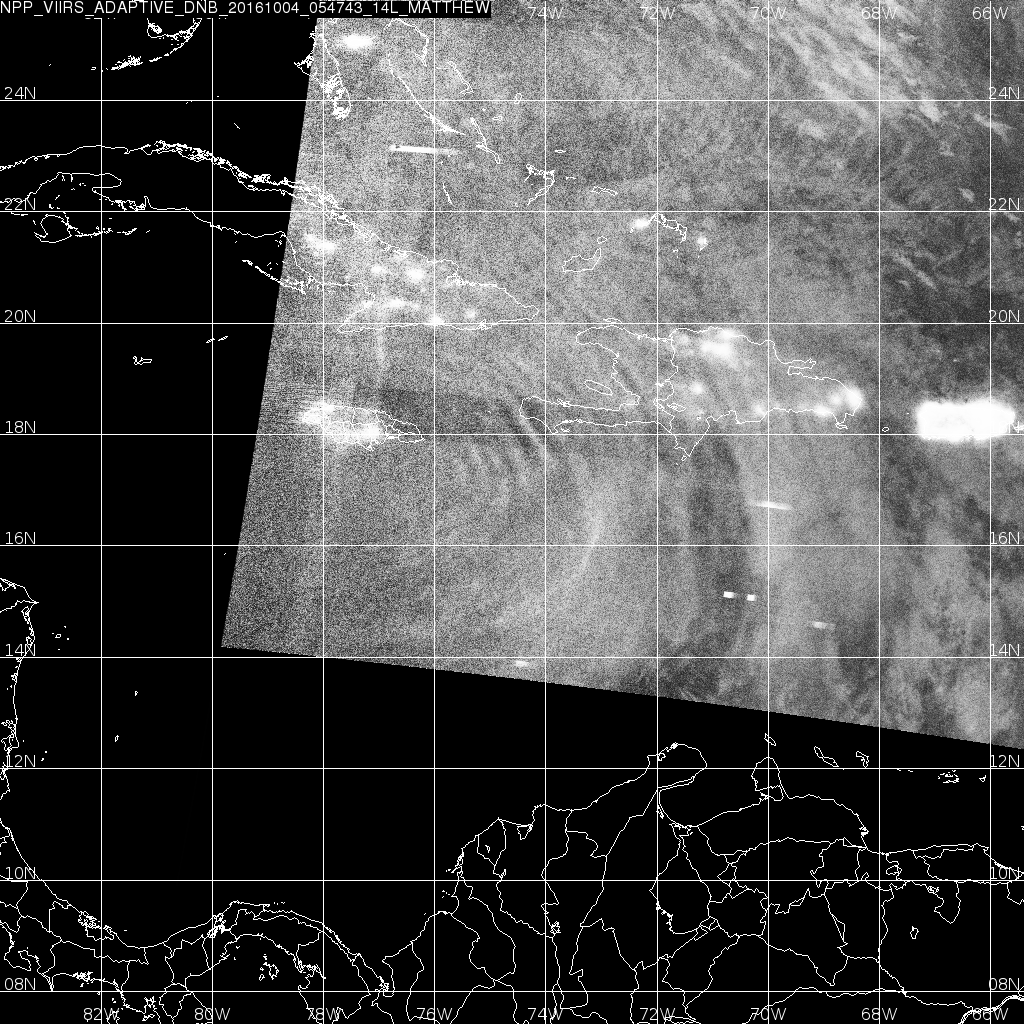
Day/Night Band early on 4 October continues to show gravity waves in the airglow. Note how city lights in Haiti are mostly absent in this image. This could be due to attenuation by the rain in the hurricane bands, or it could be due to infrastructure failure (or both).
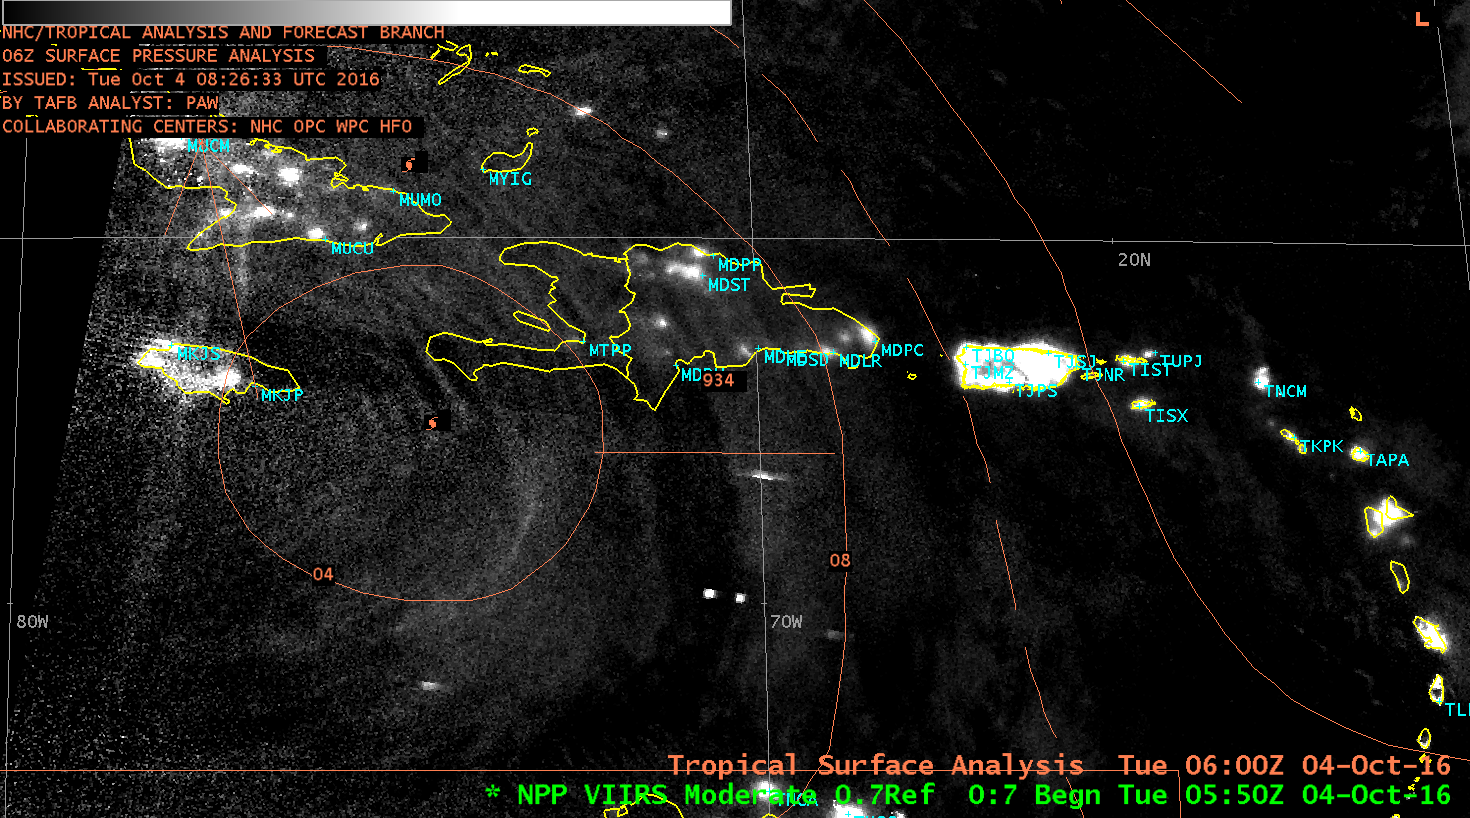
Day/Night Band Visible Imagery (0.70 µm) from VIIRS on Suomi NPP at 0550 UTC on 4 October (Click to enlarge)
(also shown below). The ragged center of Matthew is barely visible over the water north of eastern Cuba. Haiti continues to show no man-made light sources. Parts of western Dominican Republic also show no lights. In both places, thick clouds and heavy rain may be the reason.
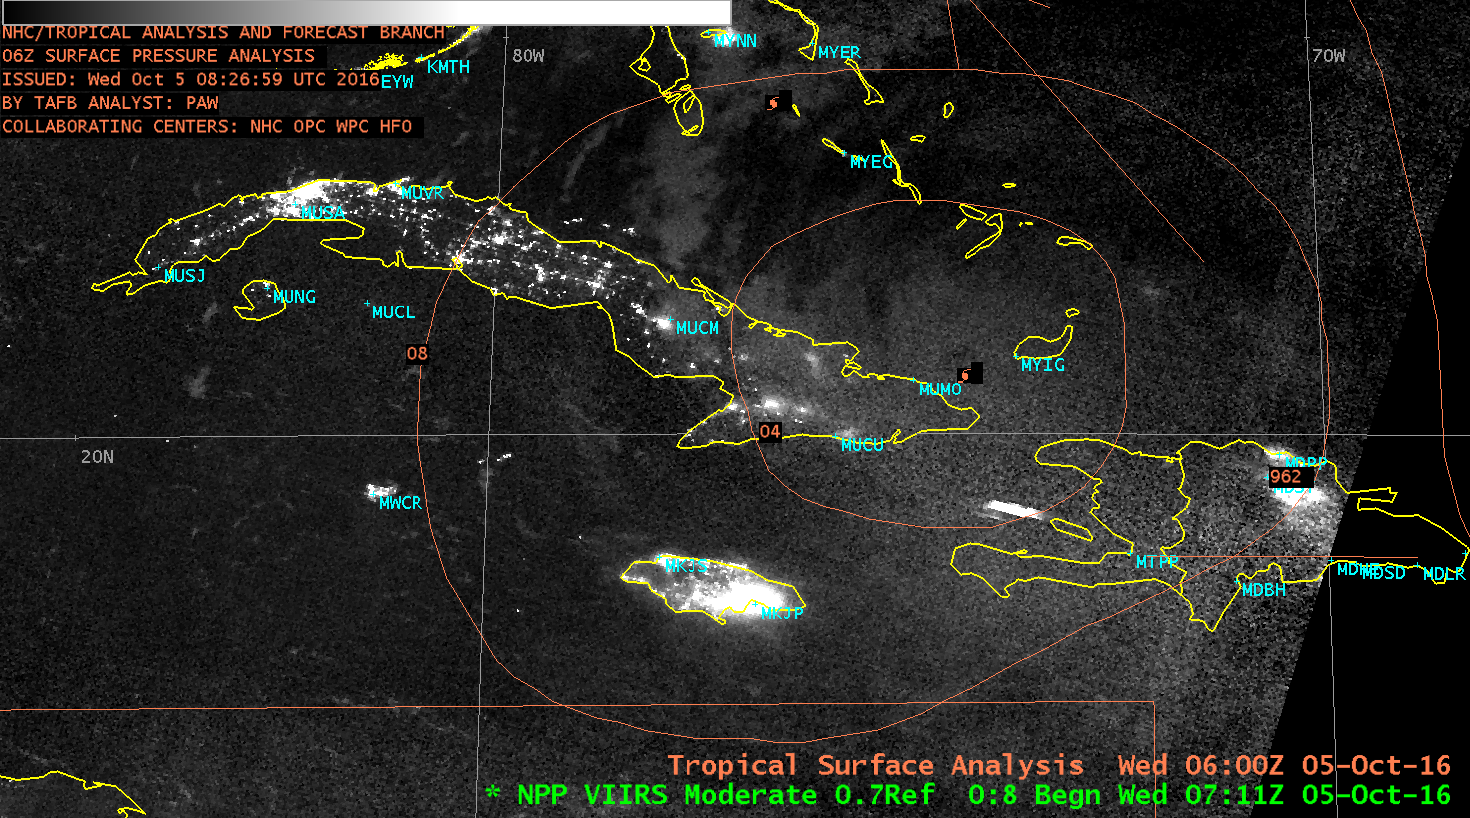
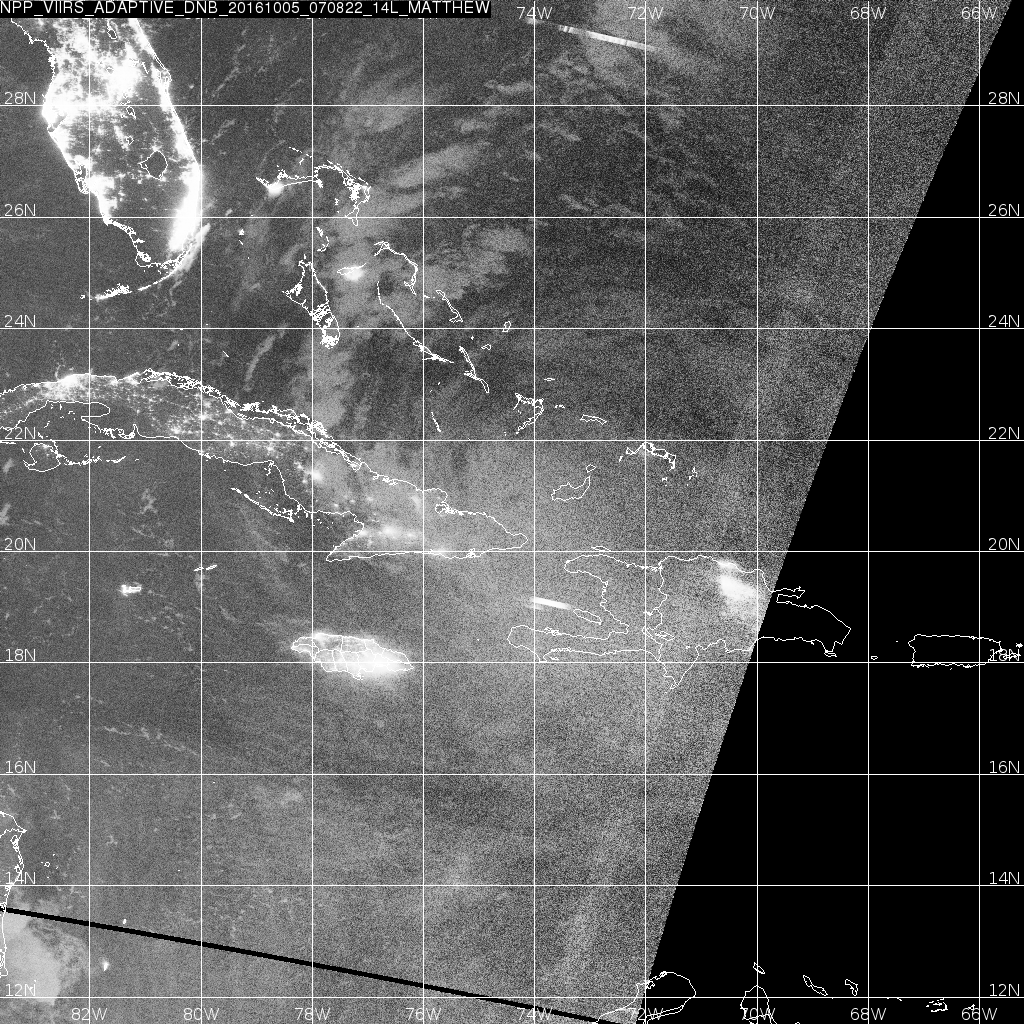
Day/Night Band Visible Imagery (0.70 µm) from VIIRS on Suomi NPP at 0711 UTC on 5 October (Click to enlarge)
, with a different version shown below. The center of Matthew is apparent east of the island of Andros in the Bahamas. Note that city lights have returned to Port-au-Prince, Haiti (station MTPP), but they’ve vanished from several Bahama islands. In the
zoomed-out version of the Day/Night Band that includes the United States, increased illumination is apparent over the western Gulf of Mexico. The Moon is starting to appear near the horizon during NPP’s overpass; increased illumination in these images should be the result in the next couple days.
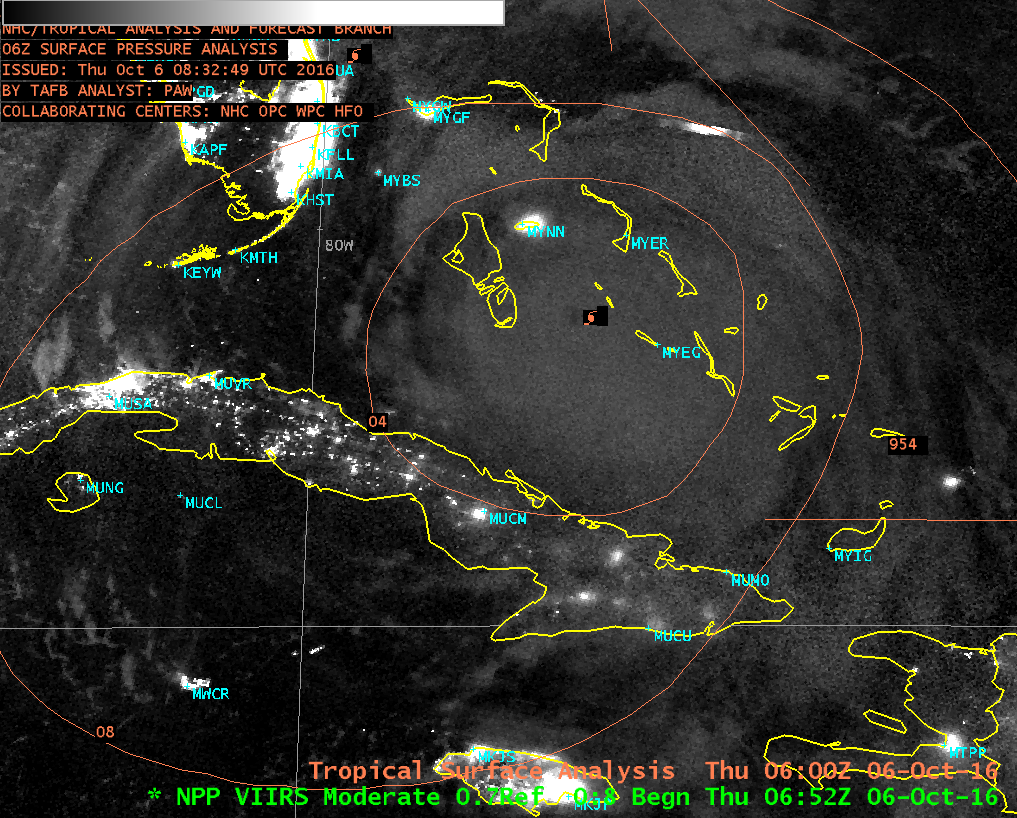
Day/Night Band Visible Imagery (0.70 µm) from VIIRS on Suomi NPP at 0652 UTC on 5 October (Click to enlarge)
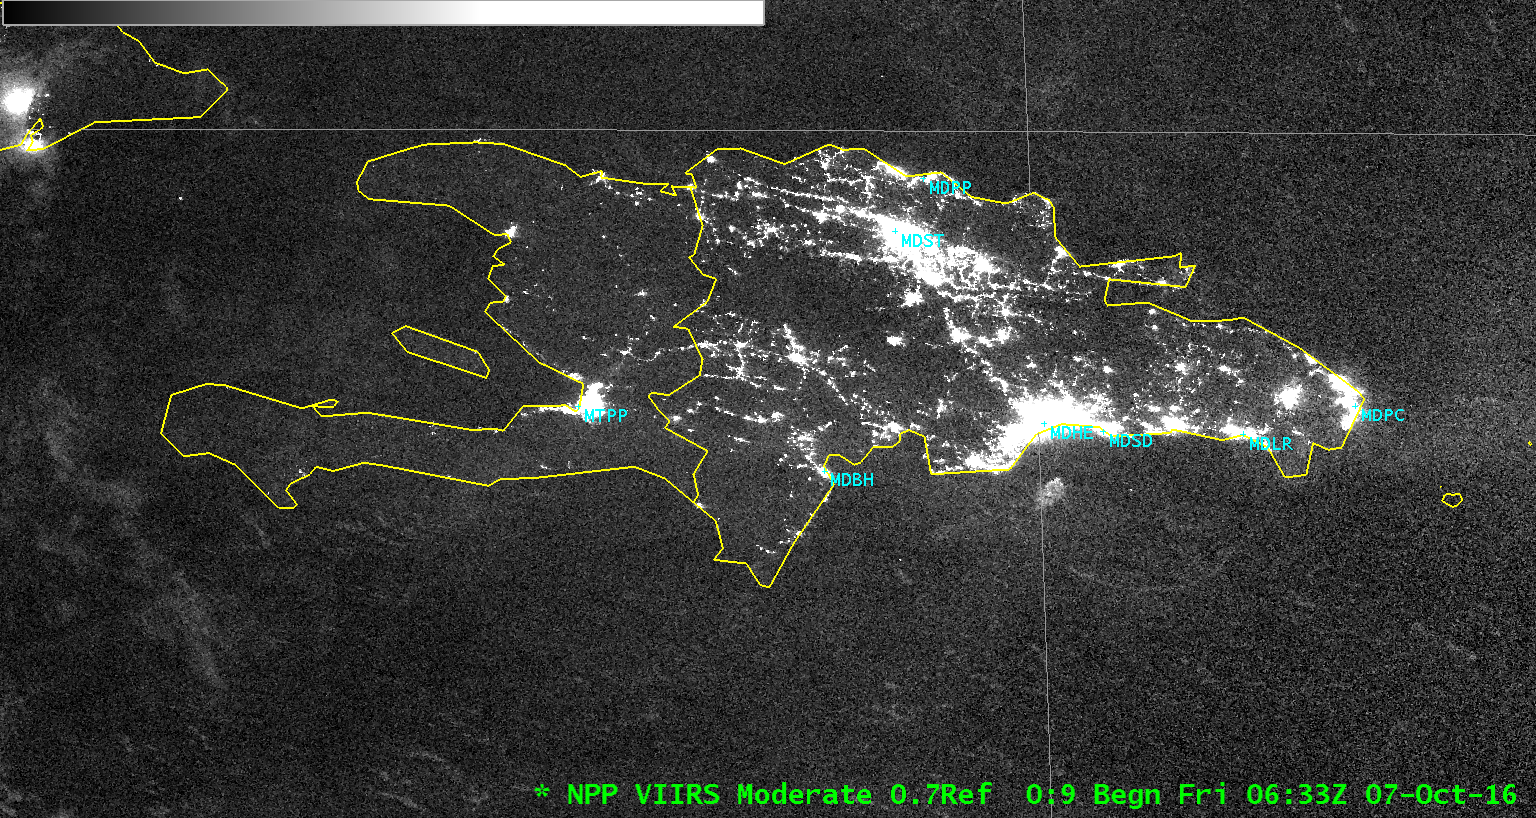
At 0633 UTC on 7 October, Matthew was located east of the Atlantic coast of Florida. Lightning streaks are apparent well to the east of the center. This Day/Night Band image centered over Haiti shows that electricity has been restored to most of the island.
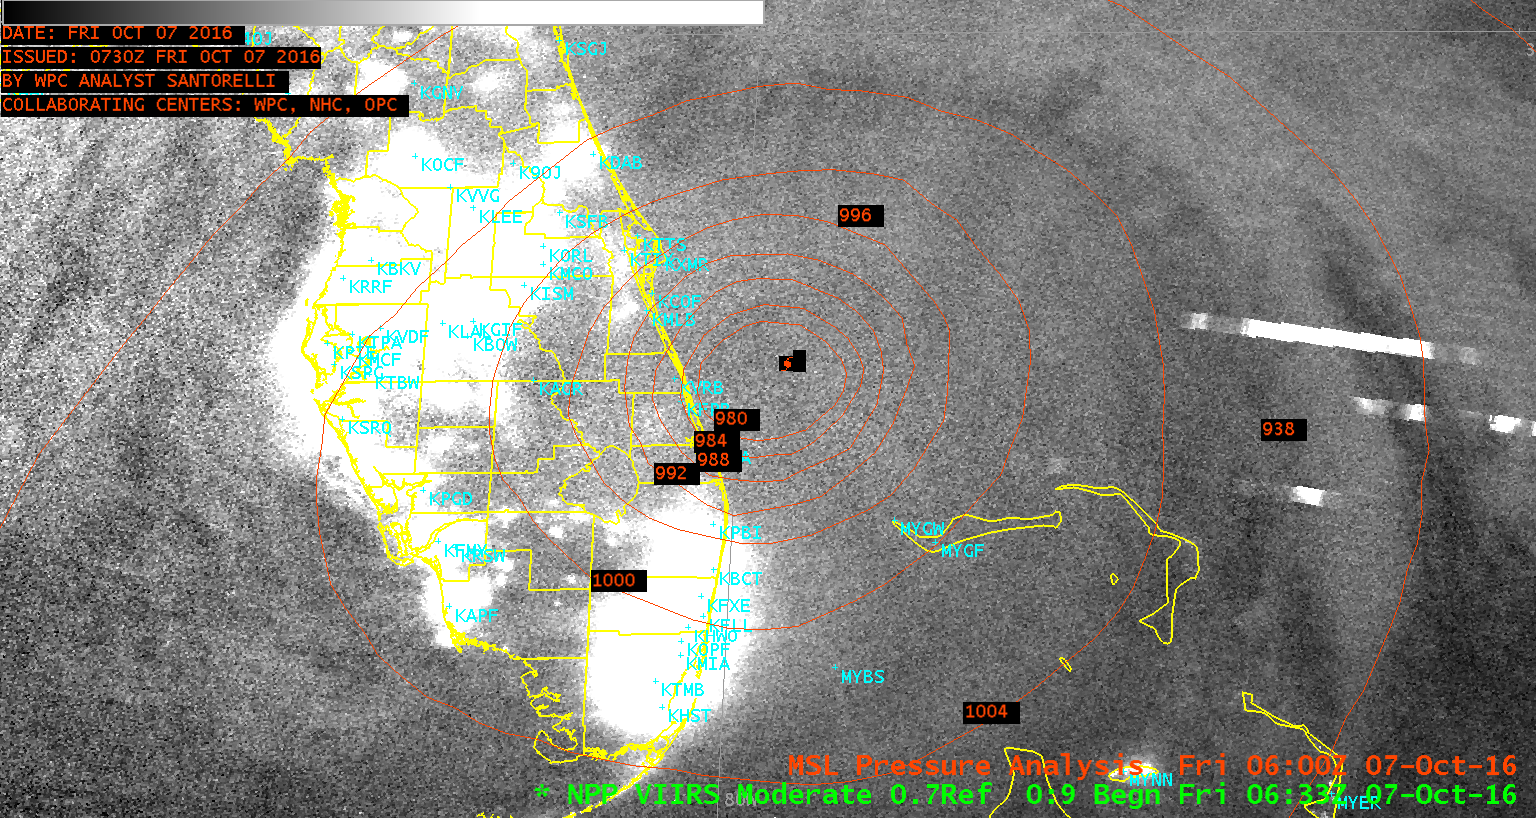
Day/Night Band Visible Imagery (0.70 µm) from VIIRS on Suomi NPP at 0633 UTC on 7 October (Click to enlarge)
View only this post
Read Less
![GOES-13 0.63 µm Visible (left) and 10.7 µm Infrared Window (right) images [Click to play animation]](https://cimss.ssec.wisc.edu/satellite-blog/wp-content/uploads/sites/5/2016/10/161005_goes13_visible_infrared_Matthew_anim.gif)

![GOES-13 0.63 µm Visible (left) and 10.7 µm Infrared Window (right) images [Click to play animation]](https://cimss.ssec.wisc.edu/satellite-blog/wp-content/uploads/sites/5/2016/10/161004_goes13_visible_infrared_Matthew_landfall_Haiti_anim.gif)
![GOES-13 Infrared Window (10.7 µm) and DMSP-18 SSMIS Microwave (85 GHz) images [Click to enlarge]](https://cimss.ssec.wisc.edu/satellite-blog/wp-content/uploads/sites/5/2016/10/161004_1215utc_goes13_infrared_dmsp18_ssmis_microwave_Matthew_anim.gif)
![GOES-13 Visible (0.63 um) images [click to play animation]](https://cimss.ssec.wisc.edu/satellite-blog/wp-content/uploads/sites/5/2016/10/161004_goes13_visible_Julia_anim.gif)
![GOES-13 Visible (0.63 µm) image, with Metop-AASCAT winds [Click to enlarge]](https://cimss.ssec.wisc.edu/satellite-blog/wp-content/uploads/sites/5/2016/10/goes13_visible_ascat-20161004_140000.png)
![GOES-13 Infrared Window (10.7 µm) and DMSP-18 SSMIS Microwave (85 GHz) images [Click to enlarge]](https://cimss.ssec.wisc.edu/satellite-blog/wp-content/uploads/sites/5/2016/10/161004_2330utc_dmsp_ssmis_microwave_2354utc_goes13_infrared_Matthew_anim.gif)
![GOES-13 Visible (0.63 µm) imagery, 1115 UTC on 30 September 2016 [Click to enlarge]](https://cimss.ssec.wisc.edu/satellite-blog/wp-content/uploads/sites/5/2016/09/MATTHEW_30SEP_1115UTC.GIF)
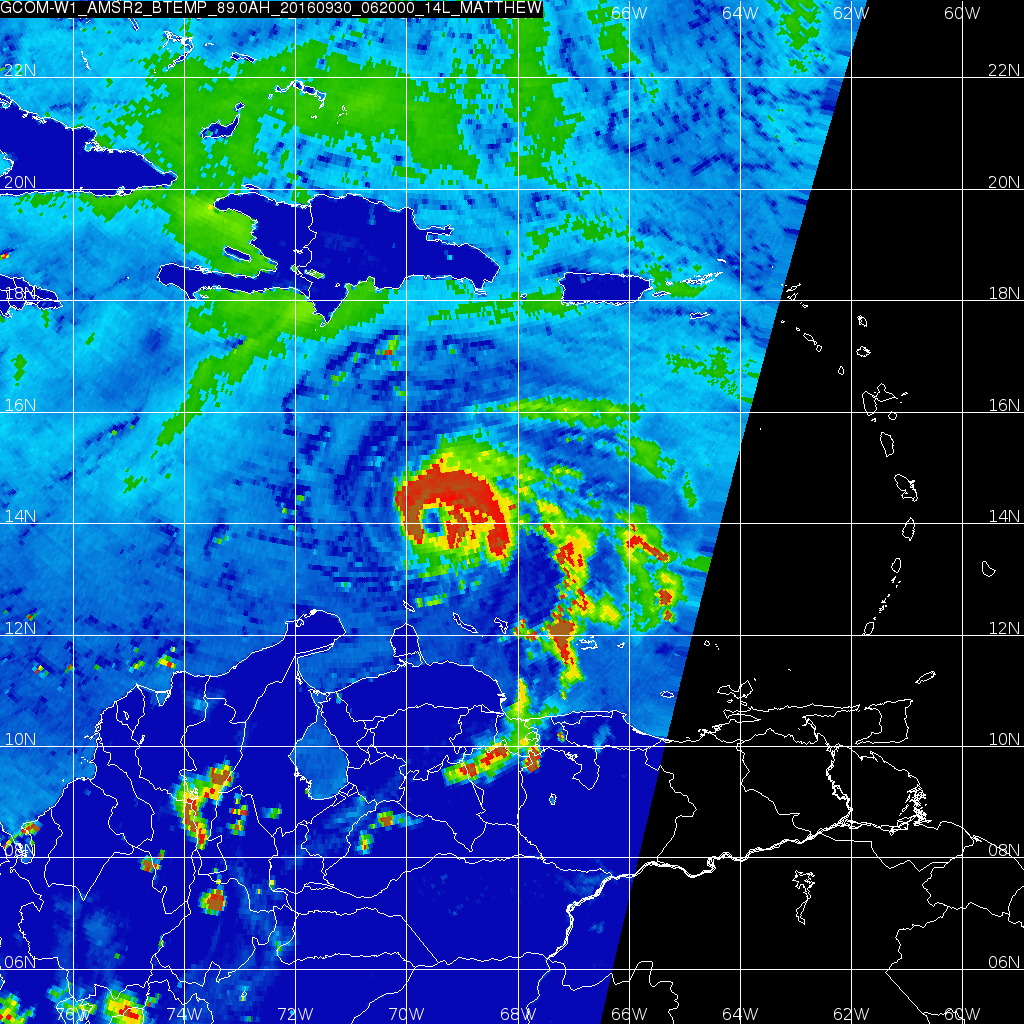
![GCOM AMRS-2 Brightness Temperatures at 36.5 and 89.0 GHz, 0620 UTC on 30 September 2016 [Click to enlarge]](https://cimss.ssec.wisc.edu/satellite-blog/wp-content/uploads/sites/5/2016/09/gcom-w1_amsr2_btemp_36.5_89.0ah_20160930_062000_14L_MATTHEWtoggle.gif)
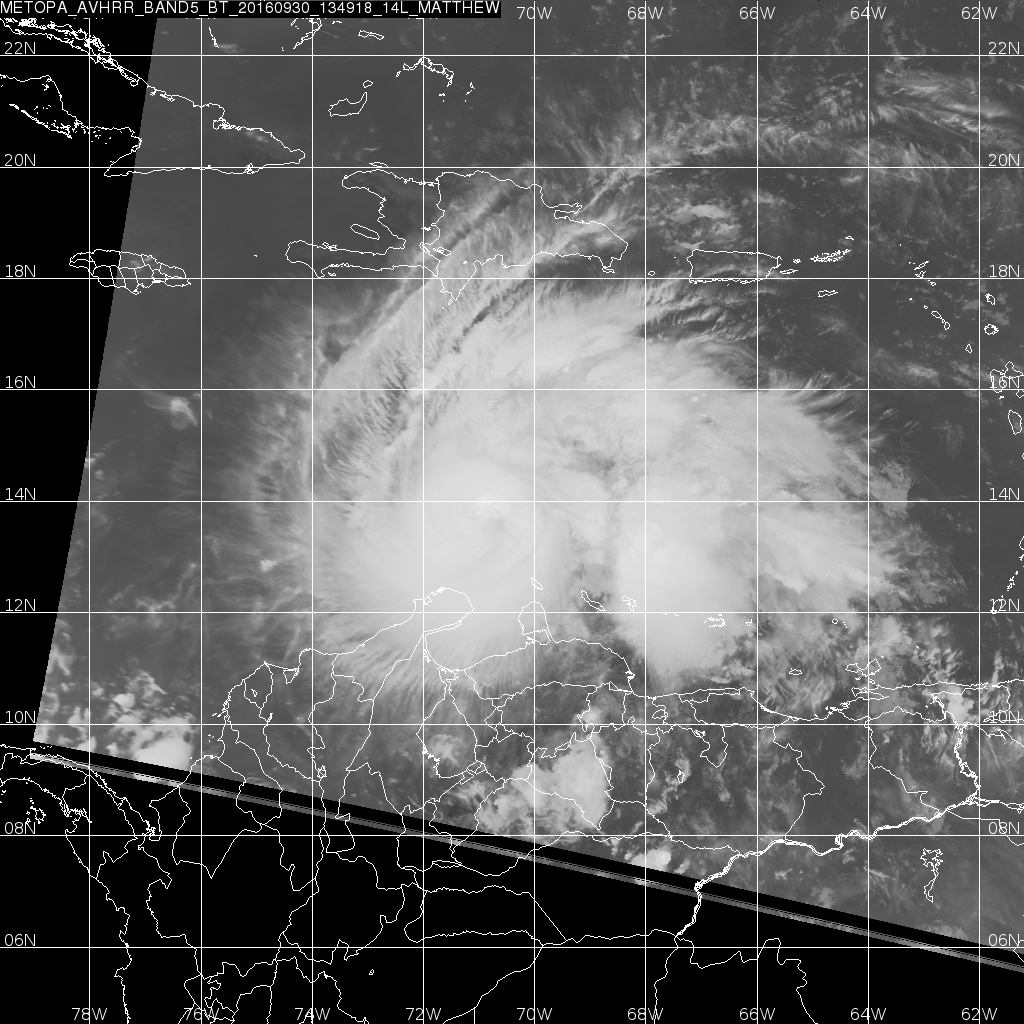
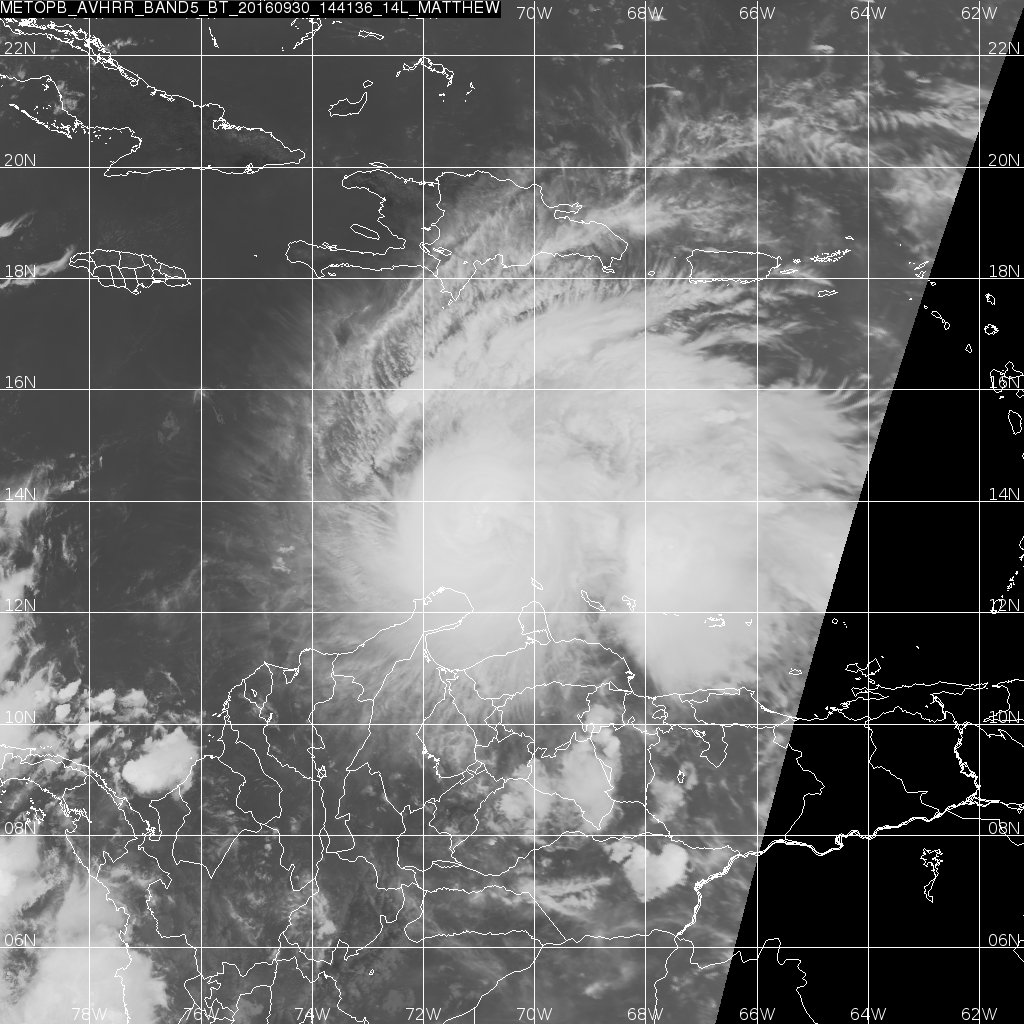
![10.8 µm brightness temperatures from AVHRR on METOP-A (1349 UTC) and METOP-B (1441 UTC) on 30 September 2016 [Click to enlarge]](https://cimss.ssec.wisc.edu/satellite-blog/wp-content/uploads/sites/5/2016/09/metopb_metopa_avhrr_band5_bt_20160930_144136_14L_MATTHEWanim.gif)
![GOES-13 Visible 0.63 µm Imagery, 1345-1715 UTC on 30 September 2016 [Click to enlarge]](https://cimss.ssec.wisc.edu/satellite-blog/wp-content/uploads/sites/5/2016/09/MATT_G13_VIS_30SEP_1345_1715anim.gif)
![GOES-13 Infrared Window (10.7 µm) images [click to play animation]](https://cimss.ssec.wisc.edu/satellite-blog/wp-content/uploads/sites/5/2016/09/160930_goes13_infrared_Hurricane_Matthew_anim.gif)
![GOES-13 0.63 µm Visible (left) and 10.7 µm Infrared Window (right) images [click to play animation]](https://cimss.ssec.wisc.edu/satellite-blog/wp-content/uploads/sites/5/2016/09/161001_goes13_visible_infrared_Matthew_anim.gif)
