![Himawari-8 0.64 µm Visible (top) and 10.4 µm Infrared Window (bottom) images [click to play MP4 animation]](https://cimss.ssec.wisc.edu/satellite-blog/wp-content/uploads/sites/5/2016/09/480x1280_H8F_B313_HIM08_VIS_IR_MERANTI_11-12SEP2016_2016256_082715_0002PANELS.GIF)
Himawari-8 0.64 µm Visible (top) and 10.4 µm Infrared Window (bottom) images [click to play MP4 animation]
Rapid-scan (2.5-minute interval) Himawari-8
AHI Visible (0.64 µm) and Infrared Window (10.4 µm) images
(above; also avialable as a 33 Mbyte animated GIF) showed the pin-hole eye and cold cloud-top IR brightness temperatures
(-80º C and colder, violet color enhancement) associated with Super Typhoon
Meranti (16W) in the Philippine Sea on 11-12 September 2016. Note that the
ABI instrument on
GOES-R will provide similar 0.5-km resolution Visible and 2-km resolution Infrared imagery.
![Himawari-8 Infrared Window (10.4 µm) image at 1230 UTC on 12 September, with 11 September images of Sea Surface Temperature and Ocean Heat Content [click to enlarge]](https://cimss.ssec.wisc.edu/satellite-blog/wp-content/uploads/sites/5/2016/09/160911-12_STY_Meranti_infrared_sst_ohc_anim.gif)
Himawari-8 Infrared Window (10.4 µm) image at 1230 UTC on 12 September, with 11 September images of Sea Surface Temperature and Ocean Heat Content [click to enlarge]
As Meranti was intensifying from a
Category 4 to a
Category 5 storm, it was passing over waters that exhibited both warm Sea Surface Temperatures and high Ocean Heat Content as seen on images from the
CIMSS Tropical Cyclones site
(above), and was also moving through an environment of very low deep-layer wind shear
(below) — all factors that are favorable for tropical cyclone intensification.
![Himawari-8 Infrared Window (10.4 µm) images, with satellite-derived 850-200 hPa deep layer wind shear [click to play animation]](https://cimss.ssec.wisc.edu/satellite-blog/wp-content/uploads/sites/5/2016/09/160912_1530utc_himawari8_infrared_wind_shear_STY_Meranti.jpg)
Himawari-8 Infrared Window (10.4 µm) images, with satellite-derived 850-200 hPa deep layer wind shear [click to play animation]
Himawari-8 Infrared Window (10.4 µm) images
(below; also available as an 89 Mbyte animated GIF) showed Meranti as a Category 5 storm during the nighttime hours on 12 September.
![Himawari-8 Infrared Window (10.4 µm) images [click to play MP4 animation]](https://cimss.ssec.wisc.edu/satellite-blog/wp-content/uploads/sites/5/2016/09/960x1280_H8F_B13_HIM08_IR_MERANTI_12SEP2016_2016256_120215_0001PANEL.GIF)
Himawari-8 Infrared Window (10.4 µm) images [click to play MP4 animation]
A comparison of a Himawari-8 Infrared Window (10.4 µm) image at 1830 UTC and a DMSP-15 SSMIS Microwave (85 GHz) image at 1847 UTC
(below) again displayed the very small eye.
![Himawari-8 Infrared Window (10.4 µm) and DMSP-15 SSMIS Microwave (85 GHz) images [click to enlarge]](https://cimss.ssec.wisc.edu/satellite-blog/wp-content/uploads/sites/5/2016/09/160912_1830utc_himawari8_ir_1847utc_ssmis_mw_Meranti_anim.gif)
Himawari-8 Infrared Window (10.4 µm) and DMSP-15 SSMIS Microwave (85 GHz) images [click to enlarge]
During the subsequent daytime hours (local time) on 12 September, another comparison of rapid-scan (2.5-minute interval) Himawari-8 Visible (0.64 µm) and Infrared Window (10.4 µm) images
(below; also available as a 24 Mbyte animated GIF) continued to show a well-defined eye as Meranti maintained Category 5 intensity (
ADT plot). Mesovortices could be seen spinning within the eye on the visible imagery during this time.
![Himawari-8 0.64 µm Visible (top) and 10.4 µm Infrared Window (bottom) images [click to play MP4 animation]](https://cimss.ssec.wisc.edu/satellite-blog/wp-content/uploads/sites/5/2016/09/480x1280_H8F_B313_HIM08_VIS_IR_MERANTI_12SEP2016_2016256_222545_0002PANELS.GIF)
Himawari-8 0.64 µm Visible (top) and 10.4 µm Infrared Window (bottom) images [click to play MP4 animation]
===== 13 September Update =====
![Himawari-8 Infrared Window (10.4 µm) images [click to play MP4 animation]](https://cimss.ssec.wisc.edu/satellite-blog/wp-content/uploads/sites/5/2016/09/960x1280_H8F_B13_HIM08_IR_MERANTI_13SEP2016_2016257_150215_0001PANEL.GIF)
Himawari-8 Infrared Window (10.4 µm) images [click to play MP4 animation]
Super Typhoon Meranti went through a secondary round of intensification on 13 September (
ADT plot) , with the
JTWC estimating maximum sustained winds of 165 knots with gusts to 200 knots at
21 UTC. CIMSS Satellite Consensus (
SATCON) plots of
wind and
pressure indicated that Meranti reached peak intensity near the middle of the day. Himawari-8 Infrared Window (10.4 µm) images
(above; also available as a 114 Mbyte animated GIF) continued to display a well-defined eye with an annular storm structure during this period. A
faster version of the animated GIF better showed the pronounced trochoidal motion exhibited by the eye of Meranti, as it moved just south of the island of Taiwan.
![Himawari-8 Infrared Window (11.45 µm) images [click to enlarge]](https://cimss.ssec.wisc.edu/satellite-blog/wp-content/uploads/sites/5/2016/09/160913_himwari8_infrared_Merantri_Itbayat_anim.gif)
Himawari-8 Infrared Window (11.45 µm) images [click to enlarge]
The eye of Meranti passed directly over the small Philippine island of
Itbayat, as seen on Himawari-8 Infrared Window (11.45 µm) images viewed using
RealEarth (above).
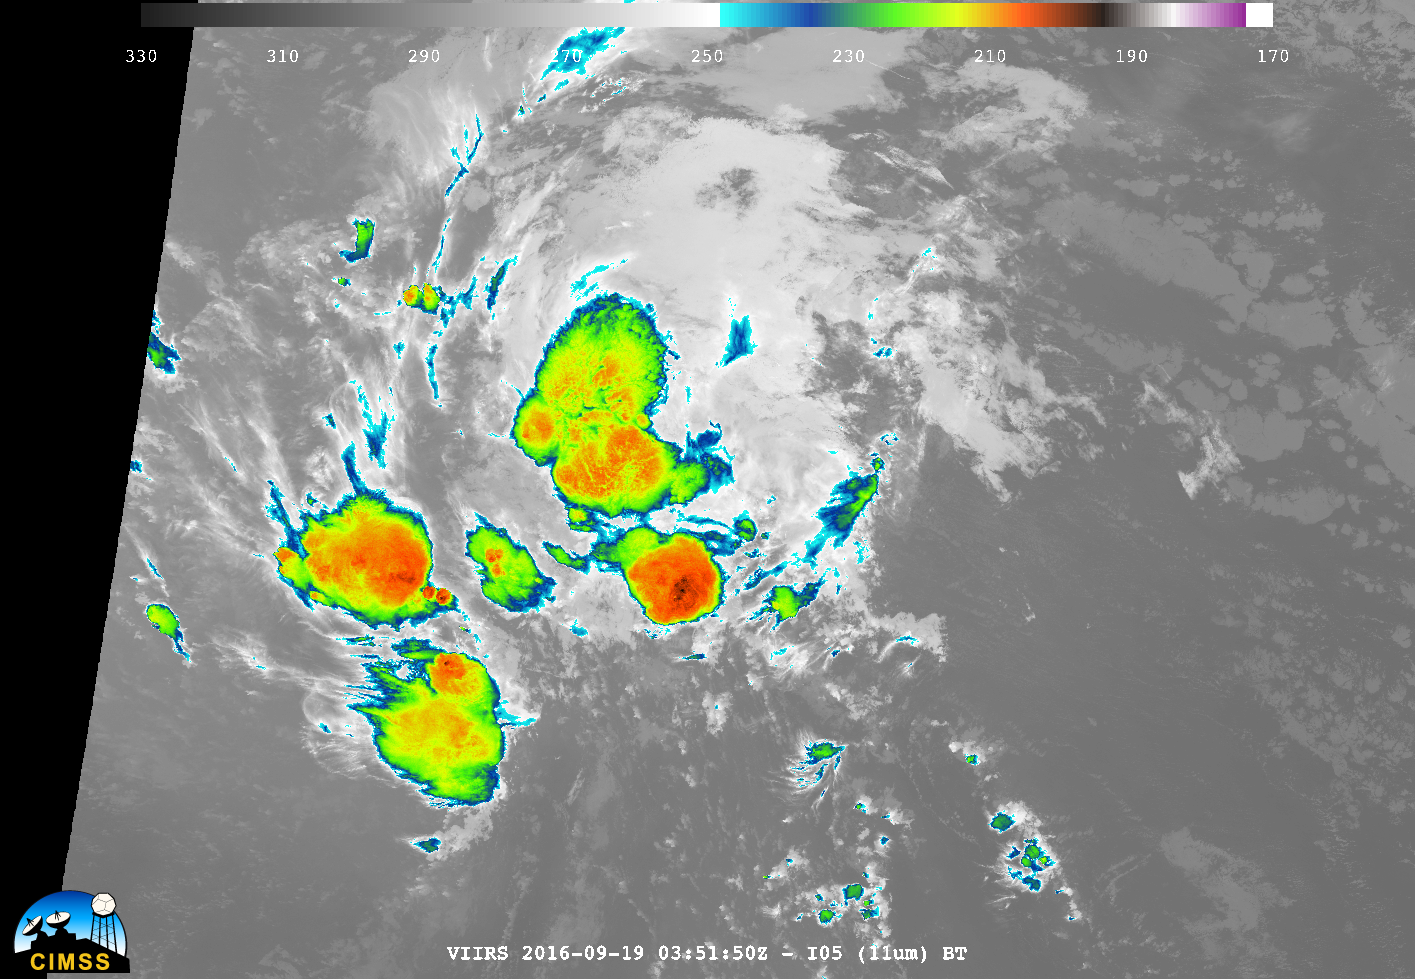
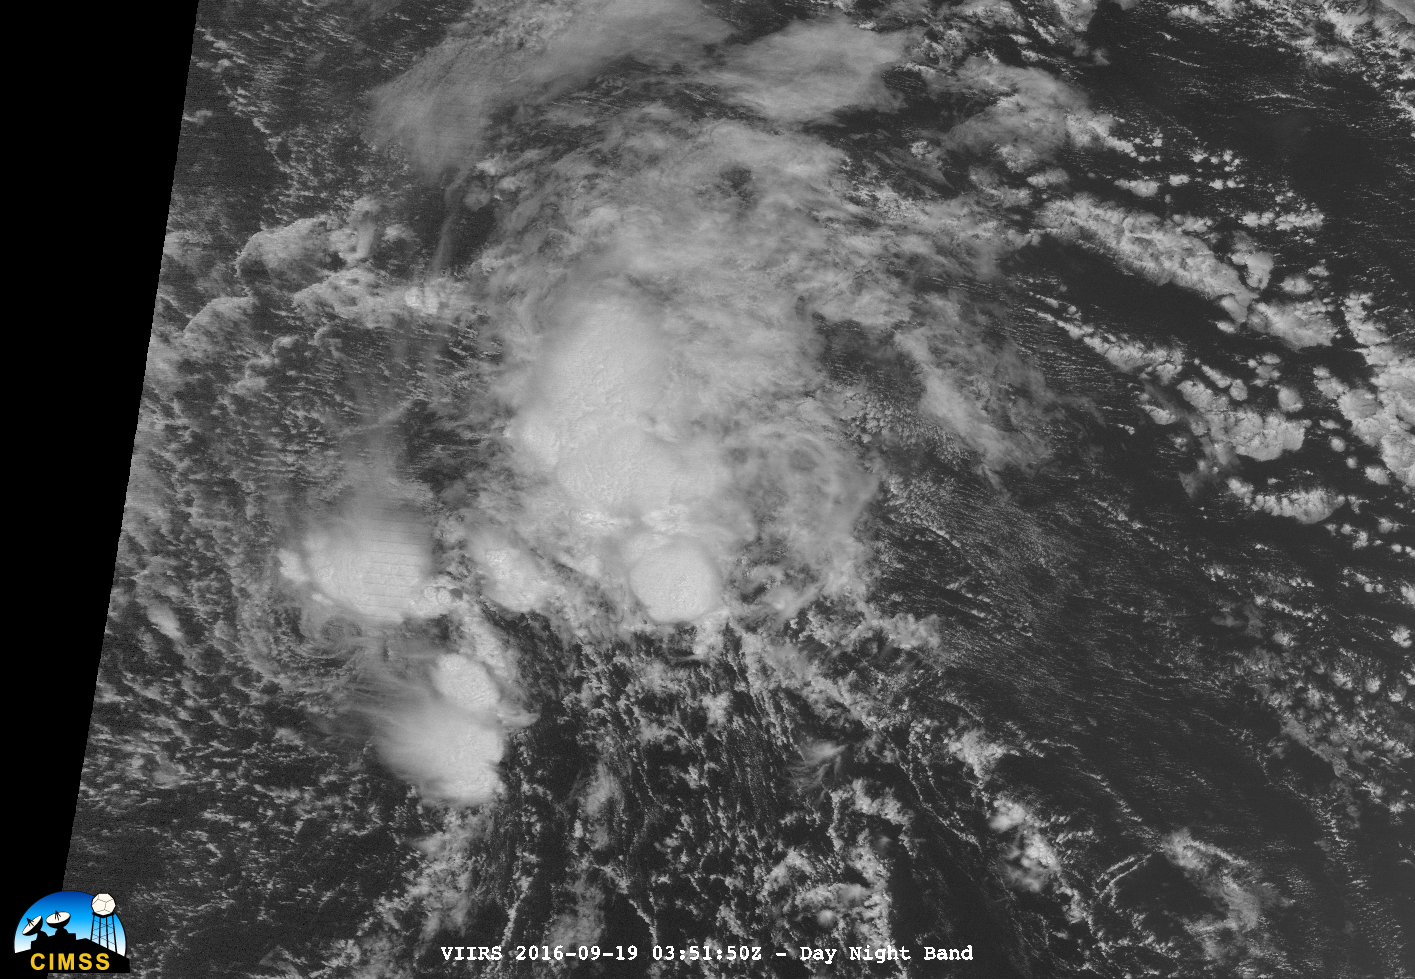
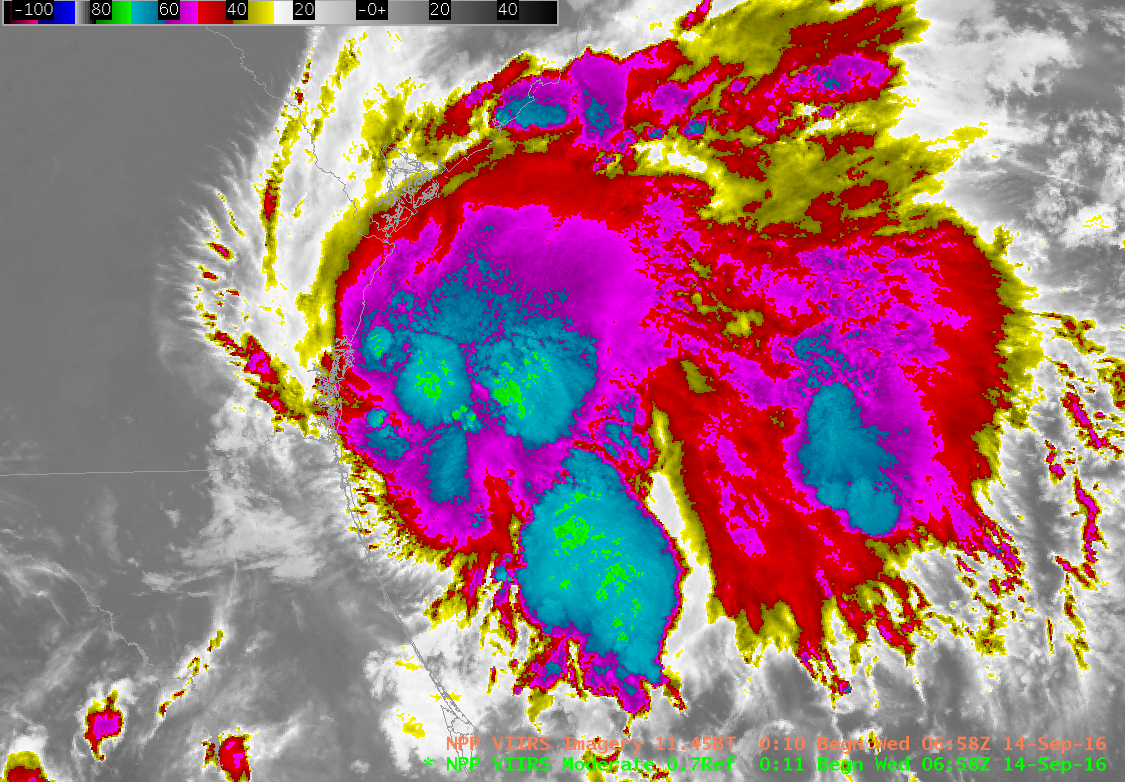
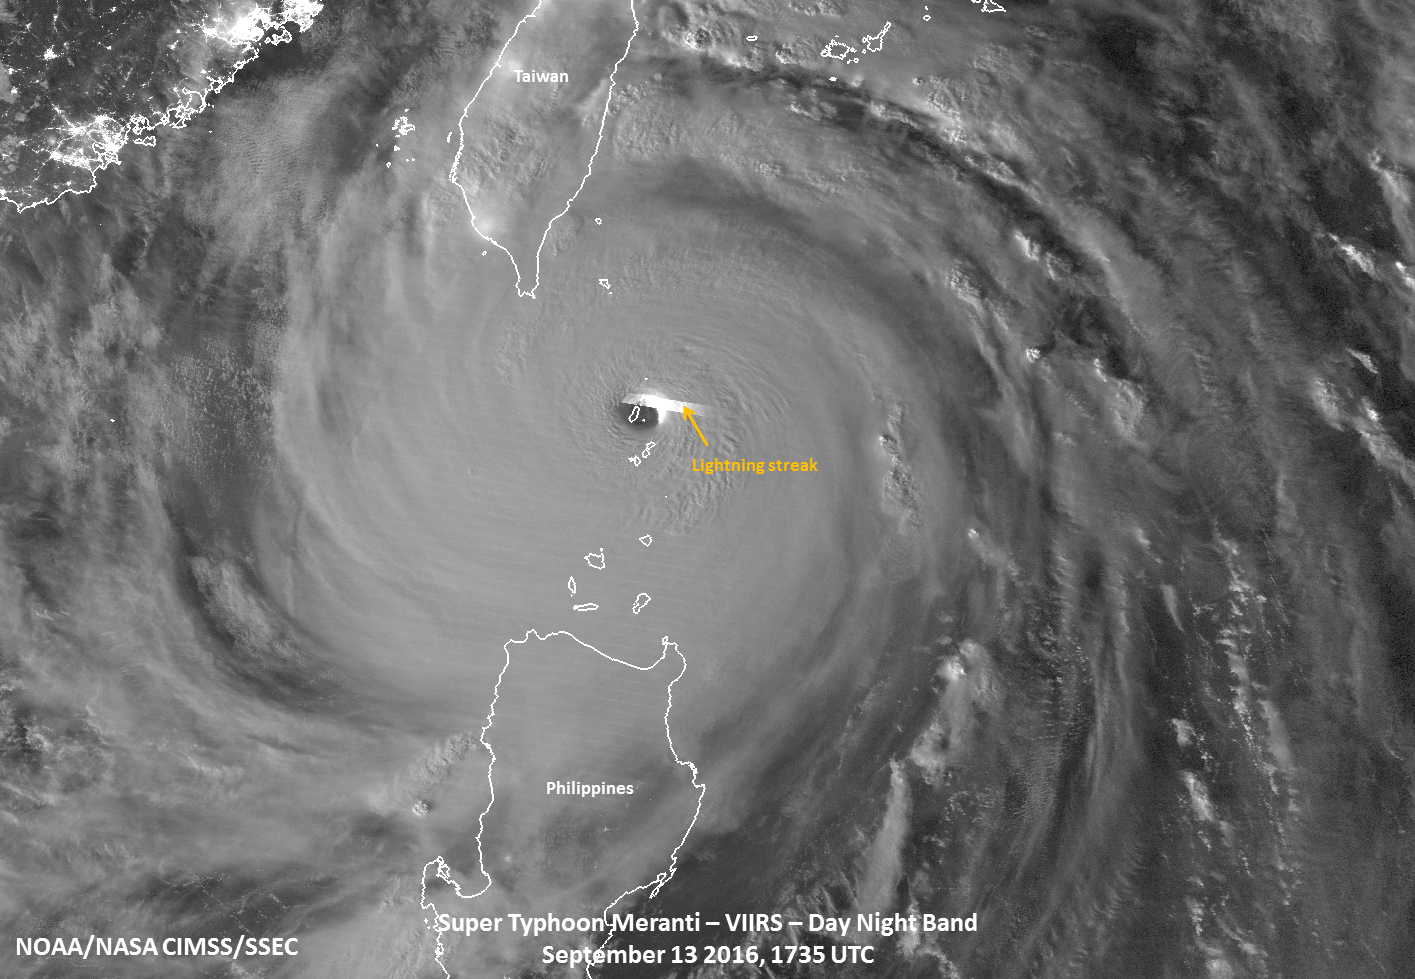
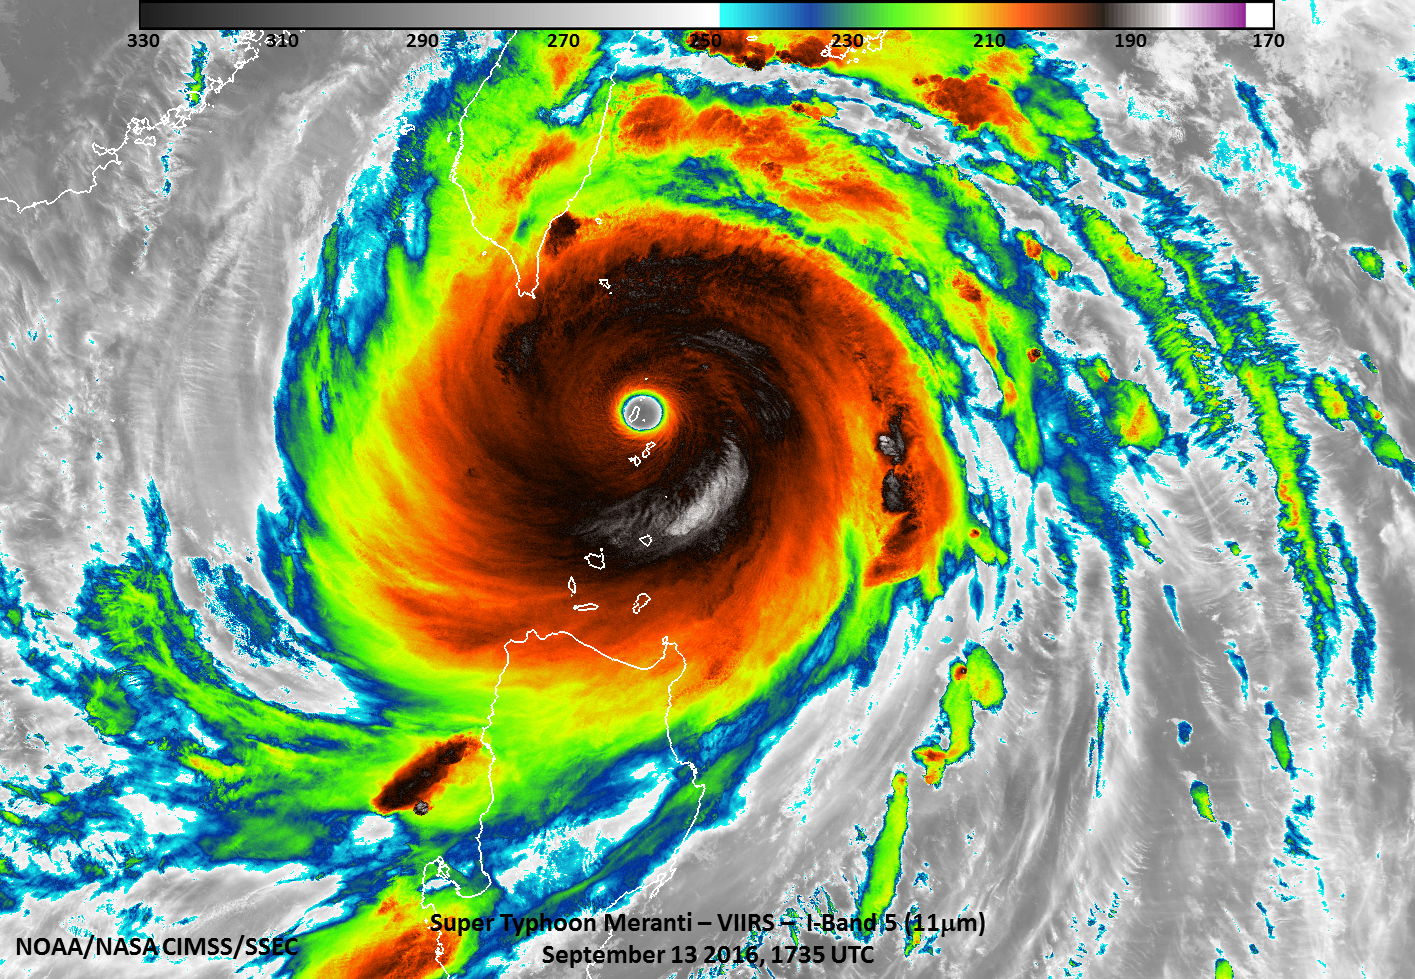
Suomi NPP overflew Meranti around 1730 UTC, just as the eye of the storm was passing over Itbayat. In a toggle between VIIRS Infrared Window (11.45 µm) and Day/Night Band (0.7 µm) images (below; courtesy of William Straka, SSEC) ample lunar illumination provided a very good “visible image at night” which also included a bright lightning streak emanating from the eastern eyewall of the Category 5 storm. The image pair also shows a good example of the “stadium effect” eye geometry (where the eye diameter at the surface is smaller, and opens to a wider distance with increasing height). A larger-scale view of the entire storm from the Day/Night Band is available here; the corresponding 11.45 µm Infrared image is available here.
![Suomi NPP VIIRS Infrared Window (11.45 µm) and Day/Night Band visible (0.70 µm) imagery of Meranti, 1735 UTC on 13 September 2016 [click to enlarge]](https://cimss.ssec.wisc.edu/satellite-blog/wp-content/uploads/sites/5/2016/09/160913_1735utc_suomi_npp_viirs_Infrared_Day_Night_Band_Meranti_Itbayat_anim.gif)
Suomi NPP VIIRS Infrared Window (11.45 µm) and Day/Night Band visible (0.70 µm) imagery of Meranti, 1735 UTC on 13 September 2016 [click to enlarge]
![DMSP-15 SSMI Microwave (85 GHz) and Himawari-8 Infrared Window (11.45 µm) images [click to enlarge]](https://cimss.ssec.wisc.edu/satellite-blog/wp-content/uploads/sites/5/2016/09/160913_1831utc_dmsp15_ssmi_microwave_1830utc_himawari8_infrared_Meranti_anim.gif)
DMSP-15 SSMI Microwave (85 GHz) and Himawari-8 Infrared Window (11.45 µm) images [click to enlarge]
In a comparison of DMSP-15 SSMI Microwave (85 GHz) and Himawari-8 Infrared Window (11.45 µm) images around 1830 UTC
(above), the appearance of concentric eyewalls on the microwave data suggested that Meranti was preparing to go through an eyewalll replacement cycle, which also signaled that the storm was perhaps near maximum intensity.
This formation of concentric eyewalls was nicely depicted by the MIMIC-TC product (below).
![MIMIC-TC product [click to play animation]](https://cimss.ssec.wisc.edu/satellite-blog/wp-content/uploads/sites/5/2016/09/160913_2330utc_mimic_tc_Meranti.jpg)
MIMIC-TC product [click to play animation]
=====14 September Update =====
![Suomi NPP VIIRS Day/Night Band (0.7 µm) and Infrared Window (11.45 µm) images [click to enlarge]](https://cimss.ssec.wisc.edu/satellite-blog/wp-content/uploads/sites/5/2016/09/160914_1716utc_suomi_npp_viirs_dnb_ir_Meranti_landfall_anim.gif)
Suomi NPP VIIRS Day/Night Band (0.7 µm) and Infrared Window (11.45 µm) images [click to enlarge]
Less than 2 hours prior to landfall (which was around 1905 UTC on 14 September, over Xiamen City in the Fujian Province of China), a toggle between Suomi NPP VIIRS Day/Night Band (0.7 µm) and Infrared Window (11.45 µm) images at 1716 UTC
(above) still showed well-defined curved banding structures around the center of of the Category 2 typhoon.
Himawari-8 Infrared Window (10.4 µm) images from pre-landfall at 0600 UTC on 14 September to post-landfall at 0600 UTC on 15 September (below; also available as a 47 Mbyte animated GIF) showed that Meranti quickly dissipated as it moved inland over mainland China. The images are centered on Xiamen (station identifier ZSAM); alternate animation versions with the BD grayscale enhancement are available in MP4 and animated GIF format.
![Himawari-8 Infrared Window (10.4 µm) images [click to play MP4 animation]](https://cimss.ssec.wisc.edu/satellite-blog/wp-content/uploads/sites/5/2016/09/960x1280_AHIM08_B13_HIM08_IR_MERANTI_14-15SEP2016_2016258_190000_0001PANEL.GIF)
Himawari-8 Infrared Window (10.4 µm) images [click to play MP4 animation]
About 4 hours after landfall, good curved banding structure was still observed in DMSP-18 SSMIS Microwave (85 GHz) imagery at 2314 UTC, while the overall presentation of the storm on Himawari-8 Infrared Window (11.45 µm) imagery began to deteriorate
(below).
![DMSP-18 SSMIS Microwave (85 GHz) and Himawari-8 Infrared Window (11.45 µm) images [click to enlarge]](https://cimss.ssec.wisc.edu/satellite-blog/wp-content/uploads/sites/5/2016/09/160914_2314utc_dmsp18_ssmis_mw_2300utc_himawari8_ir_Meranti_post_landfall_anim.gif)
DMSP-18 SSMIS Microwave (85 GHz) and Himawari-8 Infrared Window (11.45 µm) images [click to enlarge]
View only this post
Read Less
![Suomi NPP VIIRS imagery from the Day/Night Band visible (0.70 µm) and Infrared (11.45 µm) at 0351 UTC on 19 September [Click to enlarge]](https://cimss.ssec.wisc.edu/satellite-blog/wp-content/uploads/sites/5/2016/09/DNB_I05_091916_0351_TSKarltoggle.gif)
![Suomi NPP VIIRS imagery from the Day/Night Band visible (0.70 µm) and Infrared (11.45 µm) at 0351 UTC on 19 September over the center of Karl [Click to enlarge]](https://cimss.ssec.wisc.edu/satellite-blog/wp-content/uploads/sites/5/2016/09/DNB_I05_091916_0351_TSKarl_swirltoggle.gif)

![Morphed Total Precipitable Water derived from MIRS, 1400 UTC on 14 September 2016 [click to play animation]](https://cimss.ssec.wisc.edu/satellite-blog/wp-content/uploads/sites/5/2016/09/160913-13_mimic_tpw_anim.gif)
![Himawari-8 Infrared Window (10.4 µm) images, with satellite-derived 850-200 hPa deep layer wind shear [click to play animation]](https://cimss.ssec.wisc.edu/satellite-blog/wp-content/uploads/sites/5/2016/09/160912_himawari8_ir_shear_STY_Meranti_anim.gif)
![MIMIC-TC product [click to play animation]](https://cimss.ssec.wisc.edu/satellite-blog/wp-content/uploads/sites/5/2016/09/160913_mimic_tc_Meranti_anim.gif)
![GOES-13 Visible (0.63 µm) images, with buoy/ship reports plotted in yellow [click to play animation]](https://cimss.ssec.wisc.edu/satellite-blog/wp-content/uploads/sites/5/2016/09/160904_goes13_visible_Hermine_anim.gif)
![GOES-13 Visible (0.63 µm) images, with buoy/ship reports plotted in yellow [click to play animation]](https://cimss.ssec.wisc.edu/satellite-blog/wp-content/uploads/sites/5/2016/09/160905_goes13_visible_Hermine_anim.gif)
![GOES-13 Visible (0.63 µm) images, with surface/buoy/ship data plotted in yellow [click to play animation]](https://cimss.ssec.wisc.edu/satellite-blog/wp-content/uploads/sites/5/2016/09/160906_goes13_visible_Hermine_anim.gif)
![GOES-13 Visible (0.63 µm) image at 1600 UTC, with ASCAT winds and surface/buoy/ship reports [click to enlarge]](https://cimss.ssec.wisc.edu/satellite-blog/wp-content/uploads/sites/5/2016/09/goes13_visible_ascat-20160906_160000.png)
![MIMIC Total Precipitable Water product [click to play animation]](https://cimss.ssec.wisc.edu/satellite-blog/wp-content/uploads/sites/5/2016/09/160904-07_mimic_tpw_Hermine_anim.gif)
