Copious amounts of moisture associated with Hurricane Matthew resulted in heavy rainfall (map | text list) and widespread flooding across the Southeast and Mid-Atlantic US during the 07 October to 09 October 2016 period. Hourly images of the MIMIC Total Precipitable Water (TPW) product (above; also available as a 22 Mbyte animated GIF) showed the high TPW values that... Read More
![MIMIC Total Precipitable Water product, from 06 October/04 UTC to 08 October/16 UTC [click to play MP4 animation]](https://cimss.ssec.wisc.edu/satellite-blog/wp-content/uploads/sites/5/2016/10/comp20161008.000000_tpw.png)
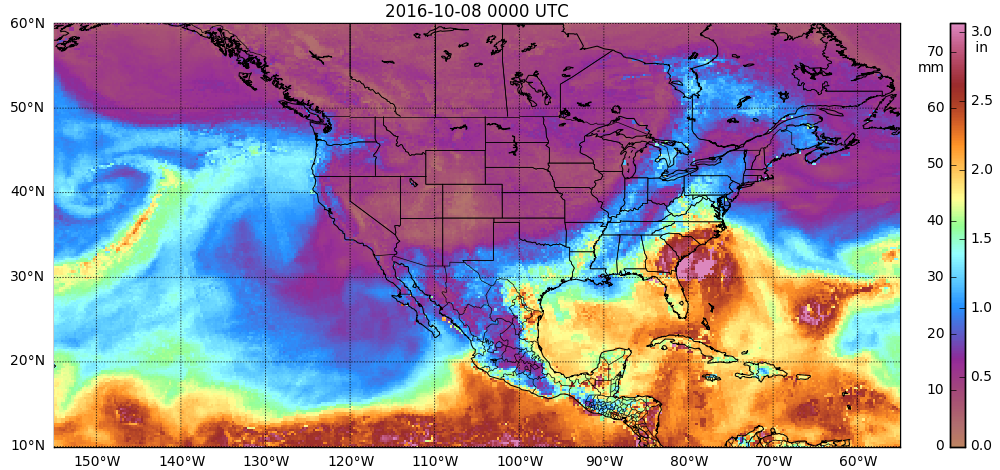
MIMIC Total Precipitable Water product, from 06 October/04 UTC to 08 October/16 UTC [click to play MP4 animation]
Copious amounts of moisture associated with
Hurricane Matthew resulted in heavy rainfall (
map |
text list) and widespread flooding across the Southeast and Mid-Atlantic US during the
07 October to
09 October 2016 period. Hourly images of the
MIMIC Total Precipitable Water (TPW) product
(above; also available as a 22 Mbyte animated GIF) showed the high TPW values that spread from Florida to the Mid-Atlantic states; all-time record high TPW values were measured via rawinsonde at
Jacksonville, Florida and
Charleston, South Carolina, with a record high value for the month of October at
Newport/Cape Hatteras, North Carolina (
Tweet). For more details, see the
Weather Underground blog.
Track of Matthew, from 28 September at 12 UTC to 09 October at 18 UTC
Matthew set numerous records for intensity, longevity, and landfall (summary) — an animation of hourly GOES-13 Water Vapor (6.5 µm) images covering the 11-day period from 12 UTC on 28 September to 12 UTC on 09 October is shown below (also available as a large 113 Mbyte animated GIF). The CIMSS Tropical Cyclones site posted GOES-13 Visible (0.63 µm) animations from the individual days of 03 October, 04 October, 05 October, 06 October, 07 October, and 08 October.
![GOES-13 Water Vapor (6.5 µm) images [click to play MP4 animation]](https://cimss.ssec.wisc.edu/satellite-blog/wp-content/uploads/sites/5/2016/10/960x1280_AGOES13_B3_GOES13_WV_MATTHEW_28SEP-09OCT2016_2016277_181500_0001PANEL.GIF)
GOES-13 Water Vapor (6.5 µm) images [click to play MP4 animation]
The combination of high winds and flooding led to widespread power outages, with over 2 million homes and businesses without power. A comparison of nighttime Suomi NPP VIIRS Day/Night Band (0.7 µm) images from 28 September (before Mattthew arrived) and 09/10 October (after the passage of Matthew) showed a notable reduction in the glow of city lights in areas with no power
(below; images courtesy of William Straka, SSEC). Note that the presence of patchy clouds on all 3 images tended to diffuse or even obscure the appearance of city lights below, depending on the thickness of the cloud layer(s).
![Suomi NPP VIIRS Day/Night Band (0.7 µm) images on 28 September, 09 October and 10 October [click to enlarge]](https://cimss.ssec.wisc.edu/satellite-blog/wp-content/uploads/sites/5/2016/10/160928_161009_161010_suomi_npp_viirs_Day_Night_Band_Southeast_US_power_outages_Hurricane_Matthew_anim.gif)
Suomi NPP VIIRS Day/Night Band (0.7 µm) images on 28 September, 09 October and 10 October [click to enlarge]
As clouds cleared in the wake of Hurricane Matthew on 09 October, a Suomi NPP VIIRS true-color Red/Green/Blue (RGB) image at 1859 UTC, viewed using
RealEarth (below), revealed patterns of turbidity in the offshore waters of the Atlantic Ocean from Florida to North Carolina; this increased turbidity was a result of high amounts of particles suspended in the water due to a combination of mixing from prolonged high winds and runoff from inland flooding.
![Suomi NPP VIIRS true-color image [click to enlarge]](https://cimss.ssec.wisc.edu/satellite-blog/wp-content/uploads/sites/5/2016/10/161009_viirs_truecolor_Southeast_US_coastal_turbidity_Hurricane_Matthew_anim.gif)
Suomi NPP VIIRS true-color image [click to enlarge]
About 8 hours later, a Terra MODIS Sea Surface Temperature (SST) product image at 0243 UTC on 10 October
(below) showed a large eddy of warm Gulf Stream water (with a maximum SST value of 85.2º F, darker red color enhancement) surrounding a pocket of cooler water (with a minimum SST value of 78.5º F, darker blue color enhancement) off the coast of South Carolina.
![Terra MODIS Sea Surface Temperature product [click to enlarge]](https://cimss.ssec.wisc.edu/satellite-blog/wp-content/uploads/sites/5/2016/10/MODIS_SST_20161010_0243.png)
Terra MODIS Sea Surface Temperature product [click to enlarge]
The VIIRS Instrument on Suomi NPP provides data that are used in a River Flood Product (discussed
previously on this blog). The product uses three reflective bands (I01, I02, and I03 at 0.64 µm, 0.86 µm and 1.61 µm, respectively) and the infrared window band I05 at 11.45 µm. The image below (courtesy of Sanmei Li at George Mason University) identifies many flooded regions over North Carolina. In particular, the flooding near
Goldsboro and Lumberton is identified.
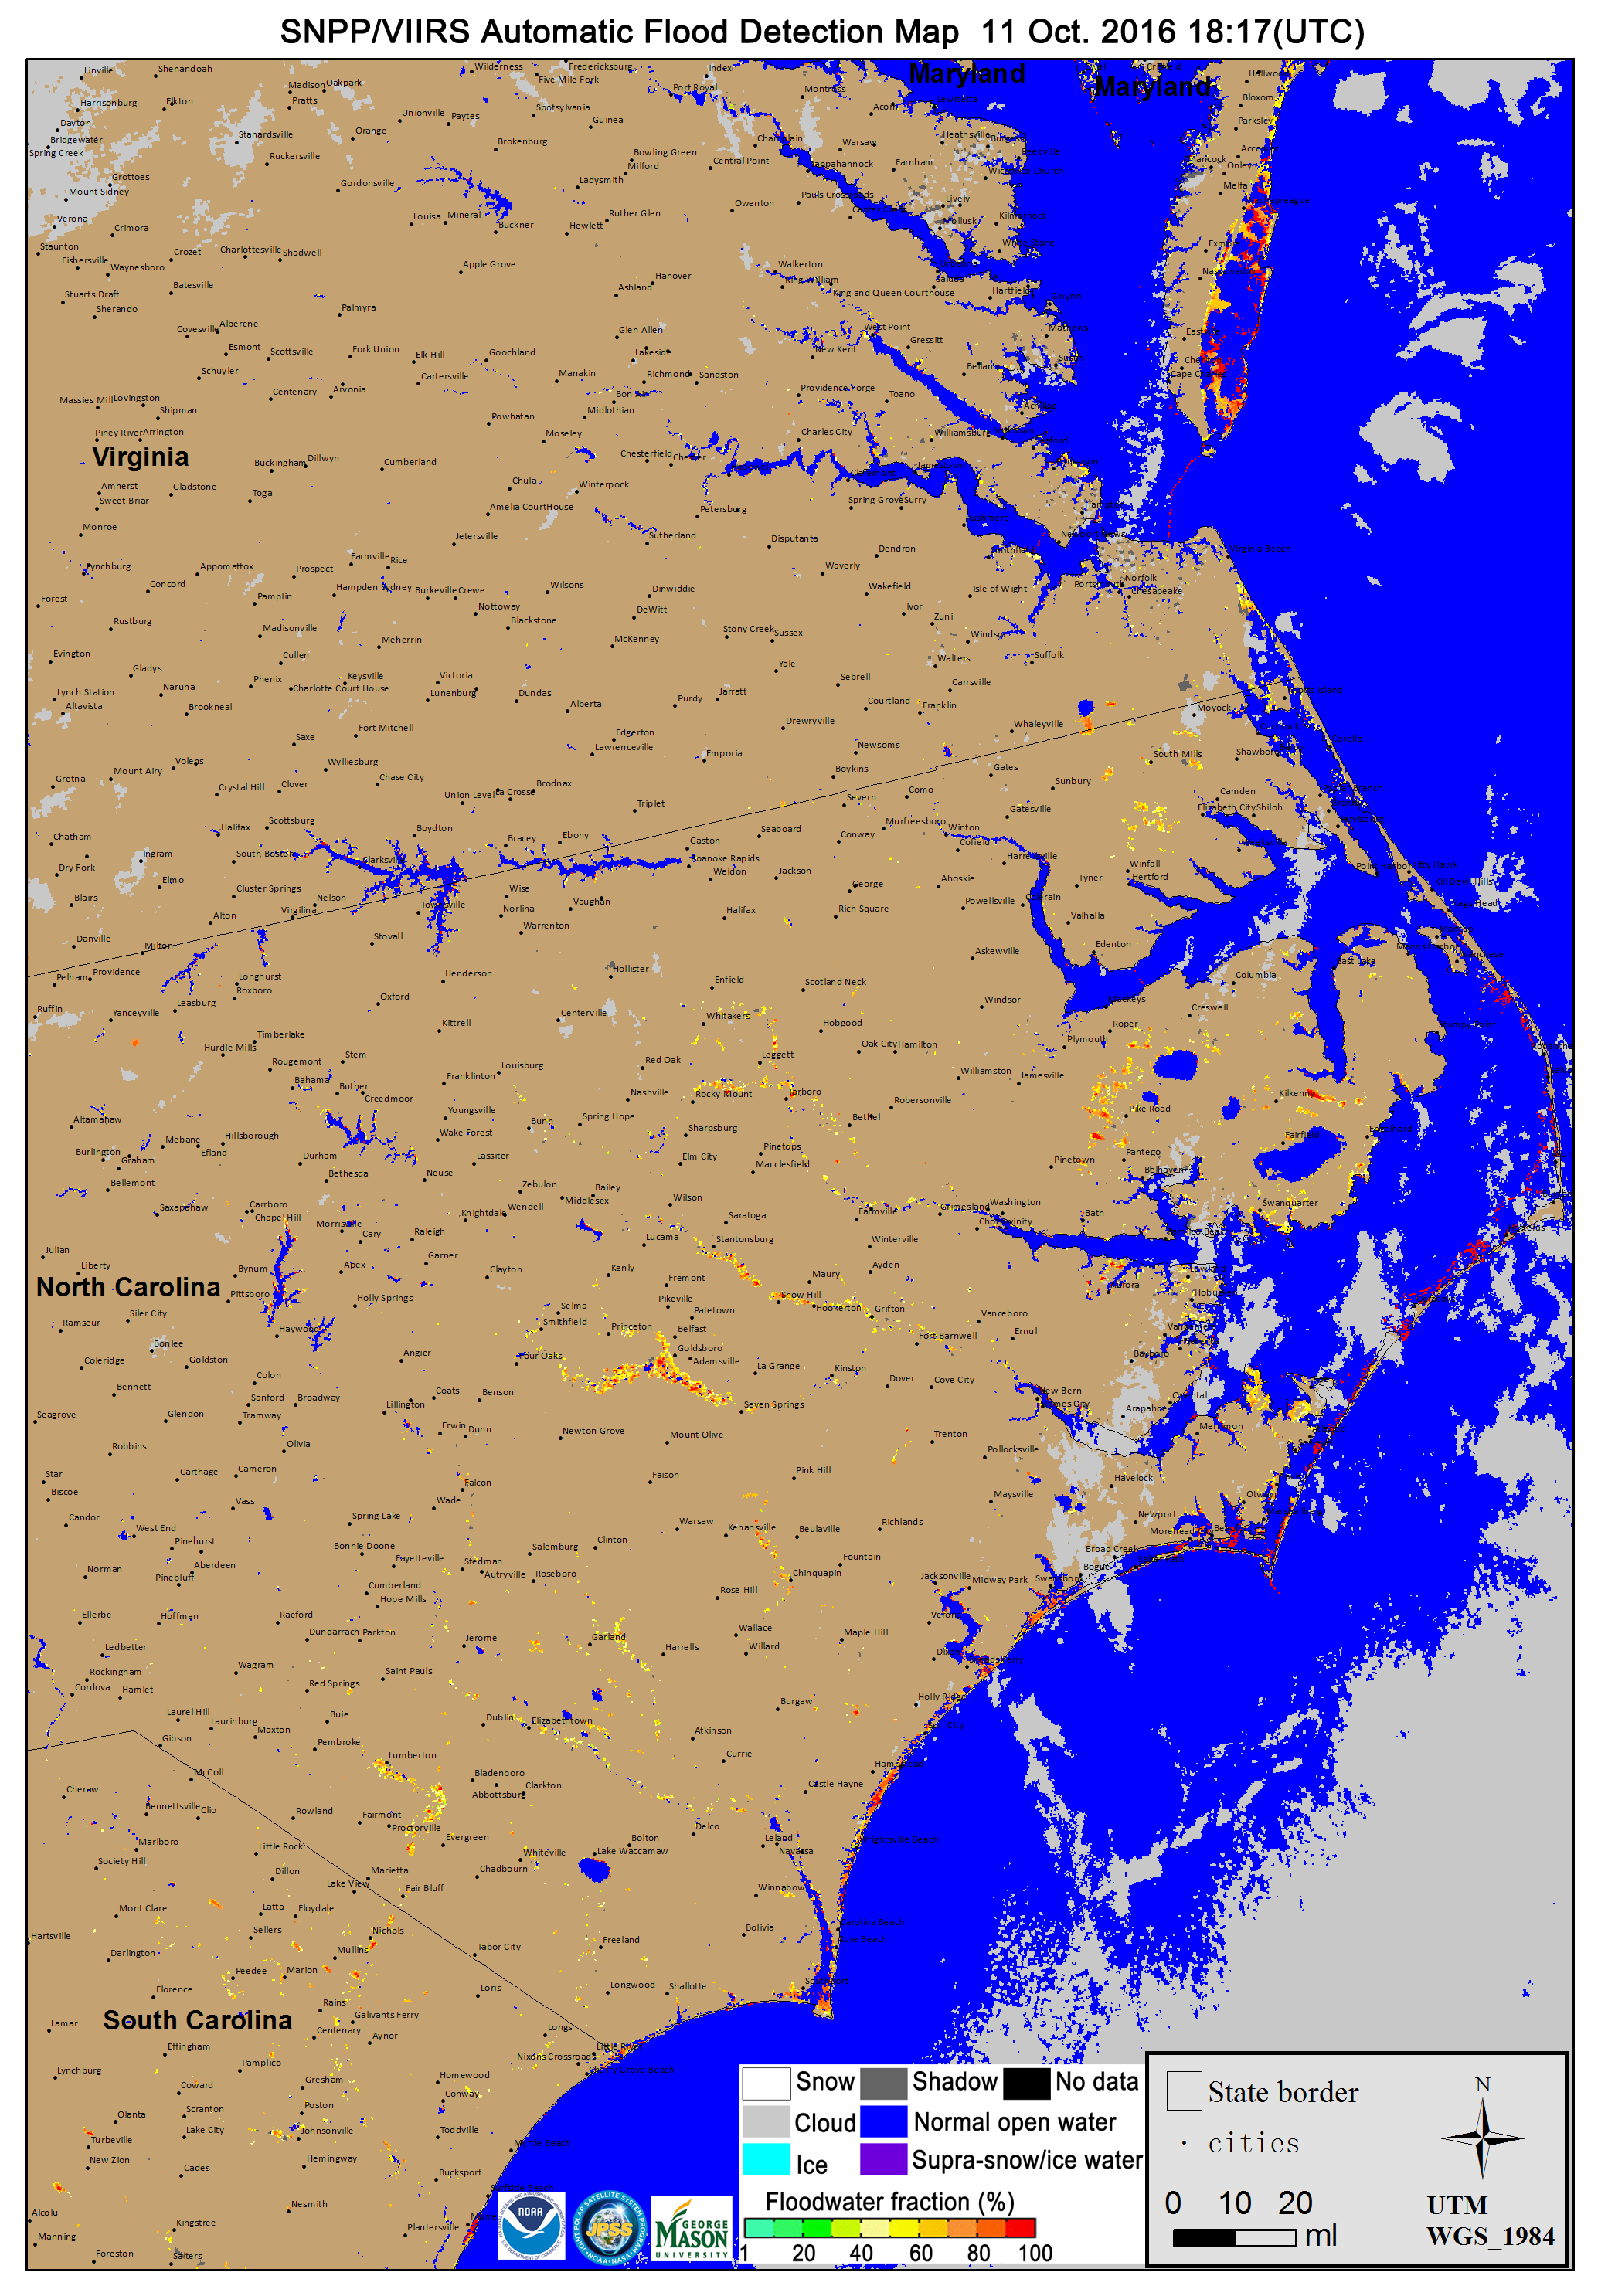
JPSS River Flood product produced with Suomi NPP data, 1817 UTC on 11 October 2016 (Click to enlarge)
A sequence of 1 pre-Matthew (06 September) and 3 post-Matthew (09, 10 and 12 October) Terra/Aqua MODIS false-color RGB images from the SSEC MODIS Today site (below) also helped to highlight areas of flooding (darker shades of blue, especially notable along river valleys) that resulted from the heavy rainfall.
![Terra and Aqua MODIS false-color images, from 06 September and 09, 10 and 12 October 2016 [click to enlarge]](https://cimss.ssec.wisc.edu/satellite-blog/wp-content/uploads/sites/5/2016/10/160906-161012_modis_falsecolor_NC_flooding_Matthew_anim.gif)
Terra and Aqua MODIS false-color images, from 06 September and 09, 10 and 12 October 2016 [click to enlarge]
View only this post
Read Less
![Track of Nicole, from 12 UTC on 04 October to 12 UTC on 13 October [click to enlarge]](https://cimss.ssec.wisc.edu/satellite-blog/wp-content/uploads/sites/5/2016/10/161013_12utc_Nicole_track.jpg)
![Suomi NPP VIIRS Day/Night Band (0.7 µm) and Infrared Window (11.45 µm) images [click to enlarge]](https://cimss.ssec.wisc.edu/satellite-blog/wp-content/uploads/sites/5/2016/10/161013_0615utc_suomi_npp_viirs_Infrared_Day_Night_Band_Nicole_anim.gif)
![DMSP-17 SSMIS Microwave (85 GHz) and GOES-13 Infrared Window (10.7 µm) images [click to enlarge]](https://cimss.ssec.wisc.edu/satellite-blog/wp-content/uploads/sites/5/2016/10/161013_1101utc_dmsp17_ssmis_microwave_1115utc_goes13_infrared_Nicole_anim.gif)
![GOES-13 Visible (0.63 µm) and Infrared Window (10.7 µm) images [click to play animation]](https://cimss.ssec.wisc.edu/satellite-blog/wp-content/uploads/sites/5/2016/10/161013_goes13_visible_infrared_Nicole_anim.gif)
![Bermuda rawinsonde reports from 00, 06, 12 and 15 UTC on 13 October [click to enlarge]](https://cimss.ssec.wisc.edu/satellite-blog/wp-content/uploads/sites/5/2016/10/161013_78016_TXKF_raobs_anim.gif)
![POES and Metop AVHRR, and Terra MODIS infrared images [click to enlarge]](https://cimss.ssec.wisc.edu/satellite-blog/wp-content/uploads/sites/5/2016/10/161013_poes_metop_avhrr_terra_modis_infrared_Nicole_anim.gif)
![GOES-13 Visible (0.63 um) images, with hourly surface winds and gusts in knots [Click to play animation]](https://cimss.ssec.wisc.edu/satellite-blog/wp-content/uploads/sites/5/2016/10/161007_goes13_visible_winds_Matthew_anim.gif)
![GOES-13 Infrared Window (10.7 um) images [Click to play animation]](https://cimss.ssec.wisc.edu/satellite-blog/wp-content/uploads/sites/5/2016/10/161007_goes13_infrared_winds_Matthew_anim.gif)
![Suomi NPP VIIRS Visible (0.64 um) and Infrared Window (11.45 um) images [Click to enlarge]](https://cimss.ssec.wisc.edu/satellite-blog/wp-content/uploads/sites/5/2016/10/161007_1751utc_suomi_npp_viirs_visible_infrared_Matthew_anim.gif)
![GOES-13 Infrared Window (10.7 µm) imagery [Click to play animation]](https://cimss.ssec.wisc.edu/satellite-blog/wp-content/uploads/sites/5/2016/10/161005-06_goes13_infrared_Matthew_Bahamas_anim.gif)
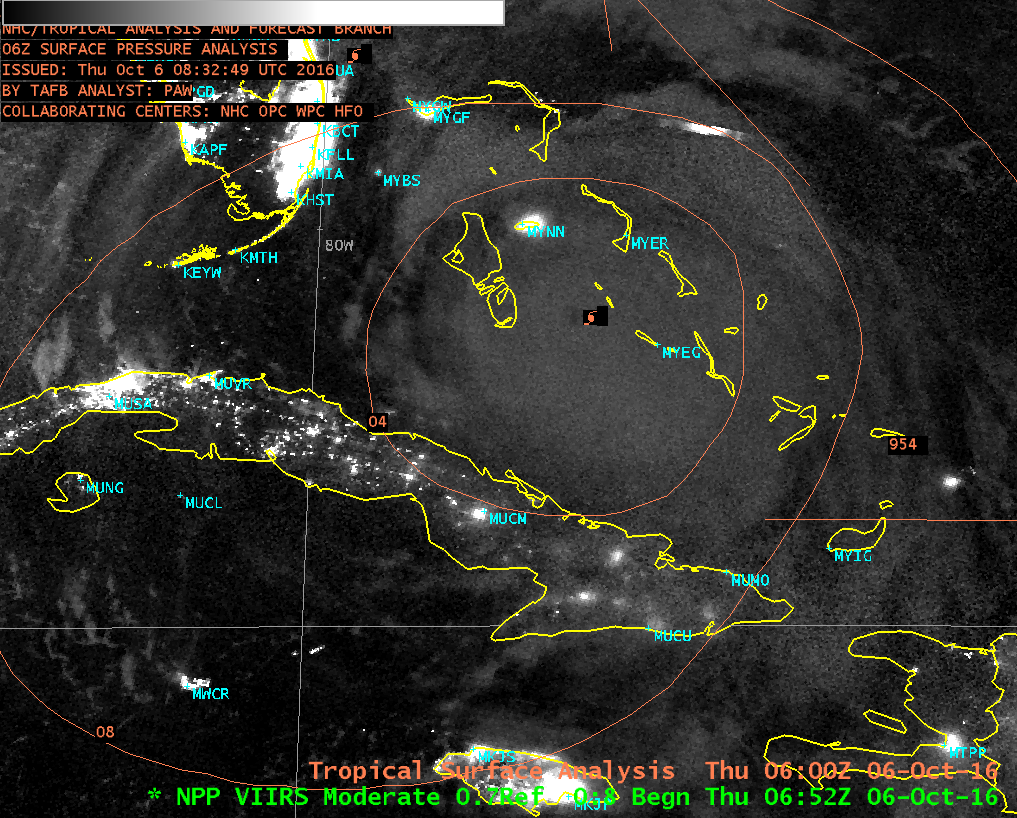
![Suomi NPP VIIRS Infrared Window (11.45 µm) image [Click to enlarge]](https://cimss.ssec.wisc.edu/satellite-blog/wp-content/uploads/sites/5/2016/10/viirs_ir_Matthew-20161006_064548.png)
