
Himawari-8 imagery of all 16 AHI Bands, as indicated, bracketing the launch time of Himawari-9 (Click to enlarge)
Japan successfully launched the Himawari-9 satellite from the Tanegashima Space Center (near the southern tip of Tanegashima in the Osumi Islands south of Kyushu), a back-up to Himawari-8, shortly after 3:20 PM local time (0620 UTC) on 2 November 2016 (News Link 1, 2, 3, 4). Images showing all 16 Himawari-8 AHI spectral bands bracketing the 0620 UTC launch time are shown above; signatures of the warm thermal anomaly (from the burning of the solid rocket boosters) as well as the moisture of the rocket condensation cloud plume were evident in the Shortwave Infrared (3.9 µm) and Water Vapor (6.2 µm, 6.9 µm and 7.3 µm) bands, but a signal was also detectable in the Infrared 8.6 µm, 12.2 µm and 13.3 µm bands. The Himawari-8/9 AHI instrument is nearly identical to the ABI instrument on GOES-R — so similar imagery will be routinely available once GOES-R becomes operational in 2017.
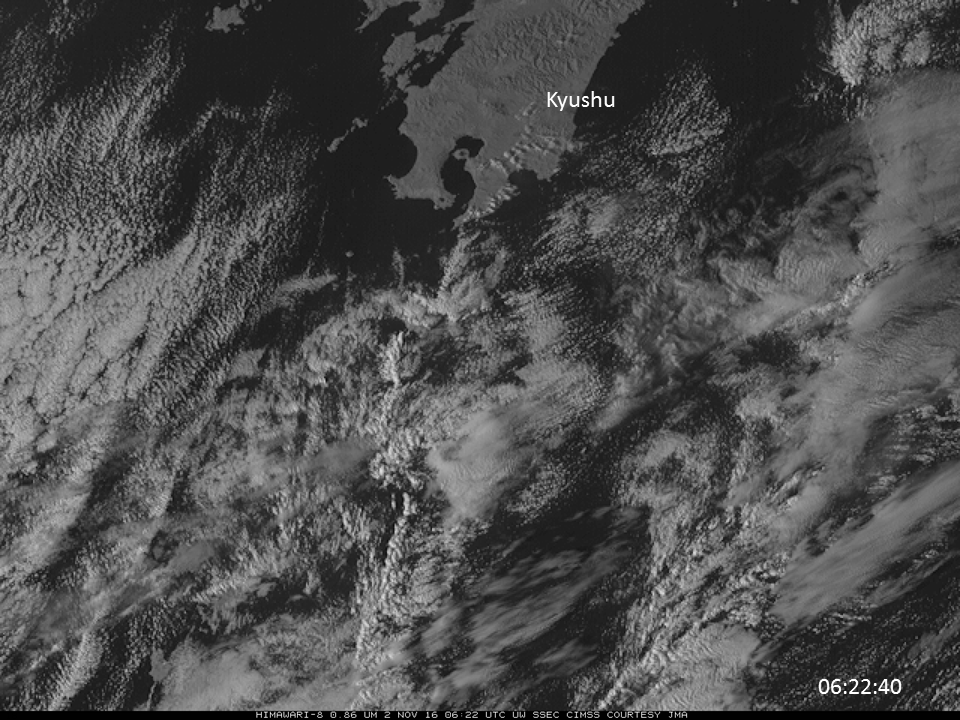
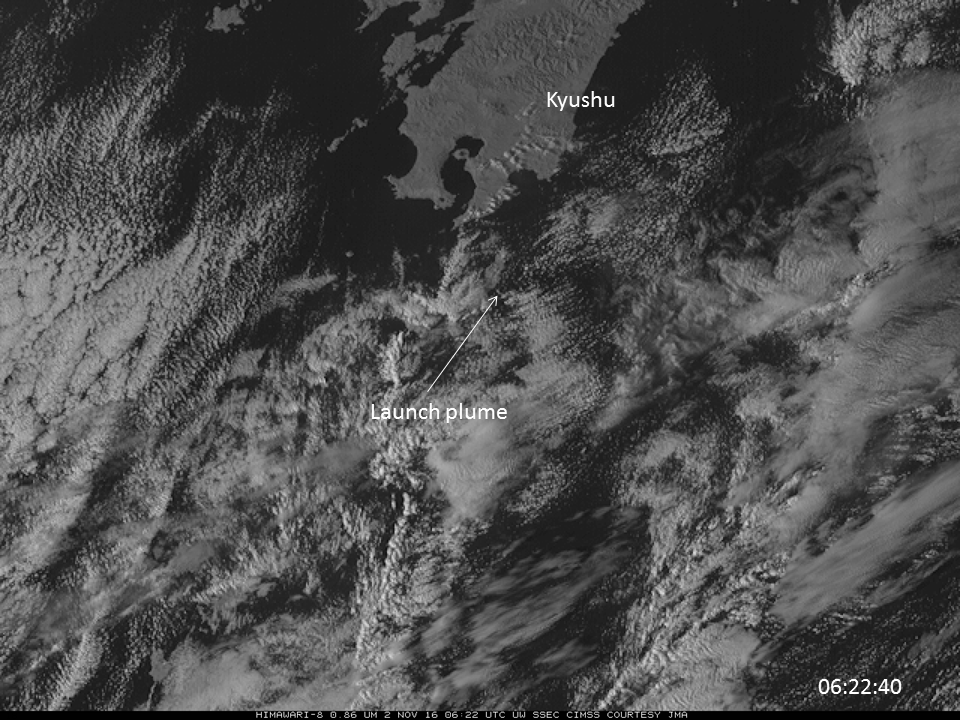
Himawari-8 Band 4 (0.86 µm) Visible Imagery for times bracketing the launch of Himawari-9 on 2 November 2016 (Click to enlarge)
The animation above shows the rocket plume in the Band 4 (0.86 µm) imagery (Band 4, the so-called “Veggie Band”, better discriminates between land and water so that the island of Tanegashima is more distinct) from Himawari-8, in the image at 0622 UTC. (Annotated 0622 UTC Image is here). The plume appears north of the launch site (which is located at the southern tip of the island).
A true-color image, below, that includes the three visible channels from Himawari-8 (Band 1 at 0.47 µm, Band 2 at 0.51 µm and Band 3 at 0.64 µm, with the Band 2 “Green Band” boosted by information in the Veggie Band at 0.86 µm) shows a plume, perhaps, emerging from the cloud field at the southern tip of the island.
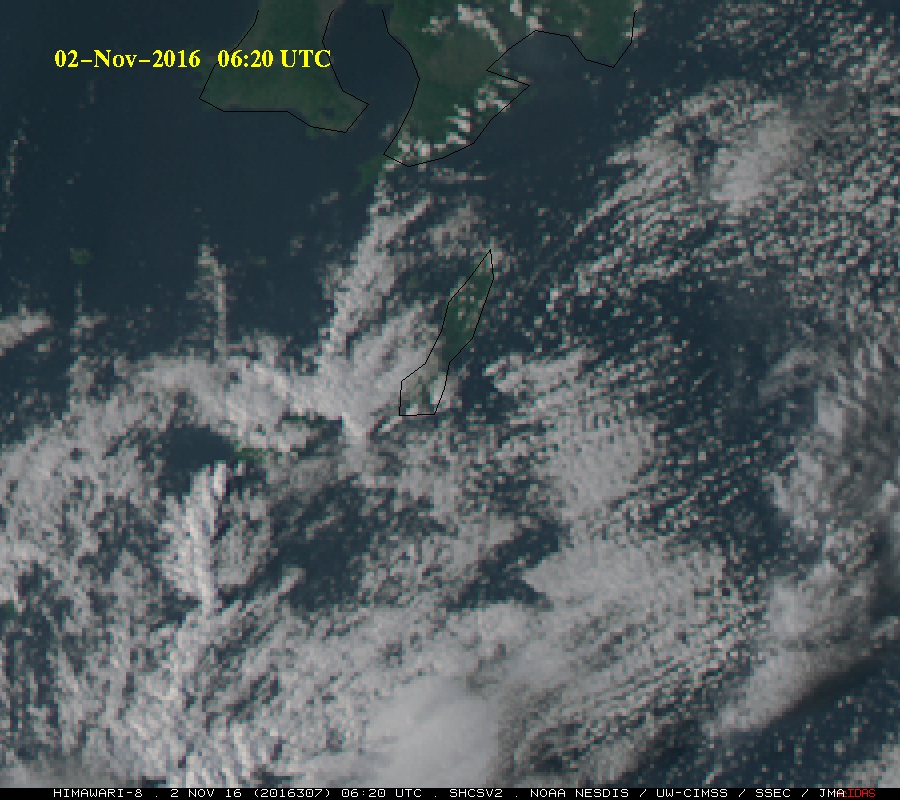
True-color imagery from Himawari-8 at 0620 UTC on 2 November, 2016 (Click to enlarge)
Another view of the 3.9 µm Shortwave Infrared imagery, below, shows a short-lived hot-spot near where the Band 4 imagery shows the plume. Note: due to parallax, the location of the high-altitude hot spot appears farther north than its actual location.
Himawari-8 Band 7 (3.9 µm) Shortwave Infrared Imagery for times bracketing the launch of Himawari-9 on 2 November 2016 (Click to enlarge)
Visible Imagery for the same three times, below, suggests a plume may be present (toggle between Visible and Shortwave Infrared images).
Himawari-8 Band 3 (0.64 µm) Imagery for times bracketing the launch of Himawari-9 on 2 November 2016 (Click to enlarge)
As mentioned above, signatures of the warm thermal anomaly and the moisture of the rocket condensation cloud plume were also evident on the three Himawari-8 Water Vapor bands, shown below — strong westerly winds aloft (satellite | model) quickly transported the high-altitude portion of the rocket plume eastward.
Himawari-8 6.2 µm (top), 6.9 µm (middle) and 7.3 µm (bottom) Water Vapor images [click to enlarge]
View only this post Read Less
![EUMETSAT Meteosat-10 Infrared Window (10.8 um) images [click to play MP4 animation]](https://cimss.ssec.wisc.edu/satellite-blog/wp-content/uploads/sites/5/2016/10/960x1280_MSG_B9_MET10_IR_MEDICANE_28-31OCT2016_2016304_120000_0001PANEL.GIF)
![EUMETSAT Meteosat-10 Visible (0.64um) images [click to play MP4 animation]](https://cimss.ssec.wisc.edu/satellite-blog/wp-content/uploads/sites/5/2016/10/960x1280_MSG_B12_MET10_VIS_MEDICANE_30OCT2016_2016304_120000_0001PANEL.GIF)
![Suomi NPP VIIRS true-color images [click to enlarge]](https://cimss.ssec.wisc.edu/satellite-blog/wp-content/uploads/sites/5/2016/10/161028-31_suomi_npp_viirs_truecolor_Medicane_anim.gif)
![MIMIC Total Precipitable Water product [click to play animation]](https://cimss.ssec.wisc.edu/satellite-blog/wp-content/uploads/sites/5/2016/10/161028-31_mimic_tpw_anim.gif)
![Metop-A and Metop-B ASCAT surface scatterometer winds, 28-31 October [click to play animation]](https://cimss.ssec.wisc.edu/satellite-blog/wp-content/uploads/sites/5/2016/10/161028-31_metop_ascat_medicane_anim.gif)
![Suomi NPP ATMS Channel 8 (54.94 GHz) image, 31 October at 0037 UTC [click to enlarge]](https://cimss.ssec.wisc.edu/satellite-blog/wp-content/uploads/sites/5/2016/10/atms_201699A_161031_0037utc_ch8.gif)
![Suomi NPP ATMS Channel 7 (53.596 GHz) image, 31 October at 0037 UTC [click to enlarge]](https://cimss.ssec.wisc.edu/satellite-blog/wp-content/uploads/sites/5/2016/10/atms_201699A_161031_0037utc_ch7.gif)
![North-to-south vertical cross section of Suomi NPP ATMS brightness temperature anomaly [click to enlarge]](https://cimss.ssec.wisc.edu/satellite-blog/wp-content/uploads/sites/5/2016/10/atms_201699A_161031_0037utc_xsection.gif)
![GOES-15 Visible (0.63 µm) images, 23 through 25 October 2016, with hourly surface observations [click to play animation]](https://cimss.ssec.wisc.edu/satellite-blog/wp-content/uploads/sites/5/2016/10/161023-25_goes15_visible_Copper_River_glacial_silt_anim.gif)
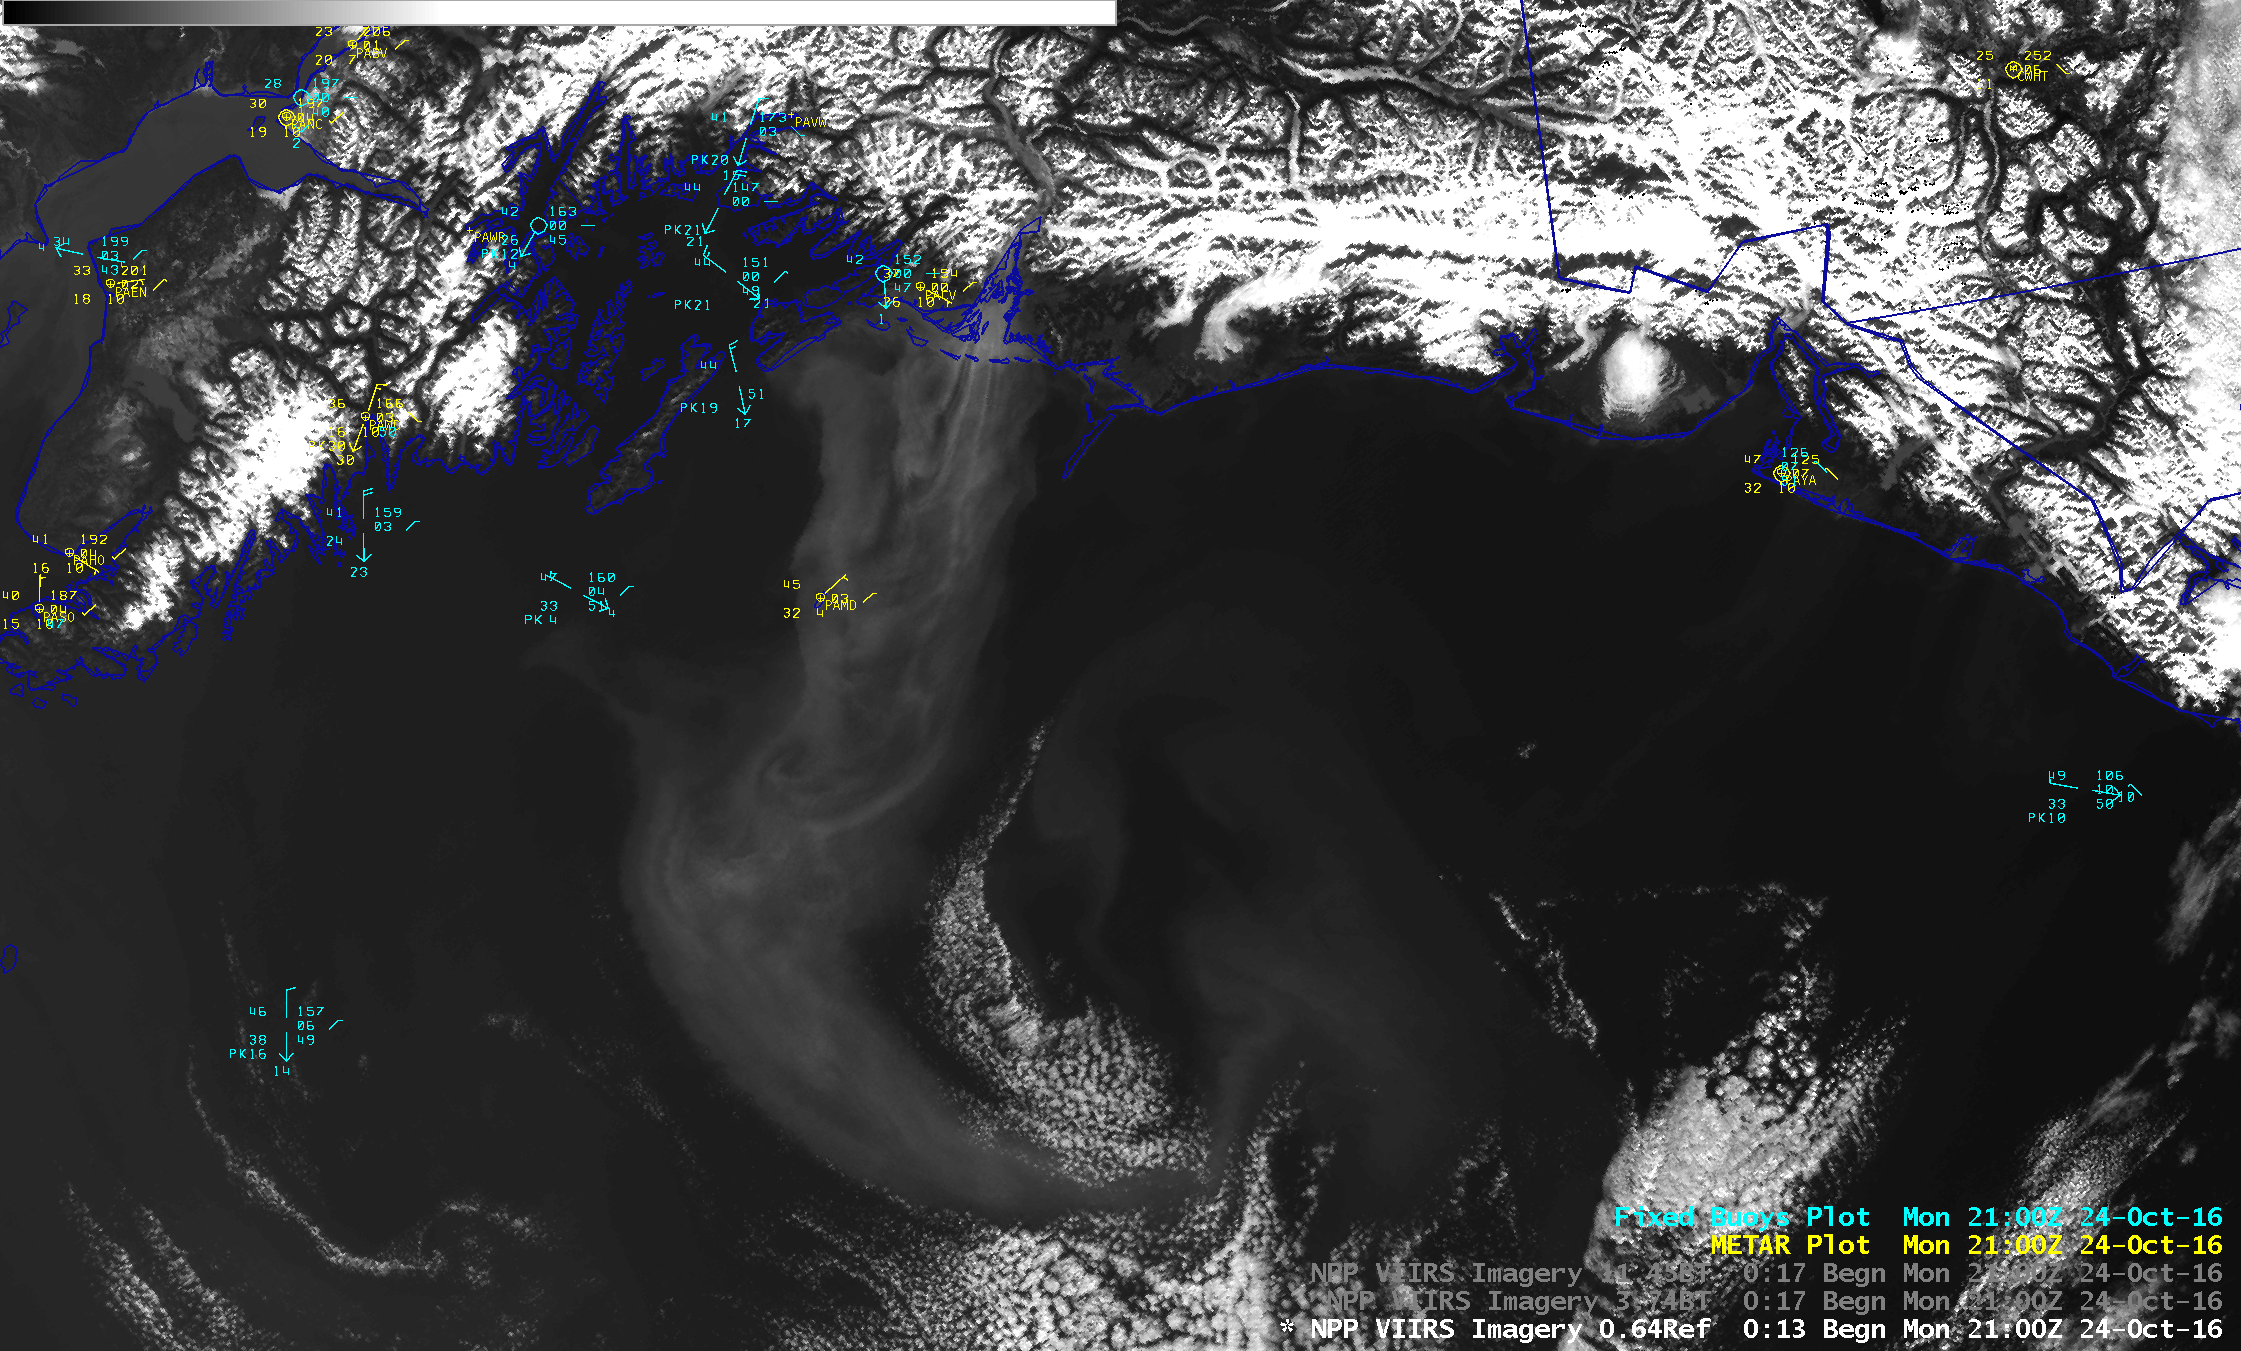
![Suomi NPP VIIRS Visible (0.64 µm), Shortwave Infrared (3.74 µm) and Infrared Window (11.45 µm) images on 24 October 2016 [click to enlarge]](https://cimss.ssec.wisc.edu/satellite-blog/wp-content/uploads/sites/5/2016/10/161024_suomi_npp_viirs_Visible_ShortwaveIR_Infrared_Window_Copper_River_AK_glacial_silt_anim.gif)
![Suomi NPP VIIRS Visible (0.64 µm), Shortwave Infrared (3.74 µm) and Infrared Window (11.45 µm) images on 25 October 2016 [click to enlarge]](https://cimss.ssec.wisc.edu/satellite-blog/wp-content/uploads/sites/5/2016/10/161025_suomi_npp_viirs_Visible_ShortwaveIR_Infrared_Window_Copper_River_AK_glacial_silt_anim.gif)
![Time series of surface observations at Middleton Island in the Gulf of Alaska [click to enlarge]](https://cimss.ssec.wisc.edu/satellite-blog/wp-content/uploads/sites/5/2016/10/161023-25_PAMD_SFCMG.GIF)
![Time series of surface observations at Cordova, Alaska [click to enlarge]](https://cimss.ssec.wisc.edu/satellite-blog/wp-content/uploads/sites/5/2016/10/161023-25_PACV_SFCMG.GIF)
![Suomi NPP VIIRS true-color RGB images [click to enlarge]](https://cimss.ssec.wisc.edu/satellite-blog/wp-content/uploads/sites/5/2016/10/161024_suomi_npp_viirs_truecolor_truecolor_Copper_River_Valley_glacial_silt_anim.gif)
![Suomi NPP VIIRS true-color RGB and Aerosol Optical Depth images for 23 October [click to enlarge]](https://cimss.ssec.wisc.edu/satellite-blog/wp-content/uploads/sites/5/2016/10/161023_suomi_npp_viirs_aot_rgb_anim.gif)
![Suomi NPP VIIRS true-color RGB and Aerosol Optical Thickness images for 24 October [click to enlarge]](https://cimss.ssec.wisc.edu/satellite-blog/wp-content/uploads/sites/5/2016/10/161024_suomi_npp_viirs_aot_rgb_anim.gif)
![Suomi NPP VIIRS true-color RGB and Aerosol Optical Thickness images for 25 October [click to enlarge]](https://cimss.ssec.wisc.edu/satellite-blog/wp-content/uploads/sites/5/2016/10/161025_suomi_npp_viirs_aot_rgb_anim.gif)
![Terra MODIS Visible (0.64 µm) and Infrared (11.0-12.0 µm) Brightness Temperature Difference images [click to enlarge]](https://cimss.ssec.wisc.edu/satellite-blog/wp-content/uploads/sites/5/2016/10/161025_2031utc_terra_modis_visible_ir_btd_Copper_River_AK_plume_anim.gif)
![Nighttime (0706 UTC) and daytime (2031 UTC) Terra MODIS Infrared (11-12 µm) Brightness Temperature Difference images [click to enlarge]](https://cimss.ssec.wisc.edu/satellite-blog/wp-content/uploads/sites/5/2016/10/161025_0706utc_2031utc_terra_modis_ir_btd_Copper_River_AK_plume_anim.gif)
