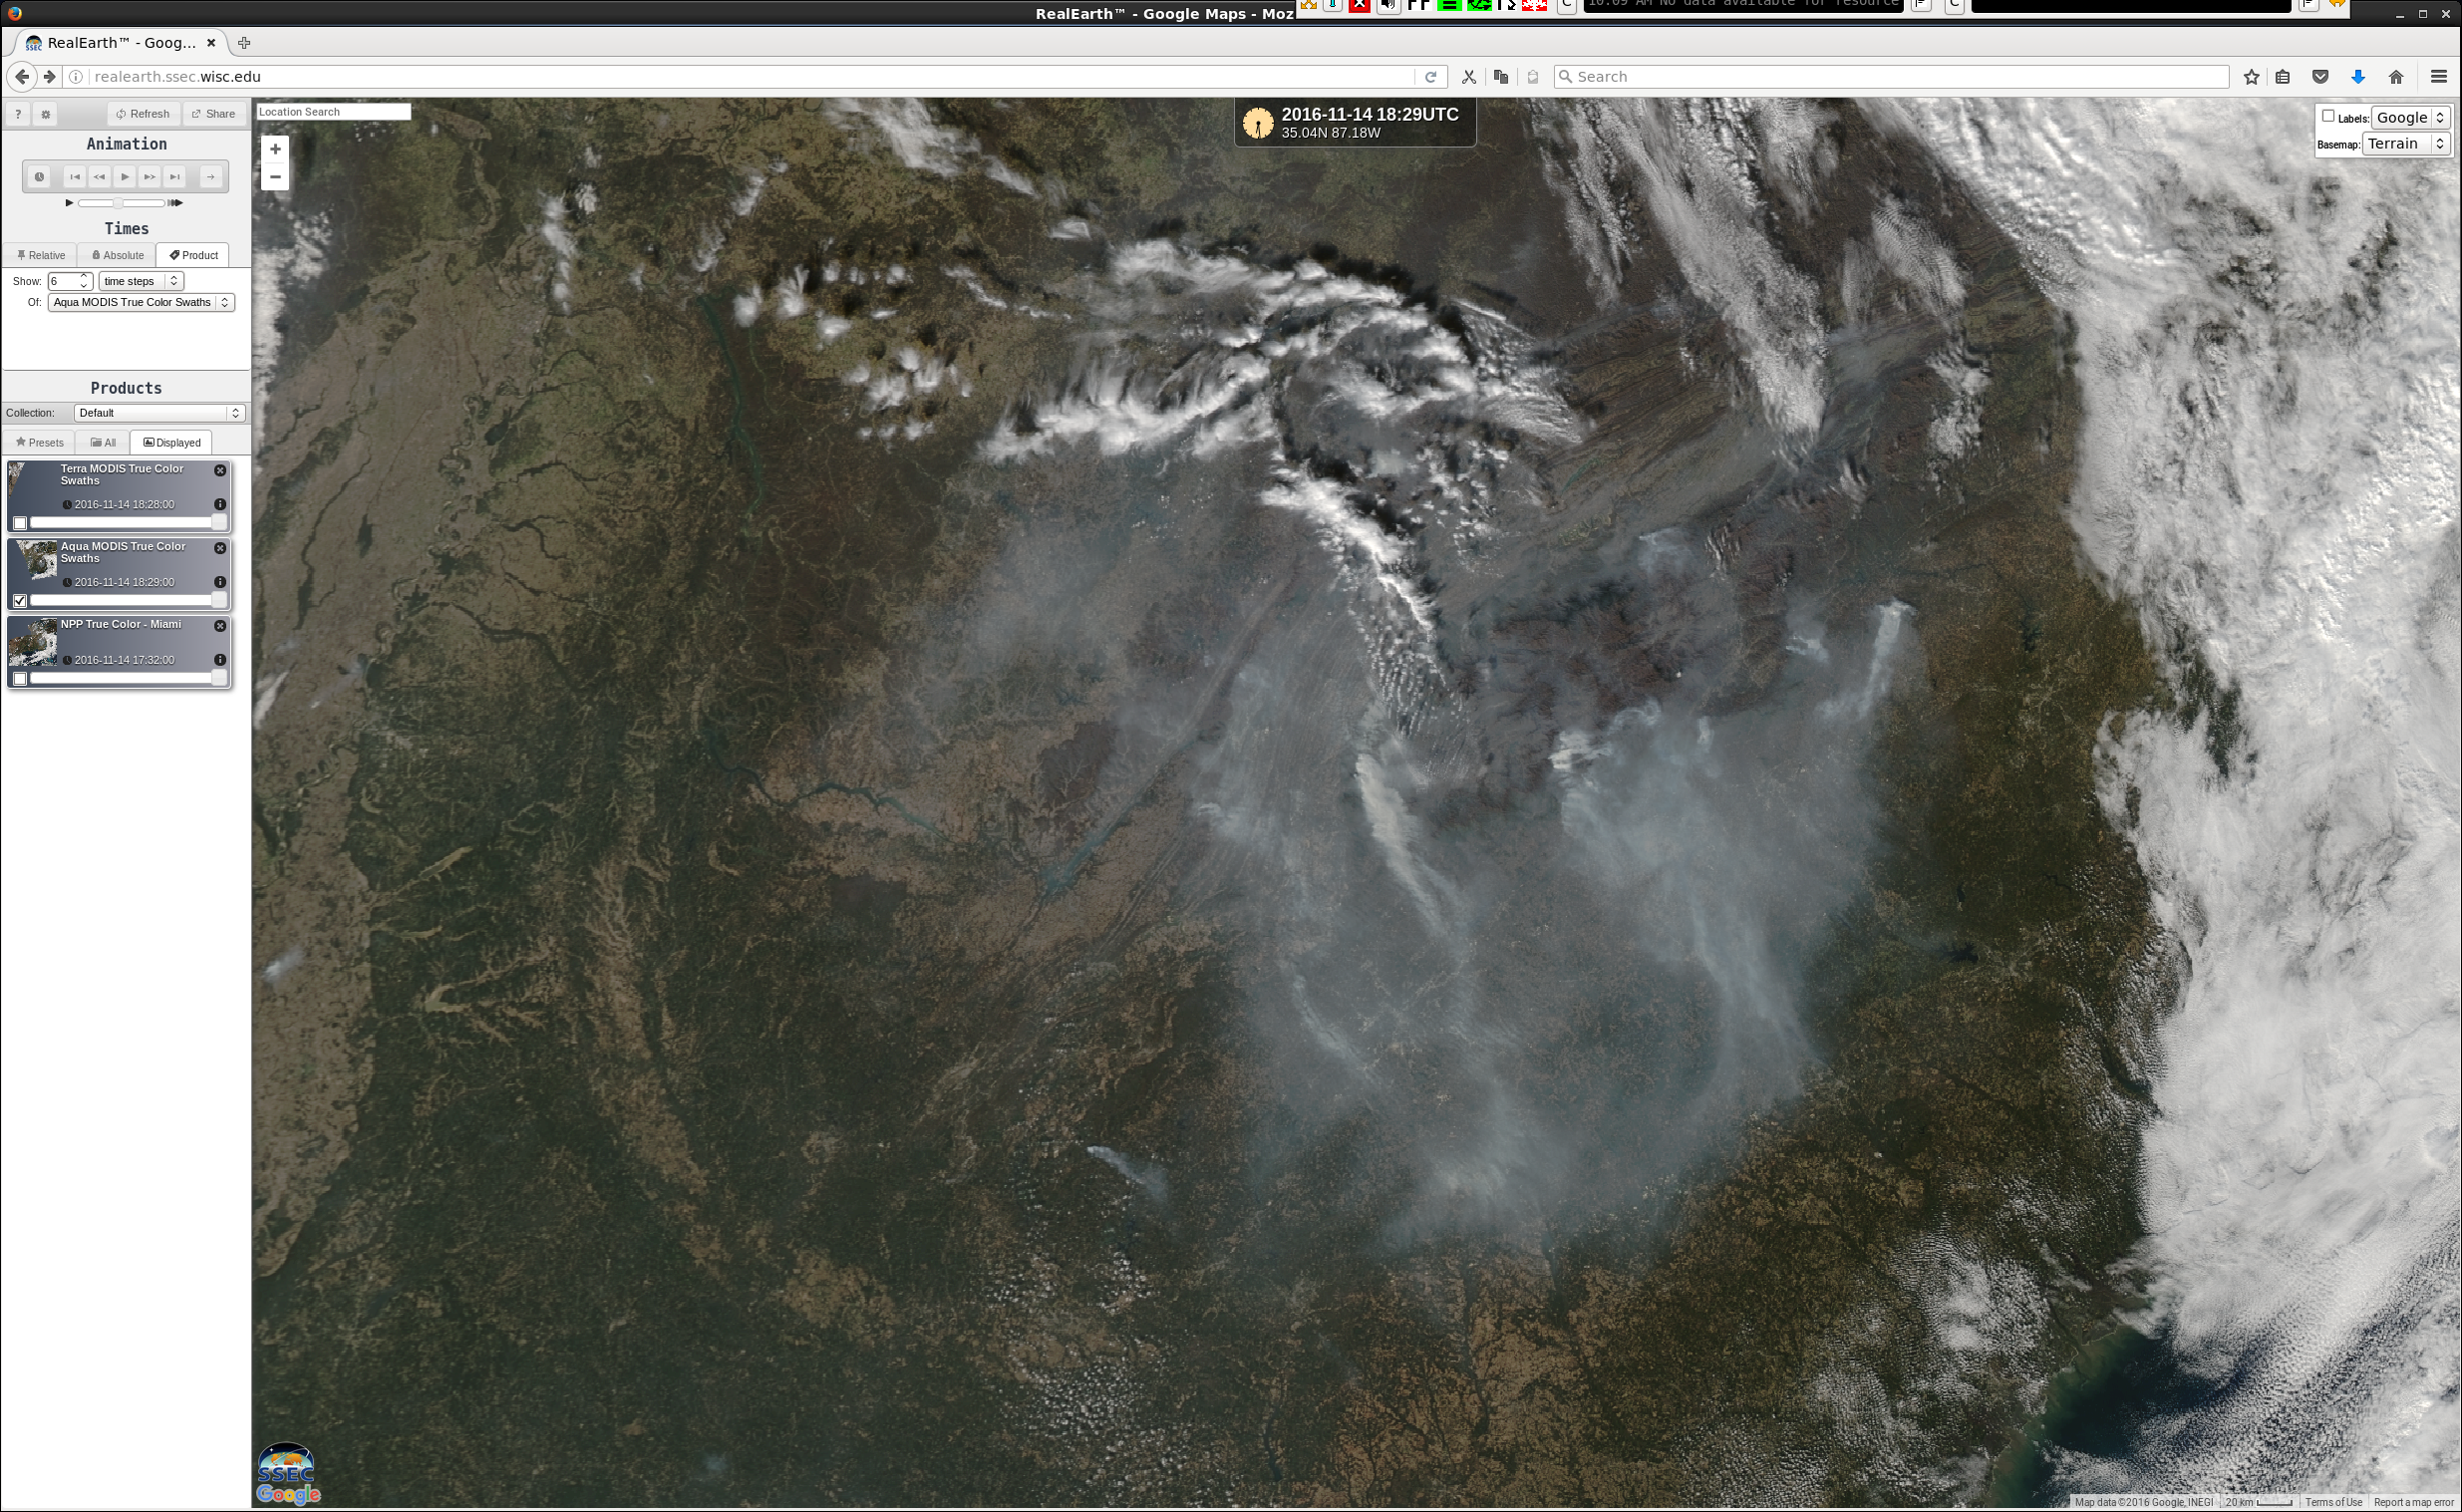
Fires (as seen on 07 and 10 November) continued to burn in parts of the southeast US on 14 November 2016. A sequence of 3 consecutive true-color Red/Green/Blue (RGB) images from Terra MODIS (1650 UTC), Aqua MODIS (1829 UTC) and Suomi NPP VIIRS (1913 UTC) viewed using RealEarth, above, showed the aerial extent of the... Read More
![Terra MODIS (1650 UTC), Aqua MODIS (1829 UTC) and Suomi NPP VIIRS (1913 UTC) true-color images [click to enlarge]](https://cimss.ssec.wisc.edu/satellite-blog/wp-content/uploads/sites/5/2016/11/161114_modis_viirs_truecolor_Southeast_US_fires_anim.gif)
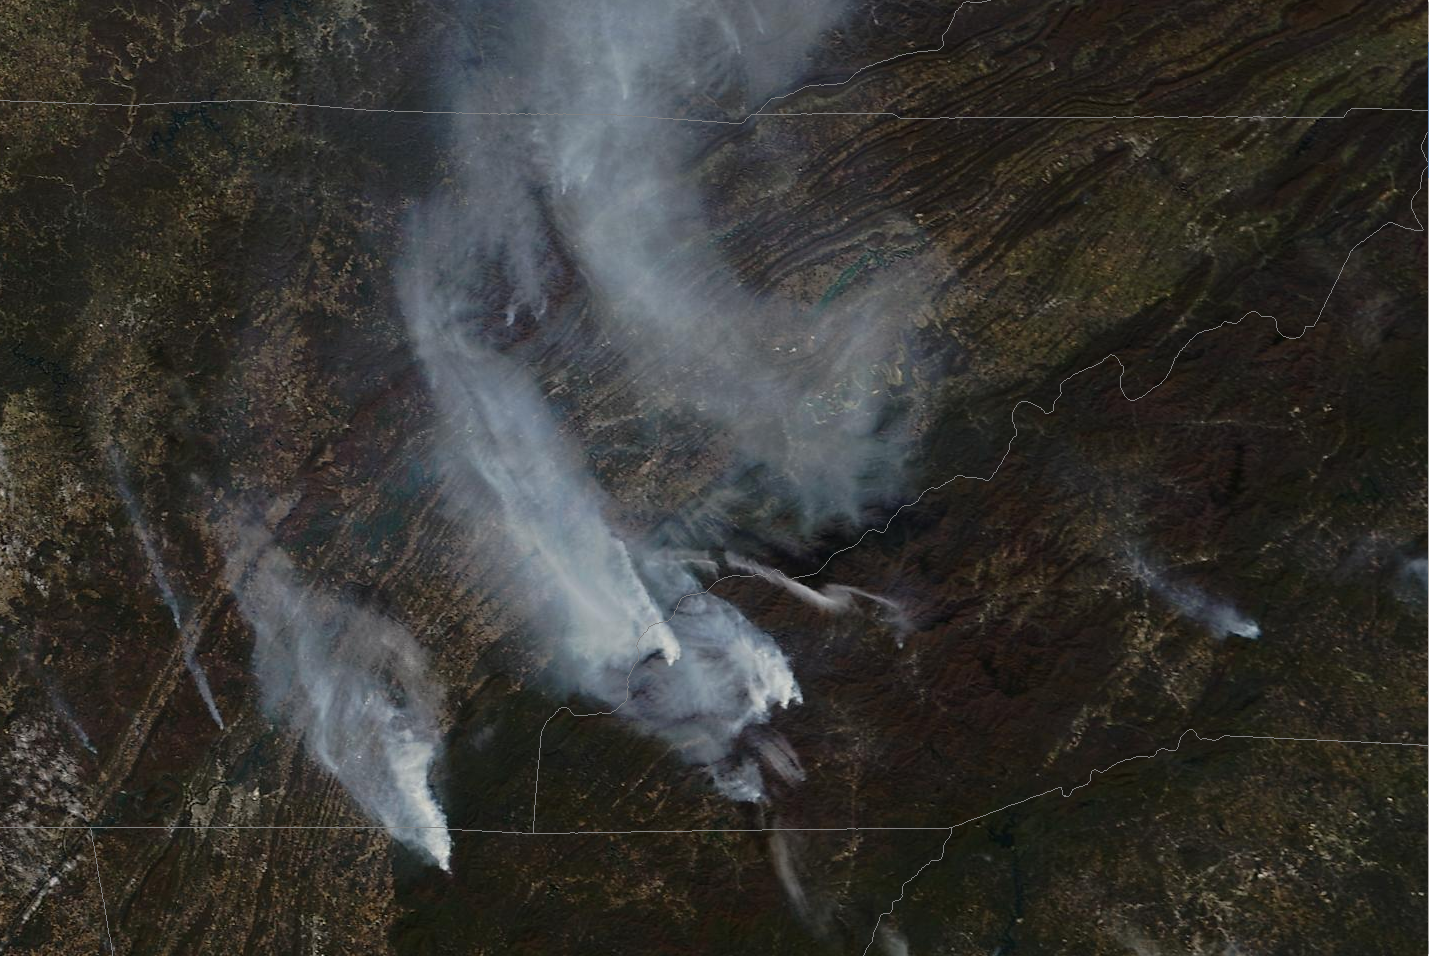
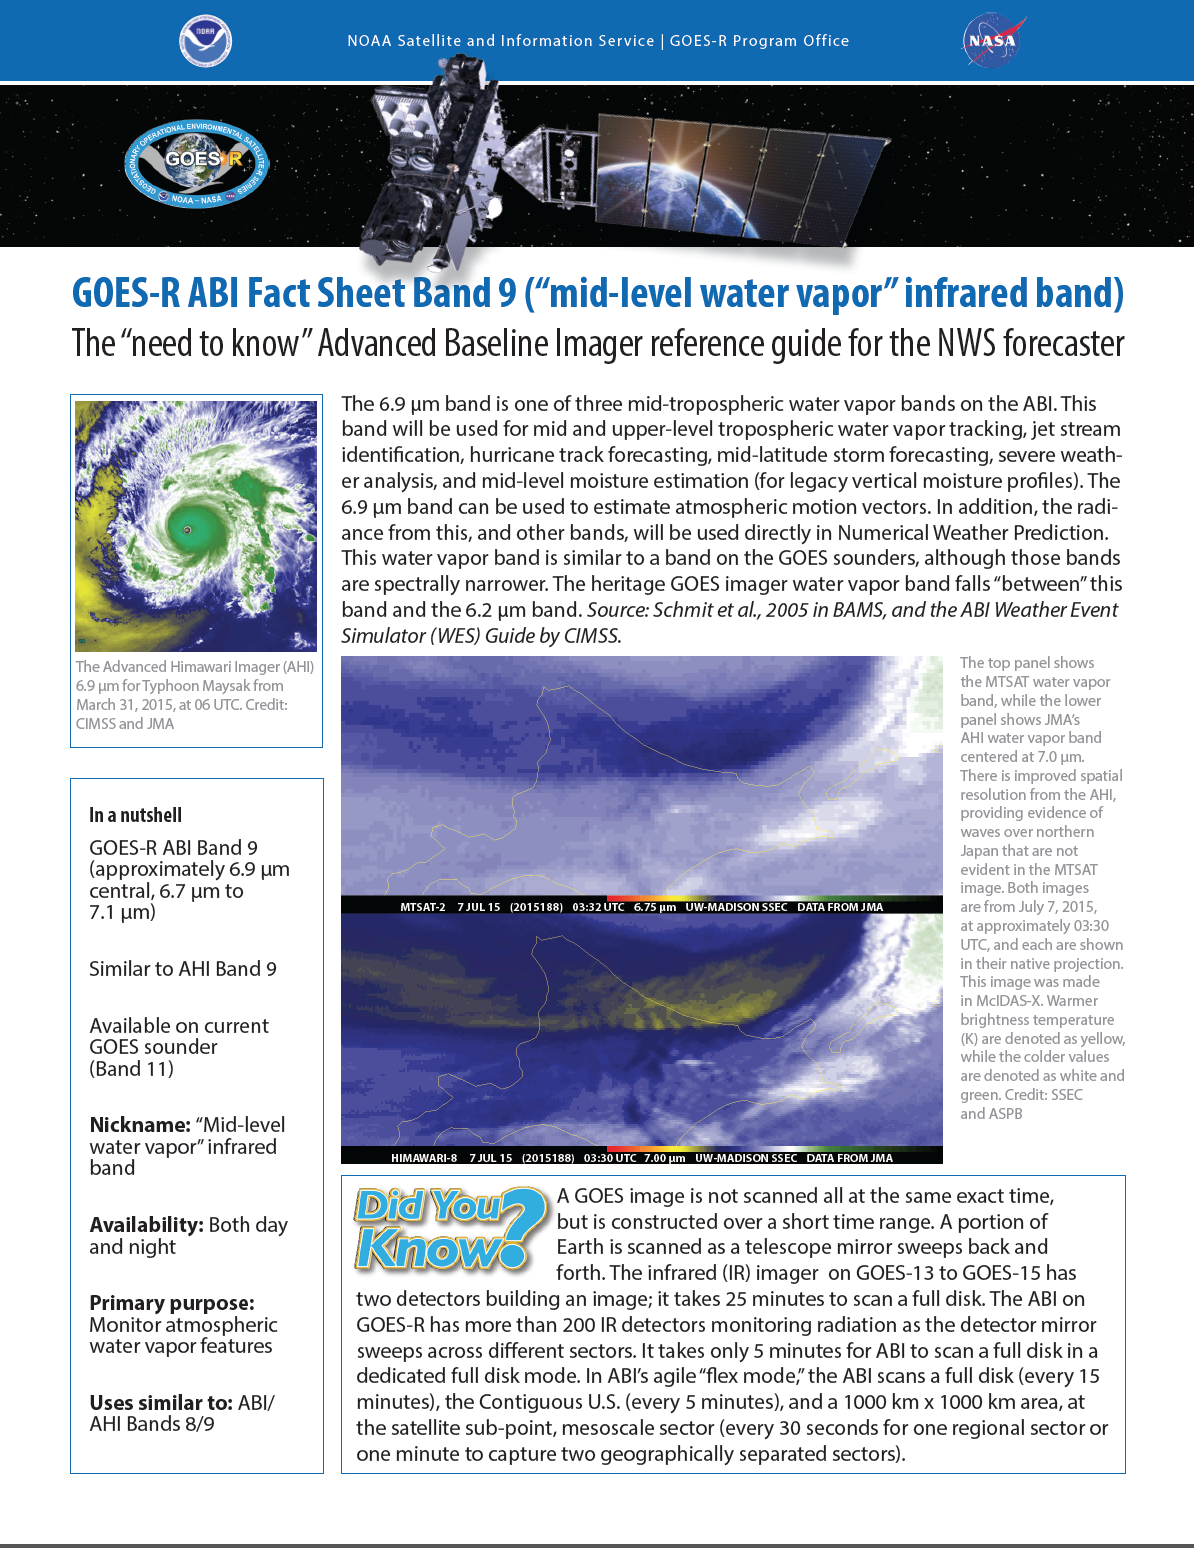
Terra MODIS (1650 UTC), Aqua MODIS (1829 UTC) and Suomi NPP VIIRS (1913 UTC) true-color images [click to enlarge]
Fires (as seen on
07 and 10 November) continued to burn in parts of the southeast US on
14 November 2016. A sequence of 3 consecutive true-color Red/Green/Blue (RGB) images from Terra MODIS (1650 UTC), Aqua MODIS (1829 UTC) and Suomi NPP VIIRS (1913 UTC) viewed using
RealEarth,
above, showed the aerial extent of the dense smoke that was most concentrated over Tennessee, Georgia, North Carolina and South Carolina. With the aid of some of the 16 spectral bands on the
ABI instrument aboard
GOES-R, true-color images like these will be available at least once every 5 minutes over the Lower 48 states and adjacent areas.
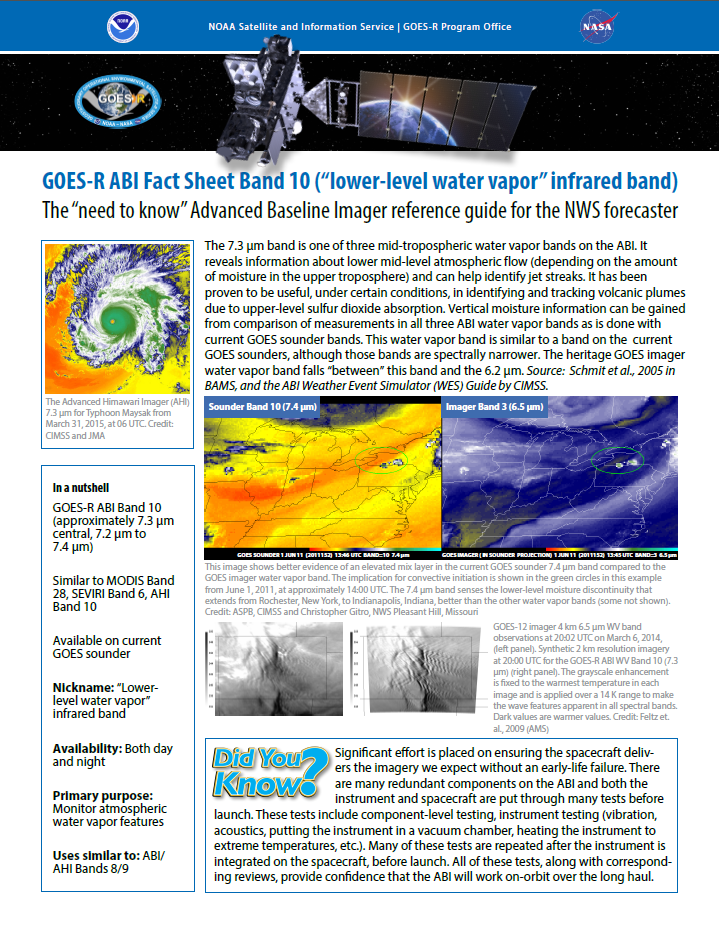
GOES-13 (GOES-East) Visible (0.63 µm) images with plots of surface weather and visibility (below; also available as an MP4 animation) revealed that visibility was restricted to 3 miles or less at one or more sites in all of the aforementioned states. A pair of pilot reports in eastern Tennessee indicated that he top of the smoke layer was at 6000 feet above ground level.
![GOES-13 Visible (0.63 µm) images, with hourly plots of surface weather (yellow) and visibility (statute miles, in cyan) [click to animate]](https://cimss.ssec.wisc.edu/satellite-blog/wp-content/uploads/sites/5/2016/11/960x1280_EASTL_B1_GOES13_VIS_SEUS_FIRES_14NOV2016_2016319_211500_0001PANEL.GIF)
GOES-13 Visible (0.63 µm) images, with hourly plots of surface weather (yellow) and visibility (statute miles, in cyan) [click to animate]
High loading of particulate matter (PM) due to smoke led to
AIRNow Air Quality Index ratings of Unhealthy (red) to Very Unhealthy (purple) over much of that 4-state region
(below).
Hourly AIRNow Particulate Matter (PM) Air Quality Index (AQI)
===== 15 November Update =====
![Suomi NPP VIIRS Shortwave Infrared (3.74 um) and Day/Night Band (0.7 um) images, plus METAR surface reports [click to enlarge]](https://cimss.ssec.wisc.edu/satellite-blog/wp-content/uploads/sites/5/2016/11/161115_0735utc_suomi_npp_viirs_shortwaveIR_DayNightBand_Southeast_US_fires_anim.gif)
Suomi NPP VIIRS Shortwave Infrared (3.74 um) and Day/Night Band (0.7 um) images, plus METAR surface reports [click to enlarge]
A toggle between Suomi NPP VIIRS Shortwave Infrared (3.74 um) and Day/Night Band (0.7 um) images (with and without METAR surface reports) at 0735 UTC or 3:35 am local time on
15 November (above) showed the “hot spot” signatures and bright glow from the larger fires that were burning in northern Georgia and western North Carolina. With ample illumination from the Moon — which was in the Waning Gibbous phase, at 99% of Full — smoke plumes from some of these fires could be seen drifting southward or southeastward, thanks to the “visible image at night” capability of the Day/Night Band.
During the subsequent daytime hours, Terra MODIS and Suomi NPP VIIRS true-color RGB images (below) again revealed the vast coverage of the thick smoke — and VIIRS Aerosol Optical Depth values were quite high over South Carolina. Unhealthy AQI values persisted during much of the day across parts of Tennessee, Georgia and South Carolina.
![Terra MODIS and Suomi NPP VIIRS true-color images, with VIIRS Aerosol Optical Depth (click to enlarge]](https://cimss.ssec.wisc.edu/satellite-blog/wp-content/uploads/sites/5/2016/11/161115_terra_modis_truecolor_suomi_npp_viirs_truecolor_aod_Southeast_US_fires_anim.gif)
Terra MODIS and Suomi NPP VIIRS true-color images, with VIIRS Aerosol Optical Depth (click to enlarge]
A sampling of pilot reports (PIREPS) showed some of the impacts that the smoke was having on aviation (below).
![Suomi NPP VIIRS Visible (0.64 µm) image with a PIREP over South Carolina [click to enlarge]](https://cimss.ssec.wisc.edu/satellite-blog/wp-content/uploads/sites/5/2016/11/161115_1859utc_viirs_visible_pirep_SC.jpg)
Suomi NPP VIIRS Visible (0.64 µm) image with a PIREP over South Carolina [click to enlarge]
![Aqua MODIS Visible (0.65 µm) image with a PIREP over Georgia [click to enlarge]](https://cimss.ssec.wisc.edu/satellite-blog/wp-content/uploads/sites/5/2016/11/161115_1912utc_modis_visible_pirep_GA.jpg)
Aqua MODIS Visible (0.65 µm) image with a PIREP over Georgia [click to enlarge]
![GOES-13 Visible (0.63 µm) image with a PIREP over North Carolina [click to enlarge]](https://cimss.ssec.wisc.edu/satellite-blog/wp-content/uploads/sites/5/2016/11/161115_2115utc_goes13_visible_pirep_NC.jpg)
GOES-13 Visible (0.63 µm) image with a PIREP over North Carolina [click to enlarge]
===== 16 November Update =====
![Terra/Aqua MODIS and Suomi NPP VIIRS true- color images [click to enlarge]](https://cimss.ssec.wisc.edu/satellite-blog/wp-content/uploads/sites/5/2016/11/161116_1637utc_terra_modis_1818utc_aqua_modis_1840utc_suomi_npp_viirs_truecolor_anim.gif)
Terra/Aqua MODIS and Suomi NPP VIIRS true- color images [click to enlarge]
Terra/Aqua MODIS and Suomi NPP VIIRS true-color images
(above) showed that much of the smoke had moved over the adjacent offshore waters of the Atlantic Ocean on
16 November.
View only this post
Read Less
![GOES-15 Water Vapor (6.5 µm) images, with hourly surface and buoy/ship reports [click to play MP4 animation]](https://cimss.ssec.wisc.edu/satellite-blog/wp-content/uploads/sites/5/2016/11/960x1280_AGOES15_B3_GOES15_WV_G_OF_AK_15-17NOV2016_2016320_200000_0001PANEL.GIF)
![JMA Hmawari-8 Water Vapor (6.2 µm, top; 6.9 µm, middle; 7.3 µm, bottom) images [click to play MP4 animation]](https://cimss.ssec.wisc.edu/satellite-blog/wp-content/uploads/sites/5/2016/11/320x1280_AHIM08_B8910_HIM08_WV_3PANEL_N_PACIFIC_HF_LOW_15NOV2016_2016320_235000_0003PANELS.GIF)
![GOES-13 Visible (0.63 µm) images, with hourly plots of surface weather (yellow) and visibility (statute miles, in cyan) [click to animate]](https://cimss.ssec.wisc.edu/satellite-blog/wp-content/uploads/sites/5/2016/11/161114_goes13_visible_surface_weather_and_visibility_Southeast_US_fires_anim.gif)
![Terra MODIS Visible (0.65 µm), Cirrus (1.375 µm) and Infrared Window (11.0 µm) images [click to enlarge]](https://cimss.ssec.wisc.edu/satellite-blog/wp-content/uploads/sites/5/2016/11/161114_1650utc_terra_modis_visible_cirrus_infrared_anim.gif)
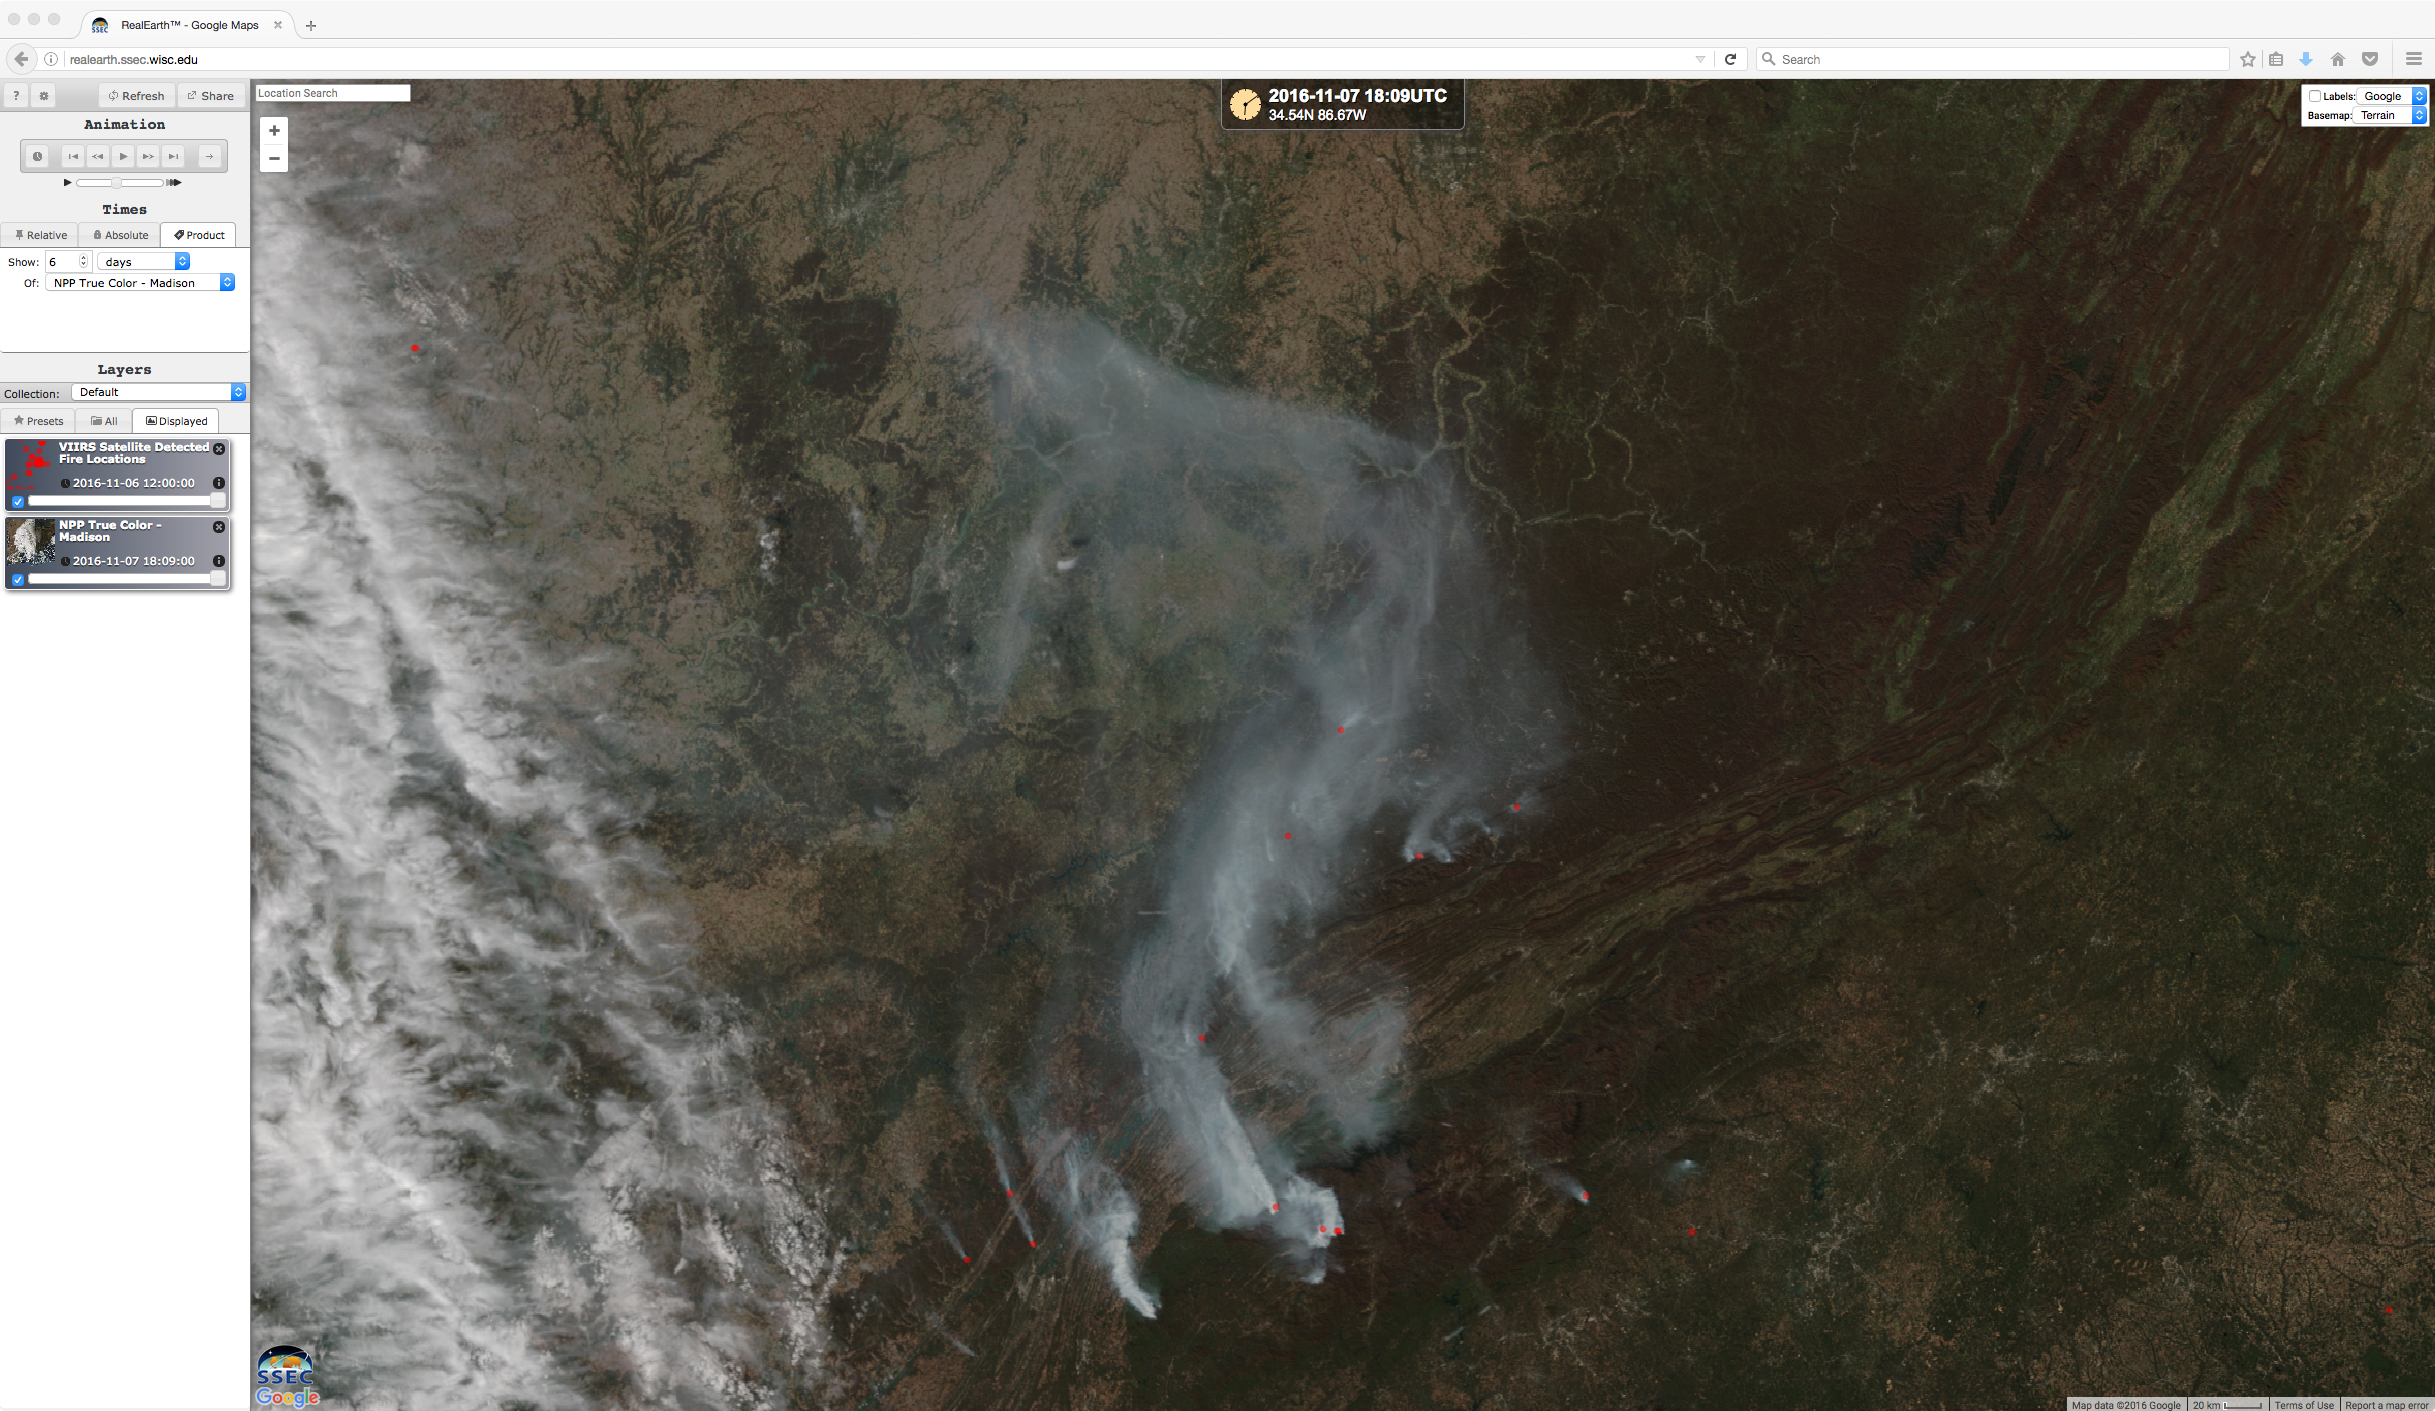
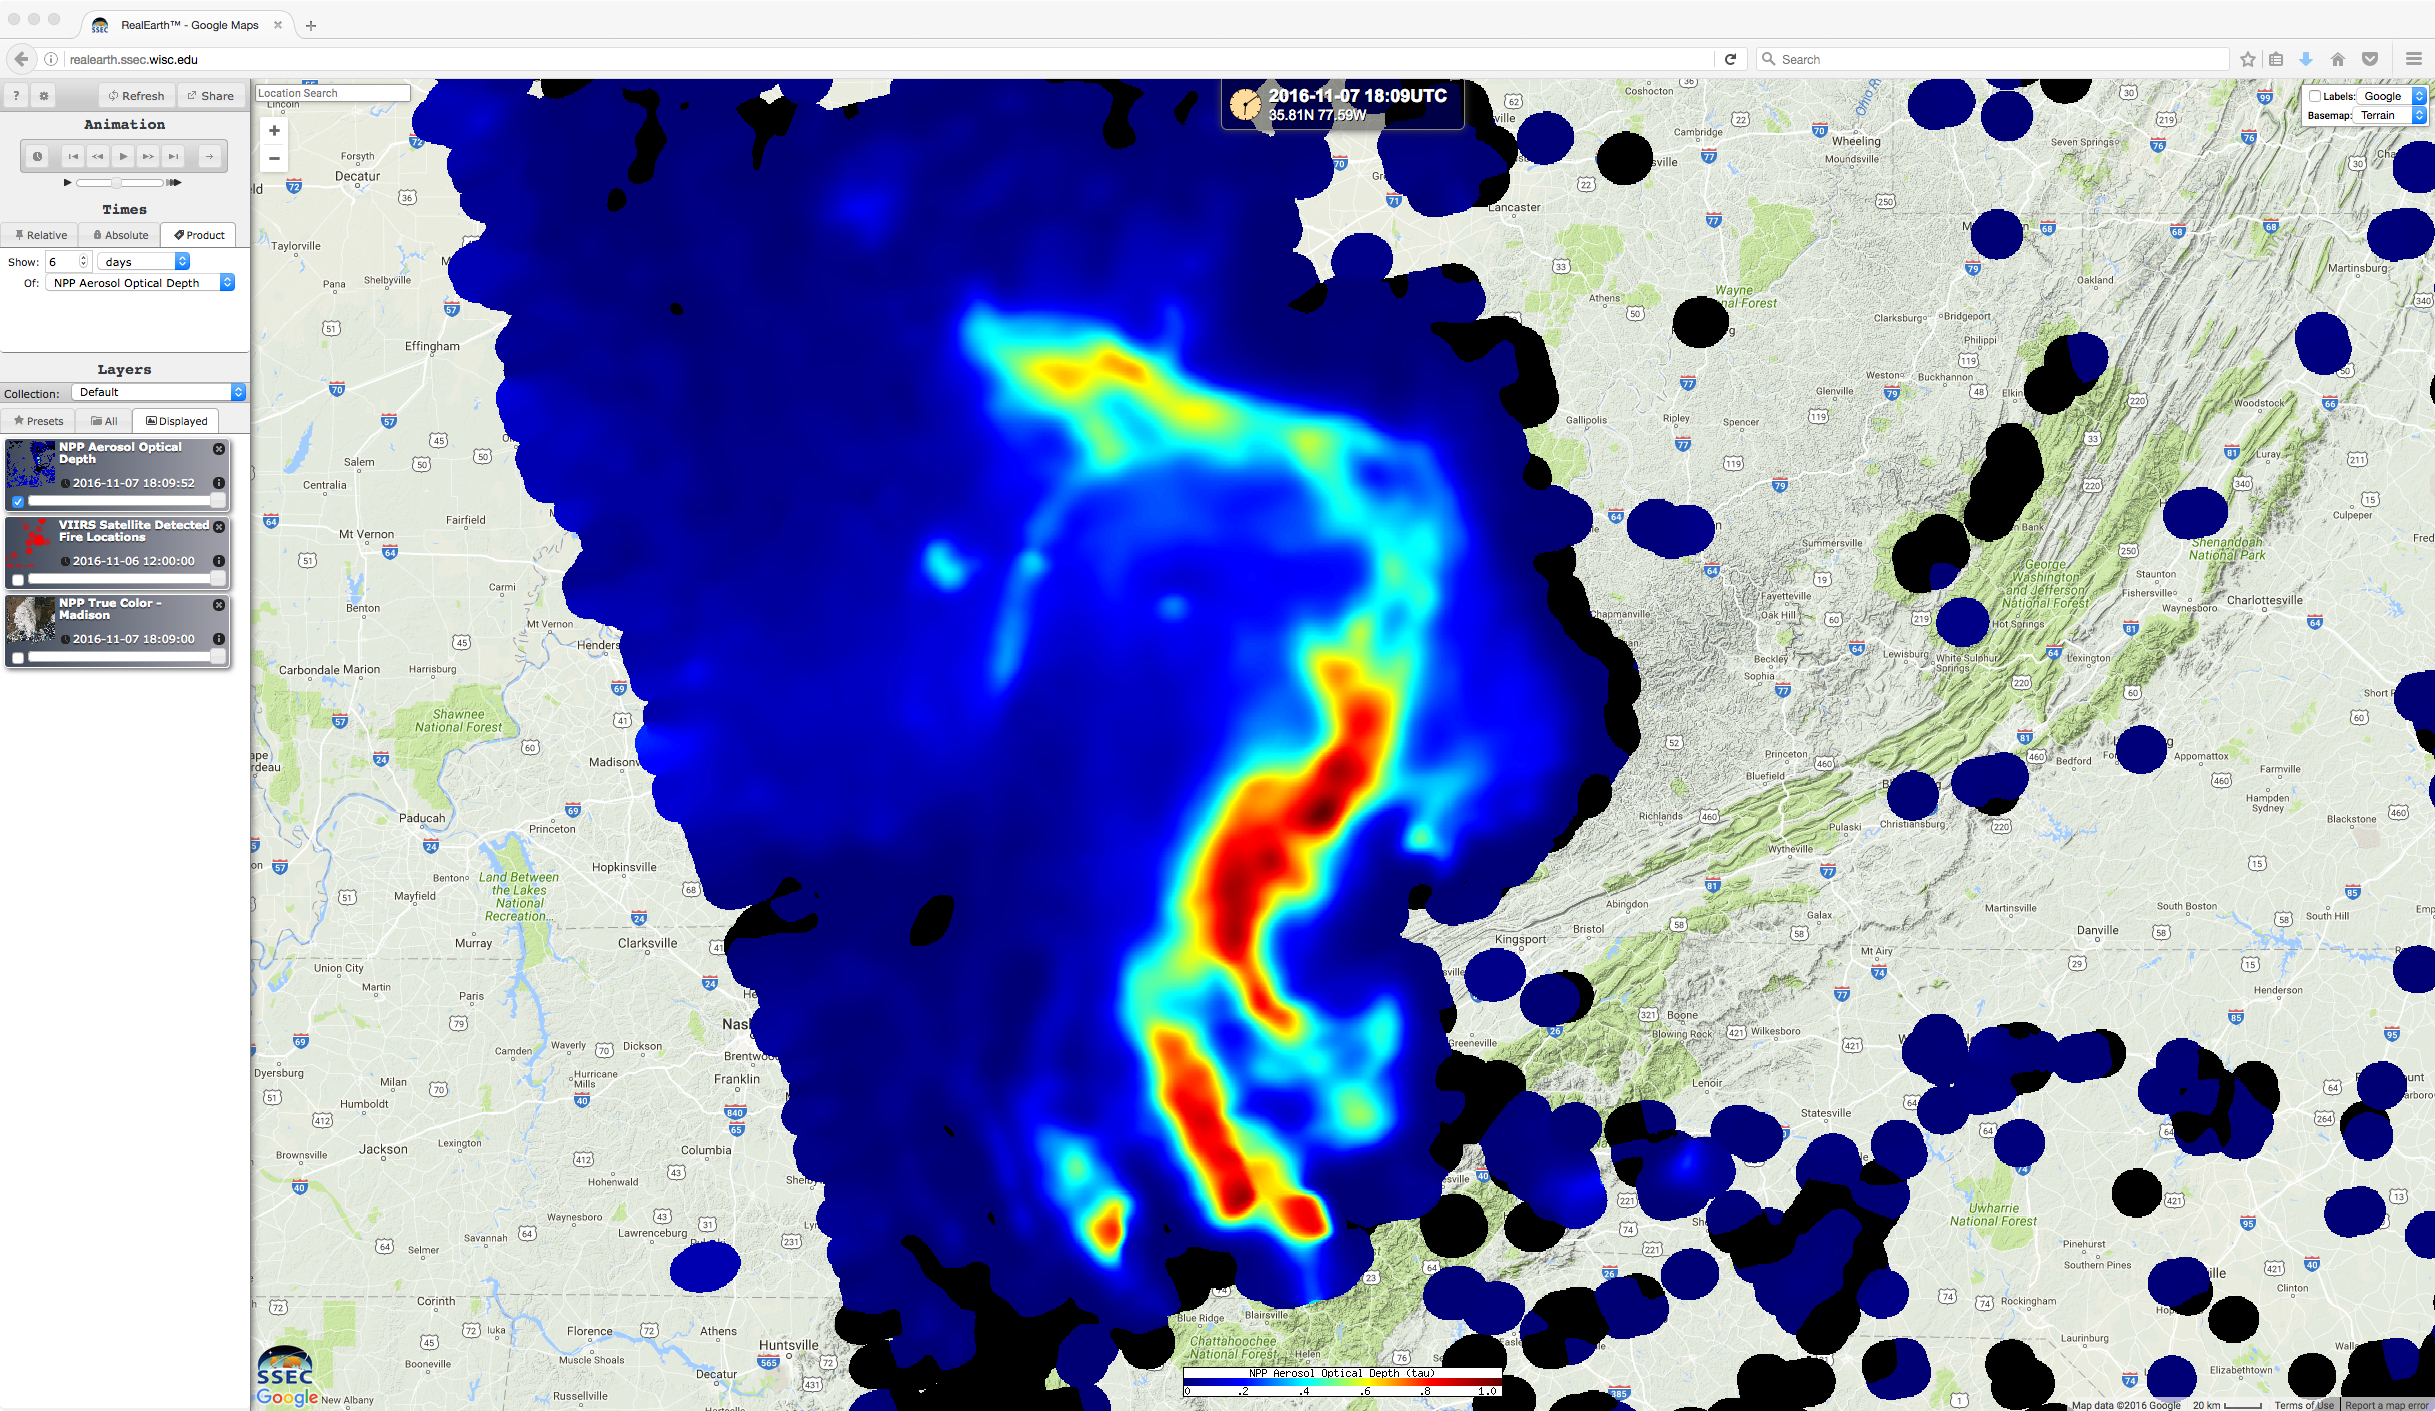
![Suomi NPP VIIRS true-color image with fire detection locations (red dots), and VIIRS Aerosol Optical Depth product [click to enlarge]](https://cimss.ssec.wisc.edu/satellite-blog/wp-content/uploads/sites/5/2016/11/161107_1809utc_suomi_npp_viirs_truecolor_fire_detection_aerosol_optical_depth_anim.gif)
![Terra MODIS, Suomi NPP VIIRS and Aqua MODIS true-color images [click to enlarge]](https://cimss.ssec.wisc.edu/satellite-blog/wp-content/uploads/sites/5/2016/11/161107_modis_VIIRS_truecolor_Southeast_US_fires_anim.gif)
![GOES-13 Visible (0.63 µm) images; hourly surface weather symbols are plotted in yellow, with surface visibility (statute miles) plotted in cyan [click to play animation]](https://cimss.ssec.wisc.edu/satellite-blog/wp-content/uploads/sites/5/2016/11/161107_goes13_visible_surface_weather_visibility_Southeast_US_fires_anim.gif)
![GOES-13 Visible (0.63 µm) images; hourly surface weather symbols are plotted in yellow, with surface visibility (statute miles) plotted in cyan [click to play animation]](https://cimss.ssec.wisc.edu/satellite-blog/wp-content/uploads/sites/5/2016/11/161110_goes13_visible_surface_weather_visibility_Southeast_US_fires_anim.gif)
![GOES-13 Visible (0.63 µm) image, with cloud ceiling (hundreds of feet above ground level) and visibility (statute miles) plotted in cyan and a Pilot Report in yellow [click to enlarge]](https://cimss.ssec.wisc.edu/satellite-blog/wp-content/uploads/sites/5/2016/11/161110_1545utc_goes13_visible_pirep.png)
![Aqua MODIS true-color image [click to enlarge]](https://cimss.ssec.wisc.edu/satellite-blog/wp-content/uploads/sites/5/2016/11/AQUA_TrueColor_10Nov2016.1000m.png)
![Suomi NPP VIIRS true-color image (with fire detection locations in red) and Aerosol Optical Depth product [click to enlarge]](https://cimss.ssec.wisc.edu/satellite-blog/wp-content/uploads/sites/5/2016/11/161110_1858utc_suomi_npp_viirs_truecolor_fire_detections_aod_Southeast_US_fires_anim.gif)
