As a follow-up to the previous Otto blog post, GOES-13 Infrared Window (10.7 um) images (above) showed Otto around the time that it became the latest hurricane on record to form in the Caribbean Sea on 22 November 2016 (NHC advisory).A comparison of GOES-13 Visible (0.63 um) and Infrared Window (10.7 um) images... Read More
![GOES-13 Infrared Window (10.7 um) images [click to enlarge]](https://cimss.ssec.wisc.edu/satellite-blog/wp-content/uploads/sites/5/2016/11/161122_goes13_ir_Otto_anim.gif)
GOES-13 Infrared Window (10.7 um) images [click to enlarge]
As a follow-up to the previous
Otto blog post, GOES-13 Infrared Window (10.7 um) images
(above) showed Otto around the time that it became the latest hurricane on record to form in the Caribbean Sea on 22 November 2016 (
NHC advisory).
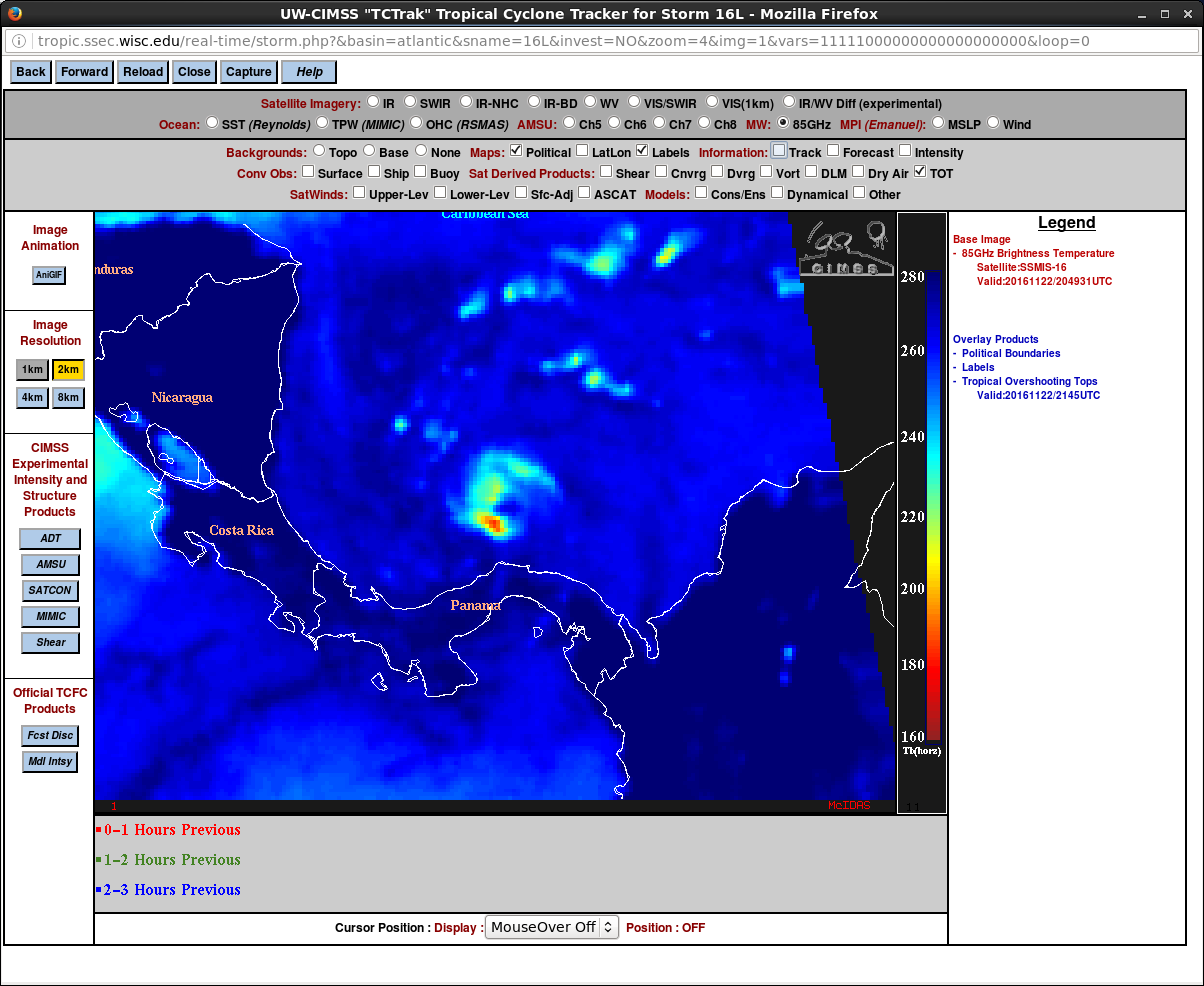
A comparison of GOES-13 Visible (0.63 um) and Infrared Window (10.7 um) images (below) revealed multiple convective bursts during the day, some of which exhibited IR brightness temperatures of -80º C and colder (violet enhancement). Because of Otto’s central dense overcast, no eye was apparent in the GOES-13 imagery; even on a DMSP-16 SSMIS Microwave (85 GHz) image at 2049 UTC the eyewall was not fully closed.
![GOES-13 0.63 um Visible (top) and 10.7 um Infrared Window (bottom) images [click to animate]](https://cimss.ssec.wisc.edu/satellite-blog/wp-content/uploads/sites/5/2016/11/480x1280_EASTL_B14_GOES13_VIS_IR_OTTO_22SEP2016_2016327_124500_0002PANELS.GIF)
GOES-13 0.63 um Visible (top) and 10.7 um Infrared Window (bottom) images [click to animate]
===== 24 November Update =====
![GOES-13 Infrared Window (10.7 µm) images, with hourly surface reports [click to play MP4 animation]](https://cimss.ssec.wisc.edu/satellite-blog/wp-content/uploads/sites/5/2016/11/960x1280_EASTL_B4_GOES13_IR_OTTO_23-24OCT2016_2016329_170000_0001PANEL.GIF)
GOES-13 Infrared Window (10.7 µm) images, with hourly surface reports [click to play MP4 animation]
As Otto slowly approached the coast of southern Nicaragua on 24 November, it rapidly intensified (
SATCON plot) to a Category 2 hurricane. GOES-13 Infrared Window (10.7 µm) images
(above; also available as a 36 Mbyte animated GIF) and Visible (0.63 µm) images
(below; also available as a 18 Mbyte animated GIF) showed the development of an eye just offshore, which rapidly filled as the storm moved inland after 17 UTC on 24 November and began to interact with the terrain. After crossing Nicaragua and Costa Rica, an eye was once again discernible around 02 UTC on 15 November (as Otto emerged over the Pacific Ocean).
![GOES-13 Visible (0.63 µm) images, with hourly surface reports [click to play MP4 animation]](https://cimss.ssec.wisc.edu/satellite-blog/wp-content/uploads/sites/5/2016/11/960x1280_EASTL_B1_GOES13_VIS_OTTO_24OCT2016_2016329_170000_0001PANEL.GIF)
GOES-13 Visible (0.63 µm) images, with hourly surface reports [click to play MP4 animation]
Before the formation of an eye, a Suomi NPP VIIRS Infrared Window (11.45 µm) image at 0639 UTC
(below; courtesy of William Straka, SSEC) showed the presence of cloud-top gravity waves propagating westward along the Nicaragua/Costa Rica border; these waves were likely a response to deep convective bursts offshore near the center of Otto.
![Suomi NPP VIIRS Infrared Window (11.45 µm) image [click to enlarge]](https://cimss.ssec.wisc.edu/satellite-blog/wp-content/uploads/sites/5/2016/11/161124_0639utc_viirs_infrared_Otto.png)
Suomi NPP VIIRS Infrared Window (11.45 µm) image [click to enlarge]
A comparison of DMSP-17 SSMIS Microwave (85 GHz) and GOES-13 Infrared Window (10.7 µm) images around 1115 UTC on 24 November
(below) revealed a much larger (albeit not completely closed) eye signature using the microwave data.
![DMSP-17 SSMIS Microwave (85 GHz) and GOES-13 Infrared Window (10.7 µm) images around 1145 UTC [click to enlarge]](https://cimss.ssec.wisc.edu/satellite-blog/wp-content/uploads/sites/5/2016/11/161124_1145utc_goes13_ir_1143utc_dmsp17_ssmis_microwave_Otto_anim.gif)
DMSP-17 SSMIS Microwave (85 GHz) and GOES-13 Infrared Window (10.7 µm) images around 1145 UTC [click to enlarge]
Otto became the southernmost landfalling hurricane on record for Central America. It was also the strongest hurricane on record for so late in the season within the Atlantic basin.
![DMSP-18 SSMIS Microwave (85 GHz) image [click to enlarge]](https://cimss.ssec.wisc.edu/satellite-blog/wp-content/uploads/sites/5/2016/11/161125_0043utc_dmsp18_ssmis_microwave_Otto.jpg)
DMSP-18 SSMIS Microwave (85 GHz) image [click to enlarge]
A DMSP-18 SSMIS Microwave (85 GHz) image at 0043 UTC on 25 November
(above) showed that the eye of Otto was still well-defined as it began to move into northern Costa Rica (making this the first hurricane or tropical storm on record for that country). The eye structure could be tracked on
MIMIC-TC imagery
(below) as it moved inland from the Atlantic Ocean, across far southern Nicaragua and far northern Costa Rica, and eventually emerged over the Pacific Ocean after about 03 UTC on 25 November.
![Morphed MIMIC-TC imagery, 24-25 November [click to enlarge]](https://cimss.ssec.wisc.edu/satellite-blog/wp-content/uploads/sites/5/2016/11/161124-25_mimic_tc_Otto_anim.gif)
Morphed MIMIC-TC imagery, 24-25 November [click to enlarge]
===== 26 November Update =====
![Suomi NPP VIIRS Infrared Window (11.45 µm) and Day/Night Band (0.7 µm) images [click to enlarge]](https://cimss.ssec.wisc.edu/satellite-blog/wp-content/uploads/sites/5/2016/11/161126_0744uc_suomi_npp_viirs_Infrared_DayNightBand_TS_Otto_anim.gif)
Suomi NPP VIIRS Infrared Window (11.45 µm) and Day/Night Band (0.7 µm) images [click to enlarge]
As Tropical Storm Otto was weakening during its west-southwestward motion over Pacific Ocean waters with low
Ocean Heat Content, nighttime images of Suomi NPP VIIRS Infrared Window (11.45 µm) and Day/Night Band (0.7 µm) data at 0744 UTC on 26 November
(above; courtesy of William Straka, SSEC) displayed shorter-wavelength cloud-top gravity waves on the Infrared image and longer-wavelength mesospheric airglow waves (
reference) on the Day/Night Band image (all of which were propagating west-southwestward away from the deep convective cluster near the center of Otto). Bright lightning streaks were also seen on the Day/Night Band image.
More facts on the historic aspects of Otto are available from The Weather Channel and Weather Underground; see the National Hurricane Center and the CIMSS Tropical Cyclones websites for the latest information on this storm.
View only this post
Read Less
![GOES-13 Shortwave Infrared (3.9 µm) images, with METAR surface reports [click to play animation]](https://cimss.ssec.wisc.edu/satellite-blog/wp-content/uploads/sites/5/2016/11/161128_goes13_shortwave_infrared_Gatlinburg_TN_wildfire_anim.gif)
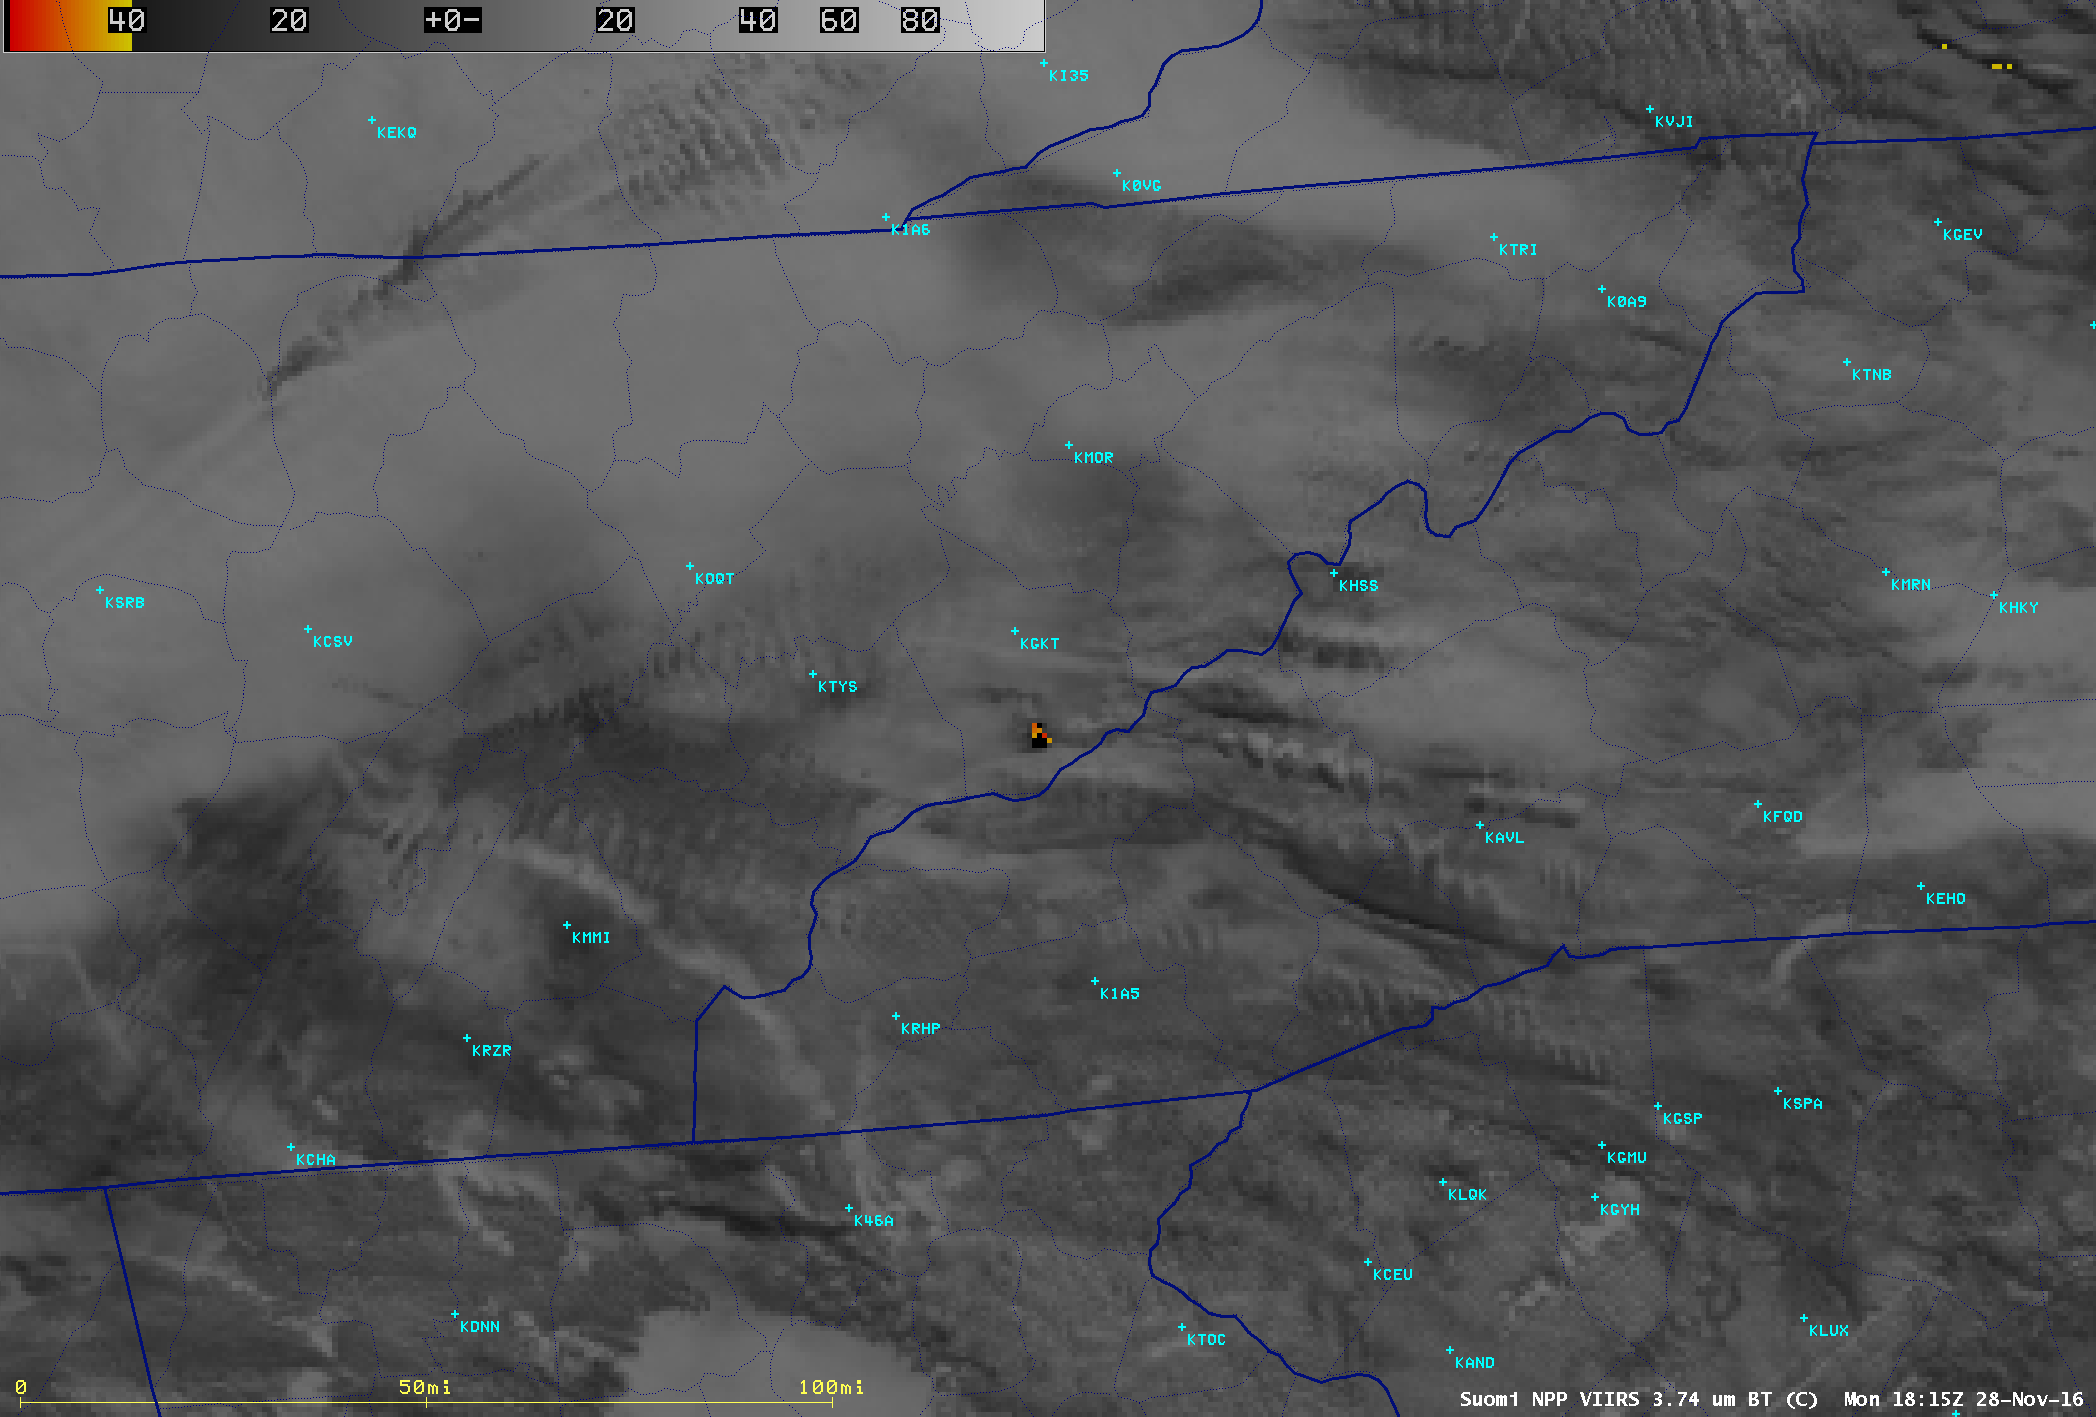
![Suomi NPP VIIRS Shortwave Infrared (3.74 µm) image [click to enlarge]](https://cimss.ssec.wisc.edu/satellite-blog/wp-content/uploads/sites/5/2016/11/viirs_swir-20161128_181541.png)
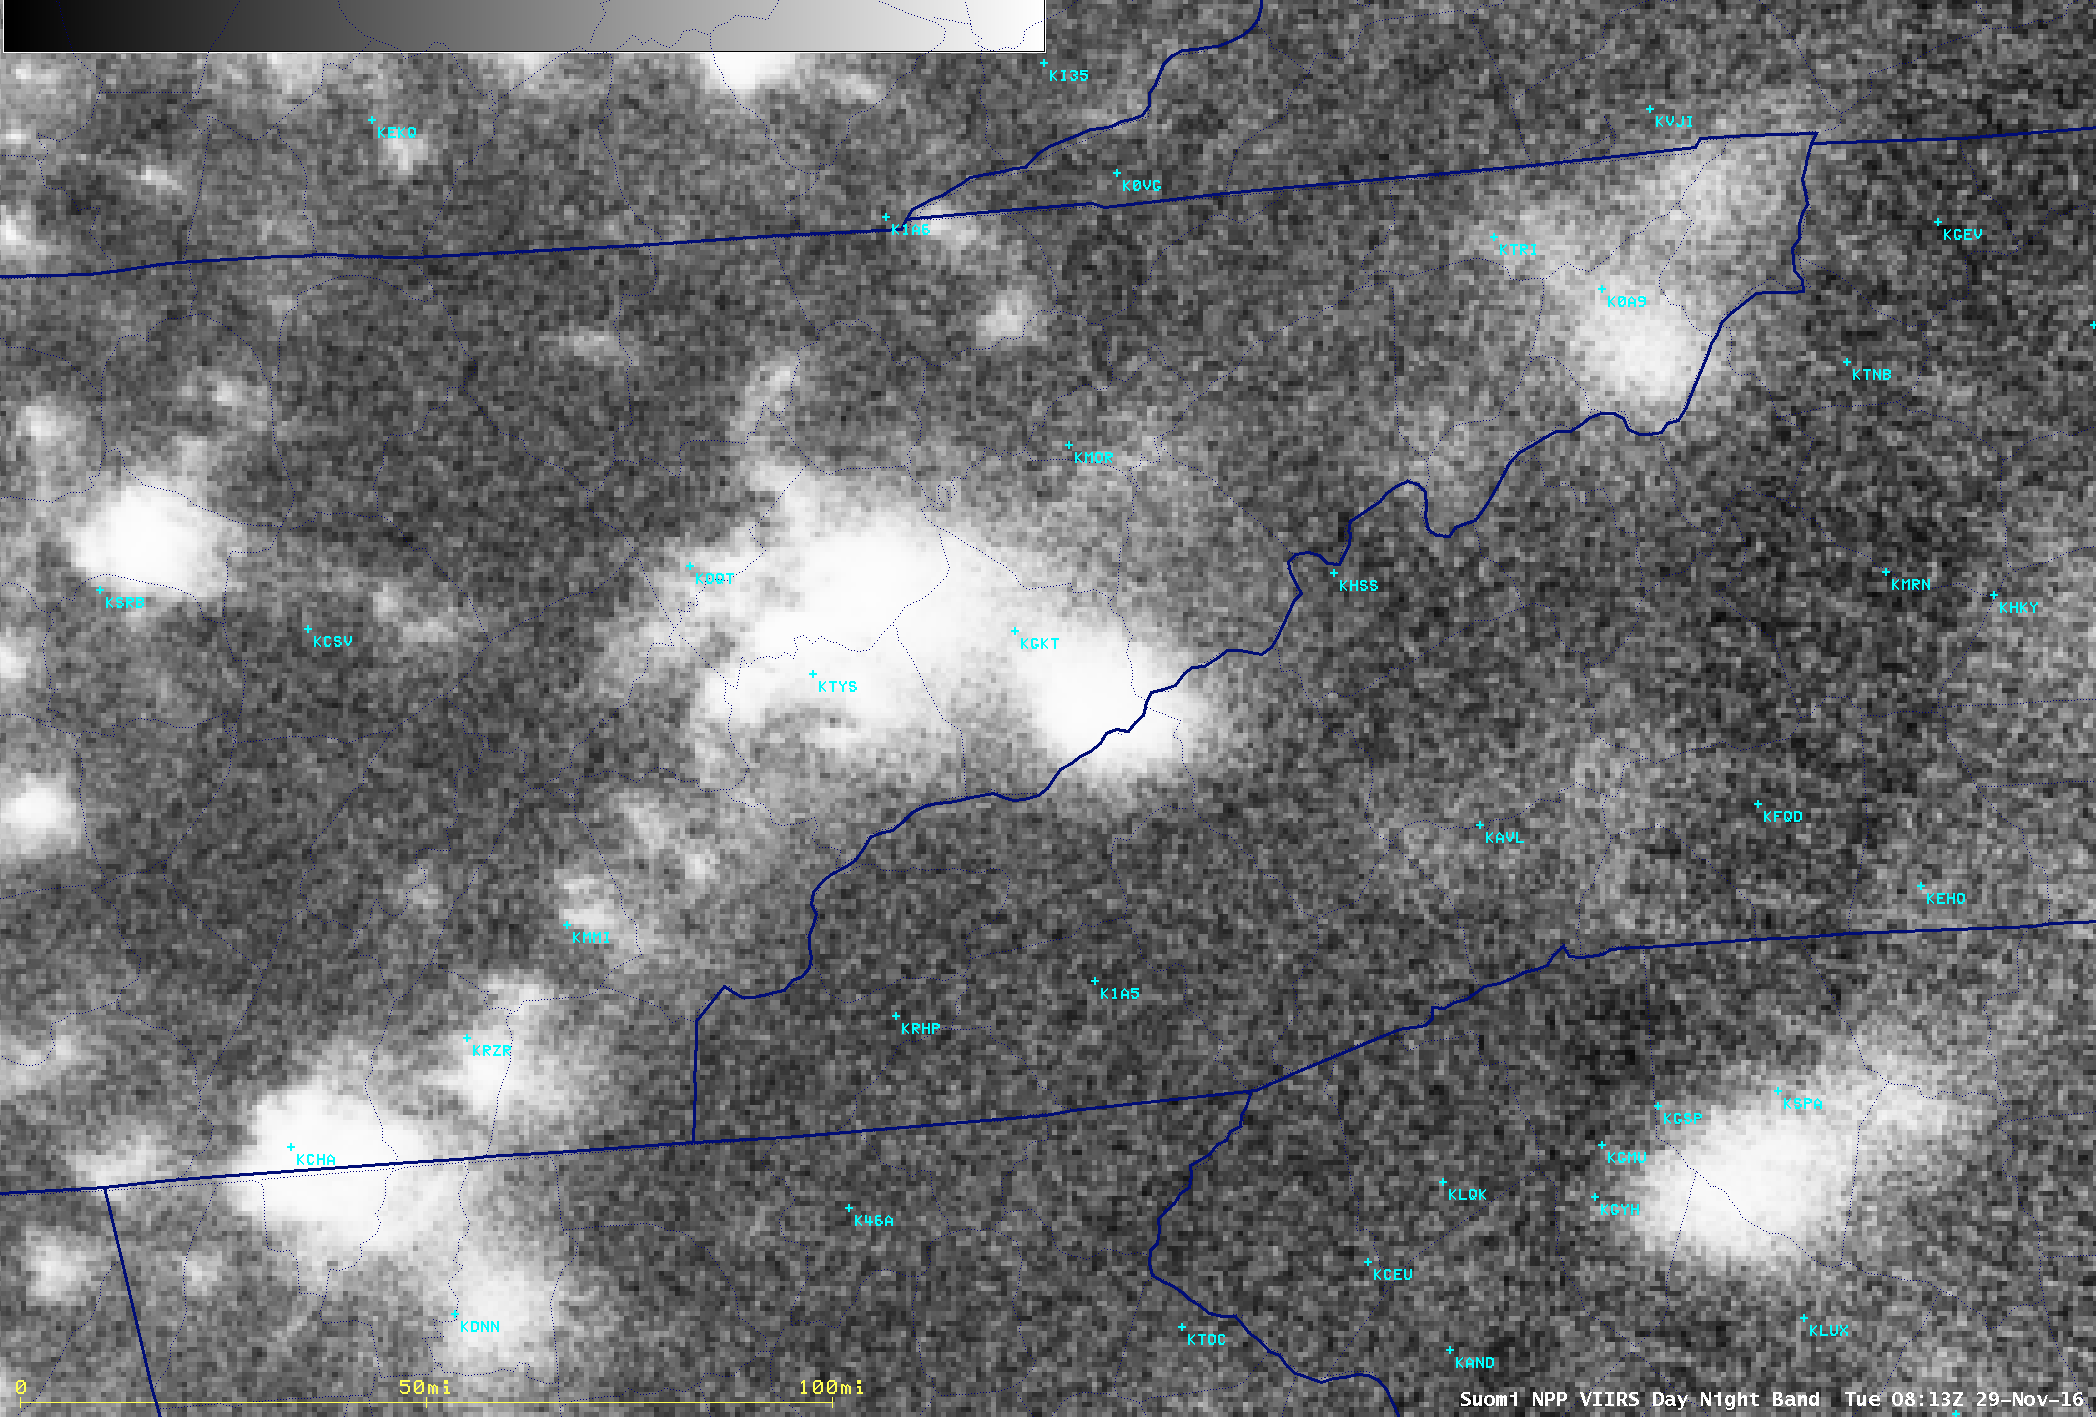
![Suomi NPP VIIRS Infrared Window (11.45 µm), Shortwave Infrared (3.74 µm) and Day/Night Band (0.7 µm) images [click to enlarge]](https://cimss.ssec.wisc.edu/satellite-blog/wp-content/uploads/sites/5/2016/11/161129_0816utc_suomi_npp_viirs_Infrared_ShortwaveInfrared_DayNightBand_Gatlinburg_TN_wildfires_anim.gif)
![GOES-13 0.63 um Visible (top) and 10.7 um Infrared Window (bottom) images [click to animate]](https://cimss.ssec.wisc.edu/satellite-blog/wp-content/uploads/sites/5/2016/11/161122_goes13_visible_infrared_Hurricane_Otto_anim.gif)
![GOES-13 Visible (0.63 µm) images, with hourly surface/buoy/ship reports [click to play animation]](https://cimss.ssec.wisc.edu/satellite-blog/wp-content/uploads/sites/5/2016/11/161122_goes13_visible_Gulf_of_Mexico_anim.gif)
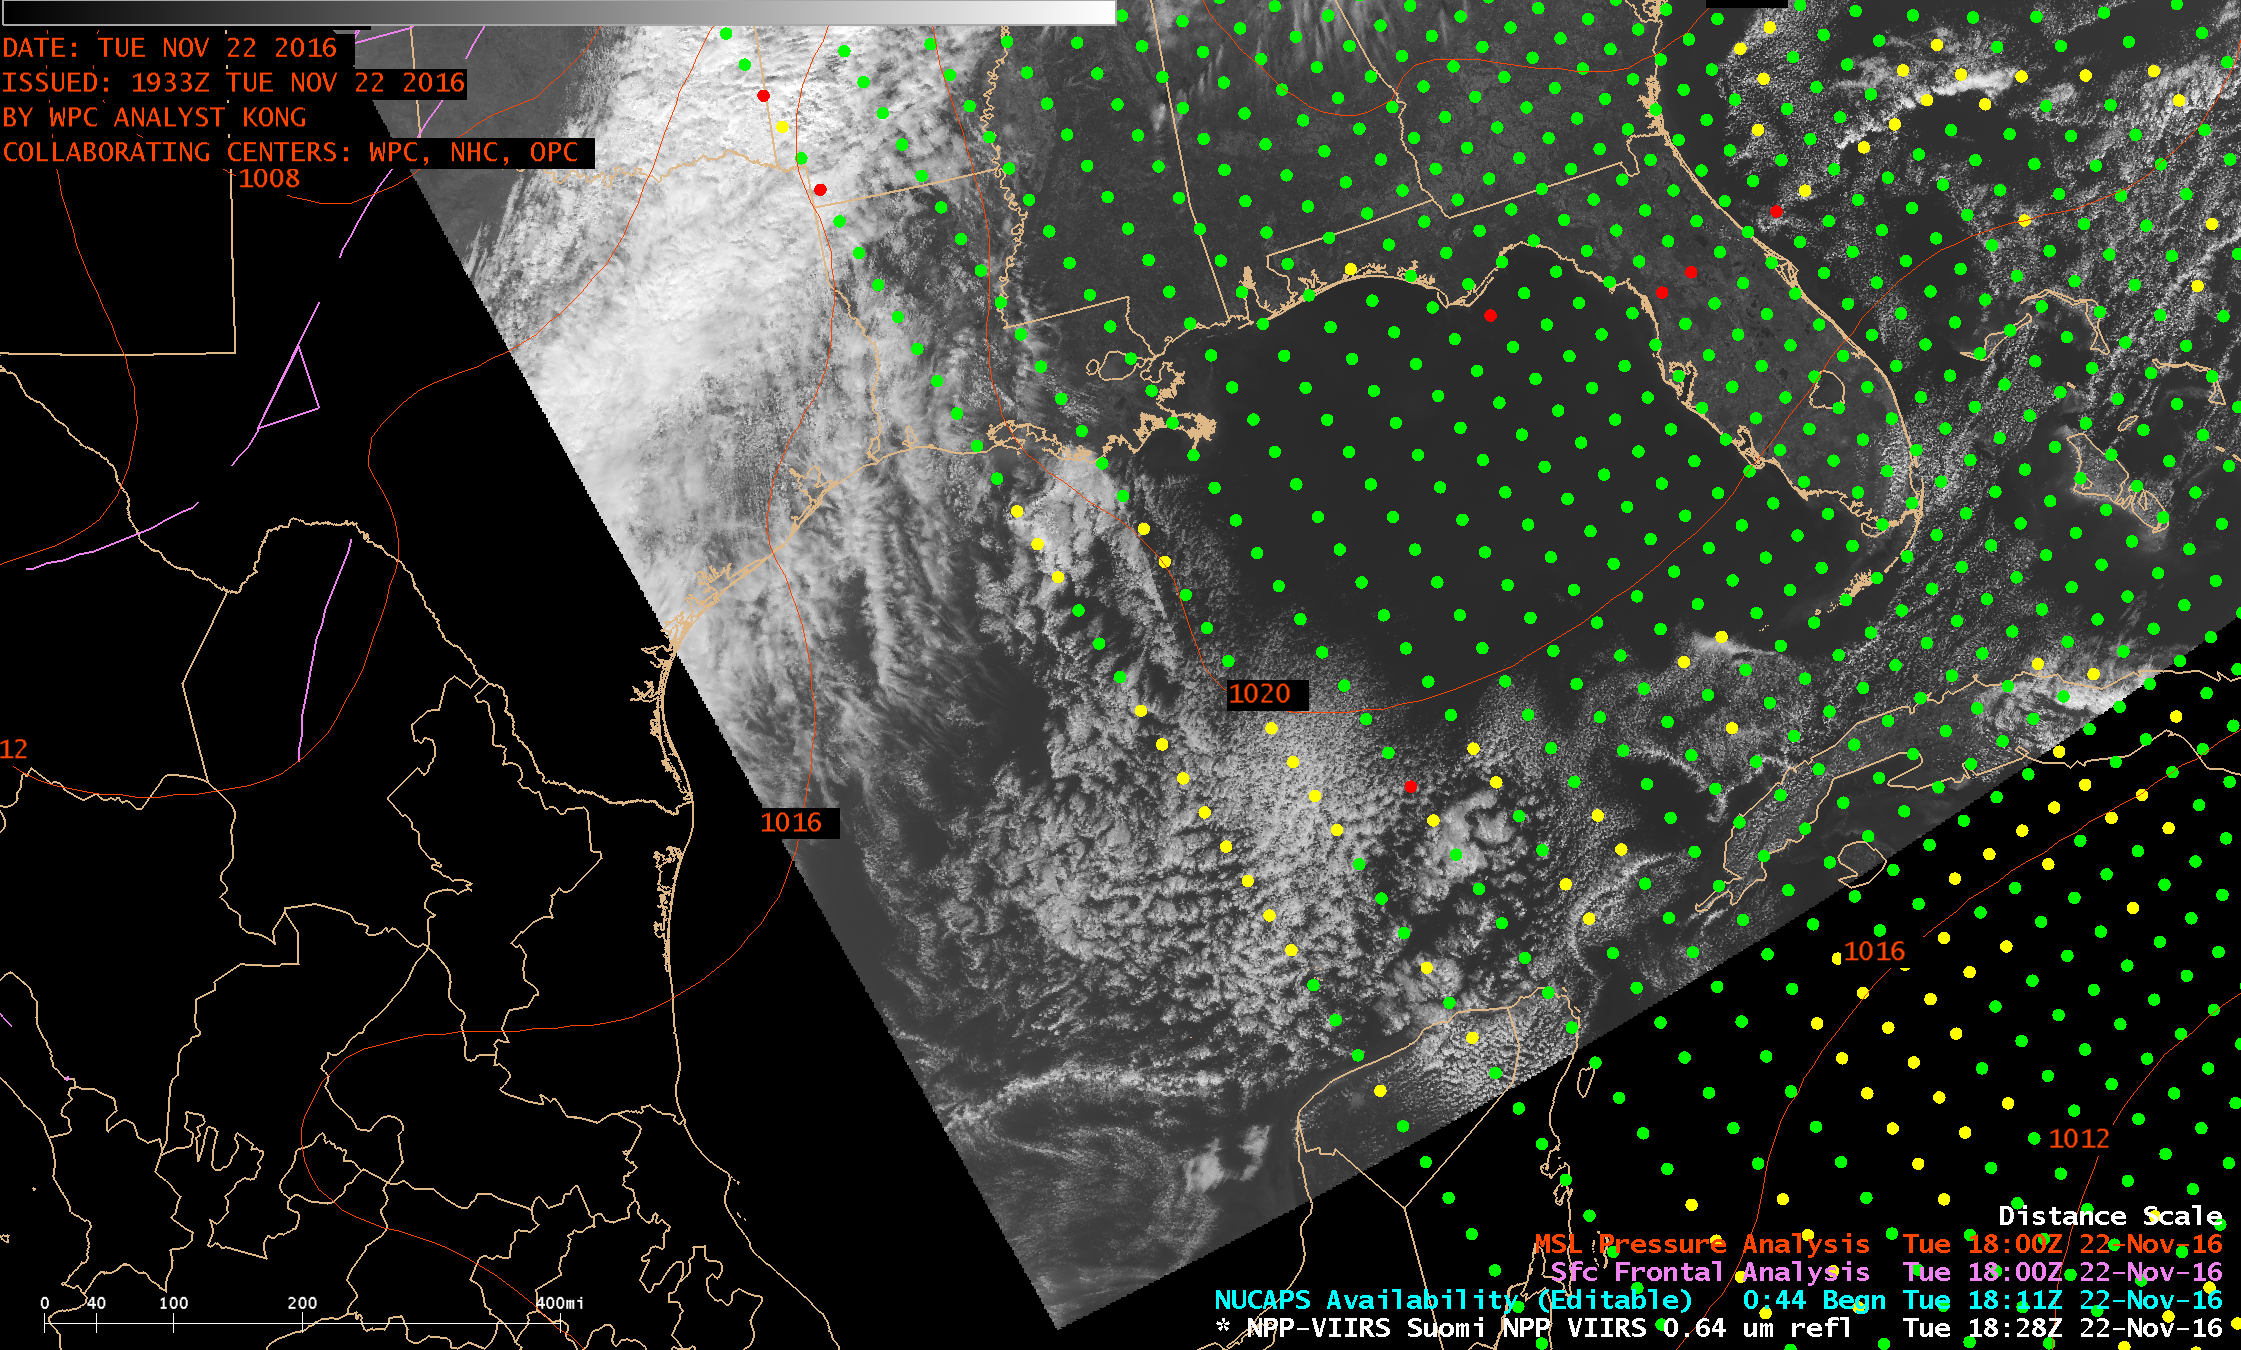
![Suomi NPP VIIRS Visible (0.64 µm) image, with NUCAPS sounding locations and surface analysis [click to enlarge]](https://cimss.ssec.wisc.edu/satellite-blog/wp-content/uploads/sites/5/2016/11/viirs_visible_nucaps-20161122_182813_a.png)
![NUCAPS sounding profile for a point over the Gulf of Mexico, north of the Yucatan Peninsula [click to enlarge]](https://cimss.ssec.wisc.edu/satellite-blog/wp-content/uploads/sites/5/2016/11/nucaps_sounding_GOM-20161122_182912.png)
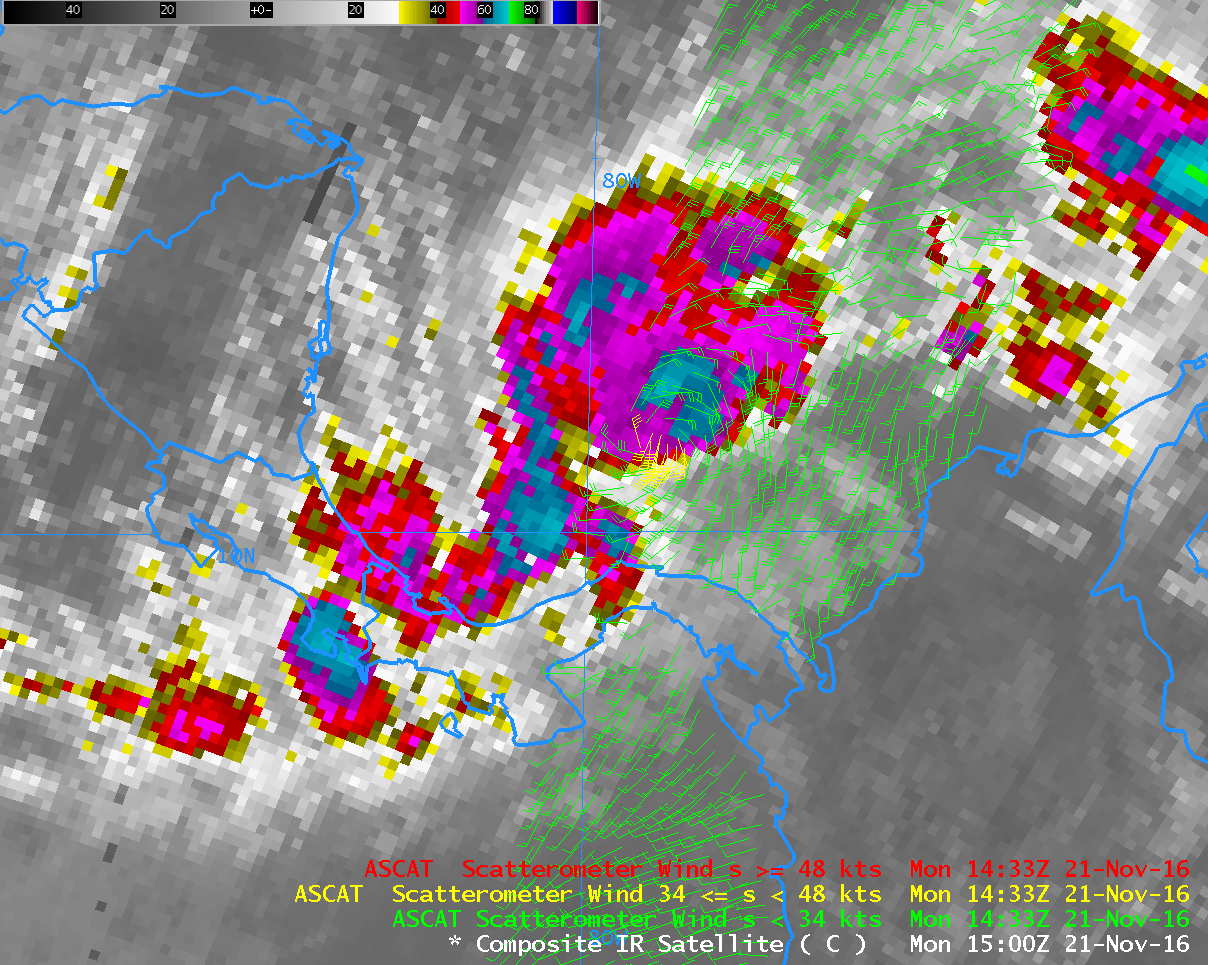

![DMSP-16 SSMIS Microwave (85 GHz) image [click to enlarge]](https://cimss.ssec.wisc.edu/satellite-blog/wp-content/uploads/sites/5/2016/11/161121_2132utc_dmsp16_ssmis_TS_Otto.png)
