Himawari-8 Water Vapor (6.2 µm) images (above; also available as MP4 and McIDAS-V animations) revealed the presence of a subtle packet of upper-tropospheric gravity waves propagating southeastward near the International Date Line (180º longitude over the central Pacific Ocean), just to the west/southwest of Midway Atoll on 14 December 2016 —... Read More
![Himawari-8 Water Vapor (6.2 µm) images, with pilot reports of turbulence [click to play animation]](https://cimss.ssec.wisc.edu/satellite-blog/wp-content/uploads/sites/5/2016/12/161214_1730utc_himawari8_water_vapor_pireps_annotations.gif)
Himawari-8 Water Vapor (6.2 µm) images, with pilot reports of turbulence [click to play animation]
Himawari-8 Water Vapor (6.2 µm) images
(above; also available as MP4 and McIDAS-V animations) revealed the presence of a subtle packet of upper-tropospheric gravity waves propagating southeastward near the International Date Line (180º longitude over the central Pacific Ocean), just to the west/southwest of
Midway Atoll on 14 December 2016 — and there were a few pilot reports of moderate to severe turbulence (which were responsible for at least one injury) in the general vicinity of this gravity wave feature from 1530 to 1740 UTC, at altitudes of 35,000 to 38,000 feet:
PHNL UUA /OV 2800N 18000W/TM 1530/FL380/TP B767/TB MOD-SEV/RM ZOA CWSU
PHNL UUA /OV 2643N 17757W/TM 1732/FL350/TP A330/TB SEV/RM ZOA CWSU
PHNL UUA /OV 2626N 17917W/TM 1740/FL360/TP B747/TB SEV/RM ZOA CWSU
A larger-scale view using all 3 water vapor bands of the AHI instrument on the Himawari-8/9 satellites (below; also available as an MP4 animation) showed that a broad trough was moving eastward away from the International Date Line, with the signature of a jet streak diving southward toward the region of the turbulence reports (Note: the ABI instrument on the GOES-R series of satellites will feature these same 3 upper level, mid-level and lower level water vapor bands).
![Himawari-8 Water Vapor (6.2 µm, top; 6.9 µm, middle; 7.4 µm, bottom) images [click to play animation]](https://cimss.ssec.wisc.edu/satellite-blog/wp-content/uploads/sites/5/2016/12/320x1280_AHIM08_B8910_HIM08_WV_3PANEL_DATELINE_TB_14DEC2016_2016349_163000_0003PANELS.GIF)
Himawari-8 Water Vapor (6.2 µm, top; 6.9 µm, middle; 7.4 µm, bottom) images [click to play animation]
GFS model 250 hPa analyses (
12 UTC |
18 UTC |
source) confirmed that the region of turbulence reports was located within the exit region an approaching 50-70 m/s or 97-136 knot upper tropospheric jet, where convergence
(red contours) was maximized.
——————————————————————————–Similarly, Himawari-8 water vapor image
Derived Motion Winds, below, also indicated increasing upper-tropospheric convergence along the International Date Line (180º longitude) between 25º and 30º N latitude from 12 UTC to 18 UTC
(below; source).
![Himawari-8 water vapor image Derived Motion Winds at 12 UTC, with corresponding contours of Upper-tropospheric divvergence [click to enlarge]](https://cimss.ssec.wisc.edu/satellite-blog/wp-content/uploads/sites/5/2016/12/161214_12utc_water_vapor_winds_upper_divergence_anim.gif)
Himawari-8 water vapor image Derived Motion Winds at 12 UTC, with corresponding contours of Upper-tropospheric divvergence [click to enlarge]
![Himawari-8 water vapor image Derived Motion Winds at 15 UTC, with corresponding contours of Upper-tropospheric divergence [click to enlarge]](https://cimss.ssec.wisc.edu/satellite-blog/wp-content/uploads/sites/5/2016/12/161214_15utc_water_vapor_winds_upper_divergence_anim.gif)
Himawari-8 water vapor image Derived Motion Winds at 15 UTC, with corresponding contours of Upper-tropospheric divergence [click to enlarge]
![Himawari-8 water vapor image Derived Motion Winds at 18 UTC, with corresponding contours of Upper-tropospheric divergence [click to enlarge]](https://cimss.ssec.wisc.edu/satellite-blog/wp-content/uploads/sites/5/2016/12/161214_18utc_water_vapor_winds_upper_divergence_anim.gif)
Himawari-8 water vapor image Derived Motion Winds at 18 UTC, with corresponding contours of Upper-tropospheric divergence [click to enlarge]
A comparison of 2-km resolution Himawari-8 and 4-km resolution GOES-15 Water Vapor images
(below; also available as an MP4 animation) showed that the gravity wave feature was not readily apparent on the lower spatial resolution GOES-15 images (which were only available every 30 minutes, in contrast to every 10 minutes from Himawari-8). The same color enhancement is applied to both sets of images — but because of differences between the Himawari-8 vs GOES-15 water vapor band characteristics (namely the central wavelength and the spectral response function, but also the water vapor weighting function profiles as influenced by the dissimilar satellite viewing angles) the resulting water vapor images differ in their general appearance.
![Himawari-8 Water Vapor (6.2 µm, left) and GOES-15 Water Vapor (6.5 µm, right) images, with pilot reports of turbulence [click to play animation]](https://cimss.ssec.wisc.edu/satellite-blog/wp-content/uploads/sites/5/2016/12/161214_HIM8_G15_WV_DATELINE_TB_16.GIF)
Himawari-8 Water Vapor (6.2 µm, left) and GOES-15 Water Vapor (6.5 µm, right) images, with pilot reports of turbulence [click to play animation]
This case demonstrated well the importance of viewing all 11 bits of information contained in the Himawari-8 Imagery. The
animation at the top of the Blog Post shows an 8-bit display; a similar 8-bit display that uses a different color enhancement is
here, courtesy of Dan Lindsey at CIRA. All 8-bit displays are limited to 256 different colors. The image below compares 8-bit (McIDAS-X on the left) and 11-bit (McIDAS-V on the right) displays at 1530 UTC.
![Himawari-8 Water Vapor (6.2 µm) image at 1530 UTC, as viewed using 8-bit McIDAS-X (left) and 11-bit McIDAS-V (right) displays [click to enlarge]](https://cimss.ssec.wisc.edu/satellite-blog/wp-content/uploads/sites/5/2016/12/161214_1530utc_himawari8_water_vapor_band8_McX_8bit_McV_11bit.jpg)
Himawari-8 Water Vapor (6.2 µm) image at 1530 UTC, as viewed using 8-bit McIDAS-X (left) and 11-bit McIDAS-V (right) displays [click to enlarge]
that compares 11-bit and 8-bit displays. The feature causing the turbulence is quite subtle, and 11-bit displays (which allow 2048 different colors) are necessary to accurately show it.
View only this post
Read Less
![Himawari-8 Water Vapor (6.2 µm) images, with pilot reports of turbulence [click to play animation]](https://cimss.ssec.wisc.edu/satellite-blog/wp-content/uploads/sites/5/2016/12/161214_himawari8_water_vapor_band_8_Dateline_TB_pireps_anim.gif)
![Himawari-8 Water Vapor (6.2 µm, top; 6.9 µm, middle; 7.4 µm, bottom) images [click to play animation]](https://cimss.ssec.wisc.edu/satellite-blog/wp-content/uploads/sites/5/2016/12/161214_himawari8_water_vapor_Dateline_TB_anim.gif)
![Himawari-8 Water Vapor (6.2 µm, left) and GOES-15 Water Vapor (6.5 µm, right) images, with pilot reports of turbulence [click to play animation]](https://cimss.ssec.wisc.edu/satellite-blog/wp-content/uploads/sites/5/2016/12/161214_himawari8_goes15_water_vapor_Dateline_Turbulence_anim.gif)
![GOES-13 Water Vapor (6.5 µm) images, with hourly surface weather symbols [click to play animation]](https://cimss.ssec.wisc.edu/satellite-blog/wp-content/uploads/sites/5/2016/12/161205-08_goes13_water_vapor_ND_blizzard_wxs_anim.gif)
![GOES-13 Water Vapor (6.5 µm) images, with hourly surface winds (yellow) and wind gusts in knots (red) [click to play animation]](https://cimss.ssec.wisc.edu/satellite-blog/wp-content/uploads/sites/5/2016/12/161205-08_goes13_water_vapor_ND_blizzard_anim.gif)
![Aqua MODIS true-color and false-color RGB images [click to enlarge]](https://cimss.ssec.wisc.edu/satellite-blog/wp-content/uploads/sites/5/2016/12/161209_aqua_modis_truecolor_falsecolor_ND_les_anim.gif)
![Aqua MODIS Land Surface Temperature product [click to enlarge]](https://cimss.ssec.wisc.edu/satellite-blog/wp-content/uploads/sites/5/2016/12/MODIS_LST_20161210_0939.png)
")
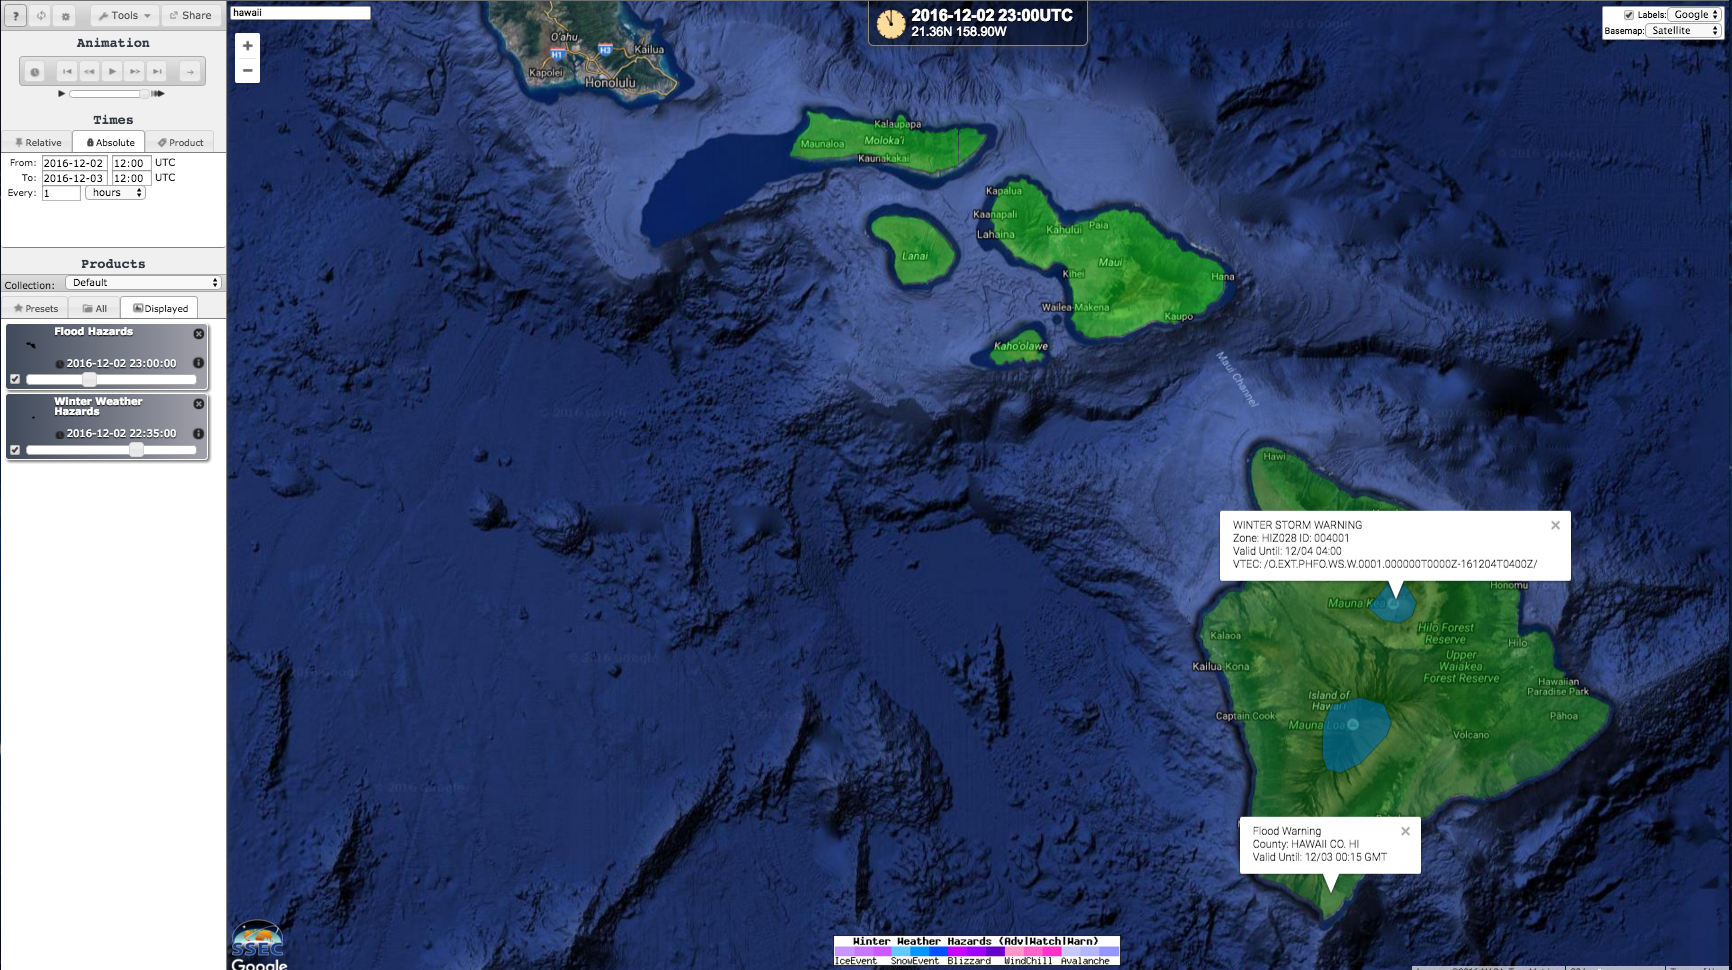
![GOES-15 Water Vapor (6.5 µm) images, with overlays of GFS model 500 hPa geopotential height [click to play animation]](https://cimss.ssec.wisc.edu/satellite-blog/wp-content/uploads/sites/5/2016/12/161201-03_goes15_water_vapor_gfs_500_heights_HI_anim.gif)
![GOES-15 Water Vapor (6.5 µm) images, with hourly surface reports [click to play MP4 animation]](https://cimss.ssec.wisc.edu/satellite-blog/wp-content/uploads/sites/5/2016/12/960x1280_WESTL_B3_GOES15_WV_HI_01-02DEC2016_2016337_234500_0001PANEL.GIF)
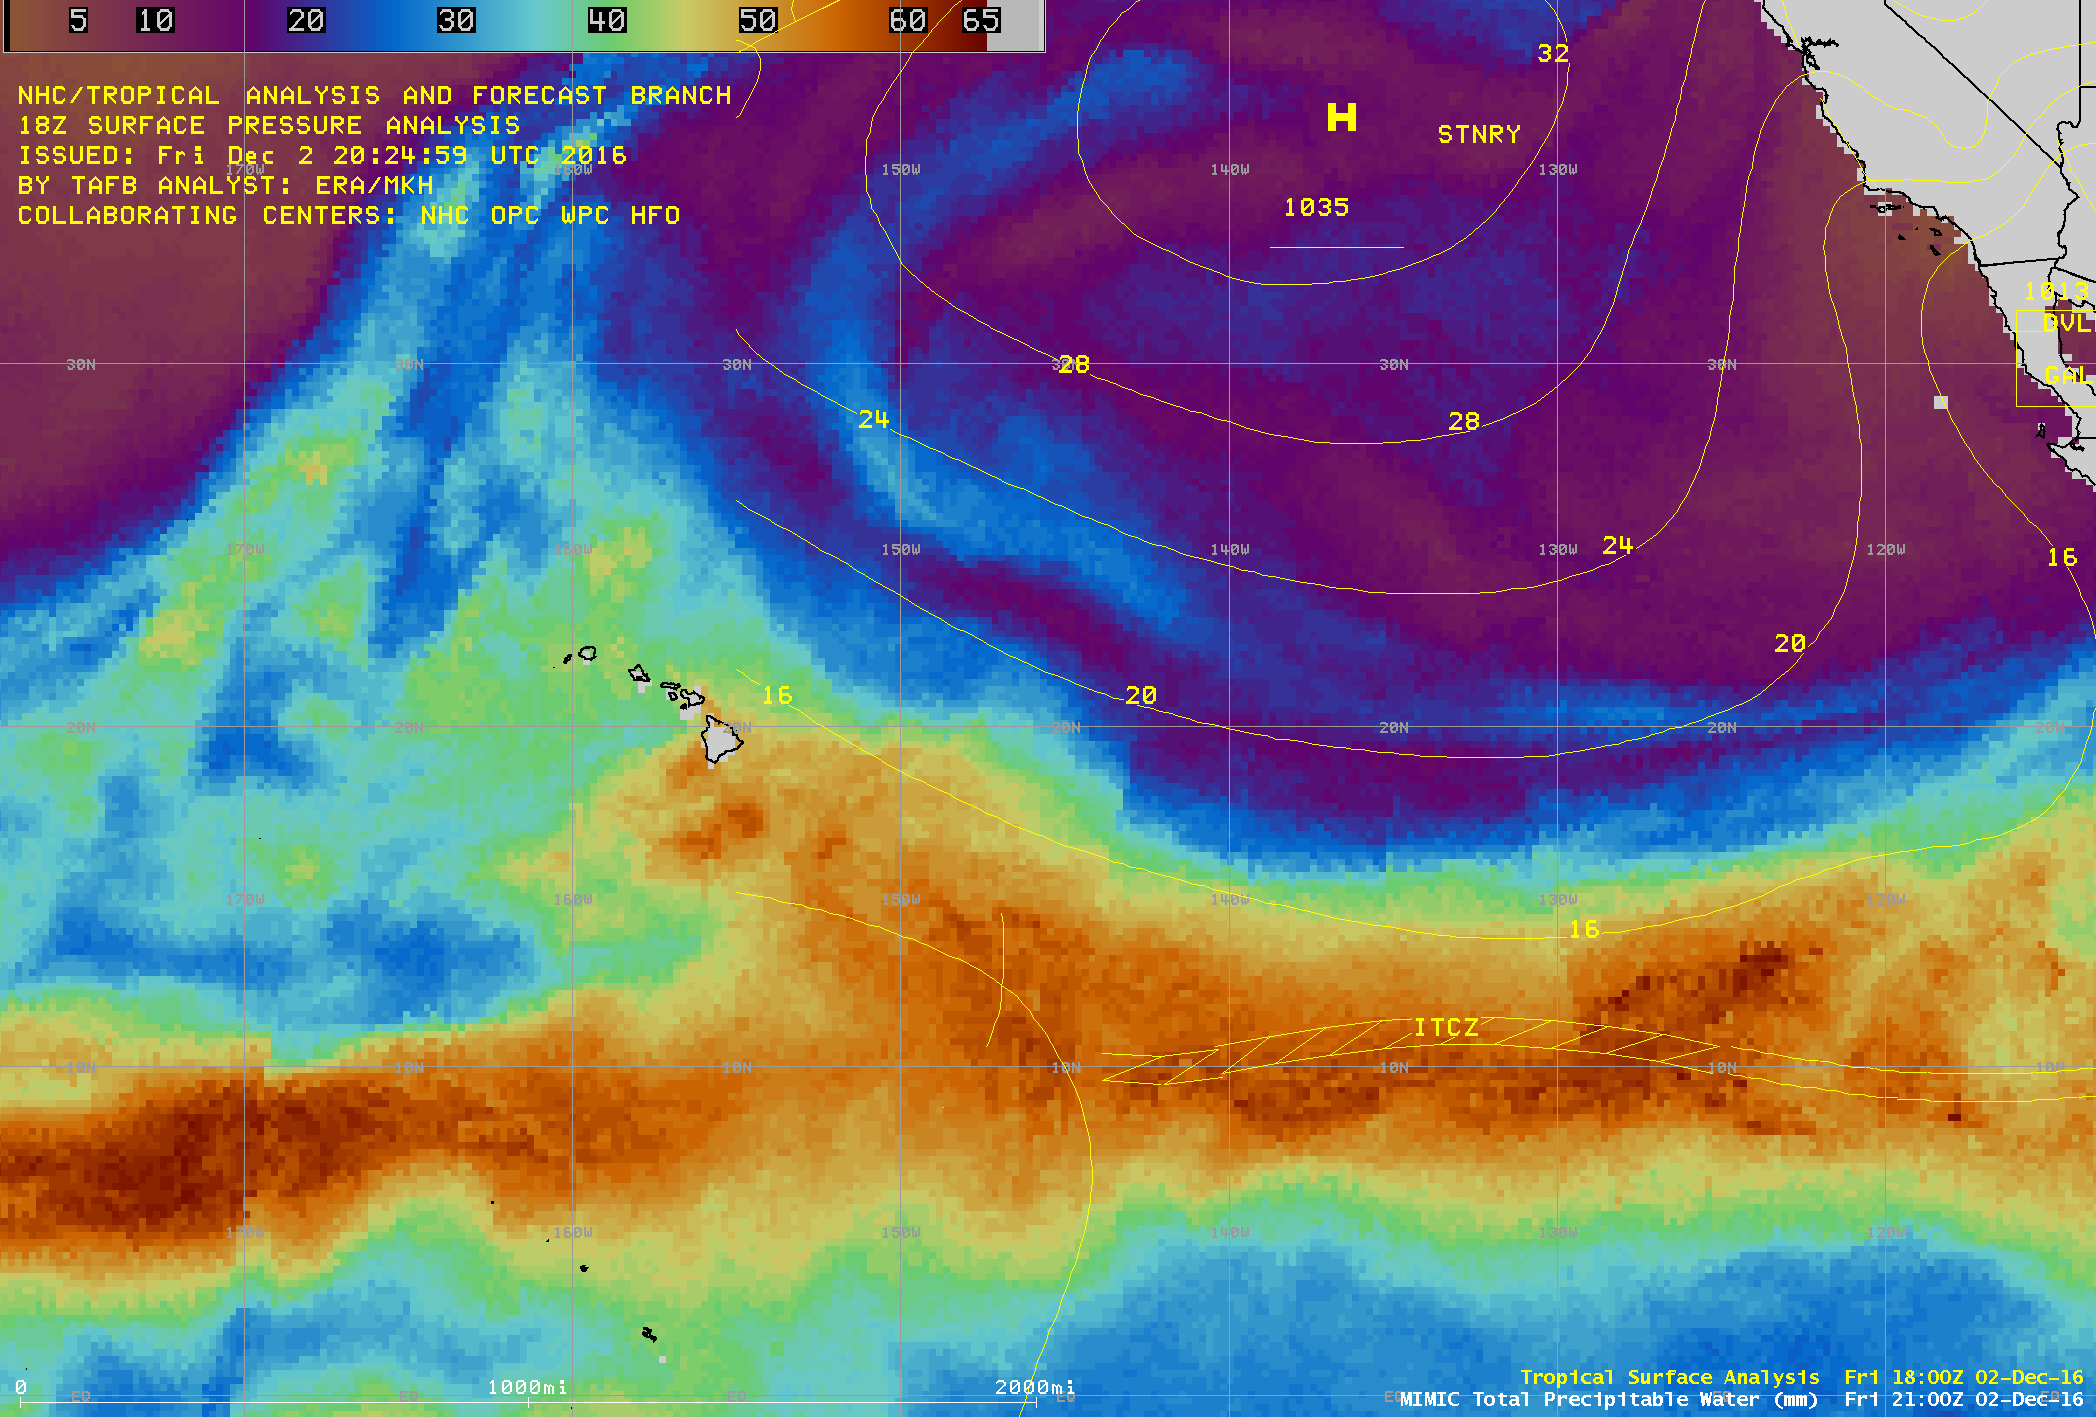
![MIMIC Total Precipitable Water product, with tropical surface analyses [click to play animation]](https://cimss.ssec.wisc.edu/satellite-blog/wp-content/uploads/sites/5/2016/12/161201-02_mimic_tpw_HI_anim.gif)
![GOES-15 Visible (0.63 µm) images, with hourly surface reports [click to play animation]](https://cimss.ssec.wisc.edu/satellite-blog/wp-content/uploads/sites/5/2016/12/161203_goes15_visible_Mauna_Kea_Mauna_Loa_snow_anim.gif)
