* GOES-16 data posted on this page are preliminary, non-operational and are undergoing testing *As seen on the map of SPC storm reports from 21 June 2017 (above), nighttime thunderstorms (during the pre-dawn hours of 22 June) produced a swath of hail (as large as 2.0 inches in diameter) that damaged emerging crops at... Read More
![SPC storm report plots, from 12 UTC on 21 June to 12 UTC on 22 June 2017 [click to go to SPC storm reports list]](http://www.spc.noaa.gov/climo/reports/170621_rpts.gif)
SPC storm report plots, from 12 UTC on 21 June to 12 UTC on 22 June 2017 [click to go to SPC storm reports list]
As seen on the map of SPC storm reports from 21 June 2017 (above), nighttime thunderstorms (during the pre-dawn hours of 22 June) produced a swath of hail (as large as 2.0 inches in diameter) that damaged emerging crops at some locations across eastern South Dakota and southwestern Minnesota (NWS Aberdeen summary).
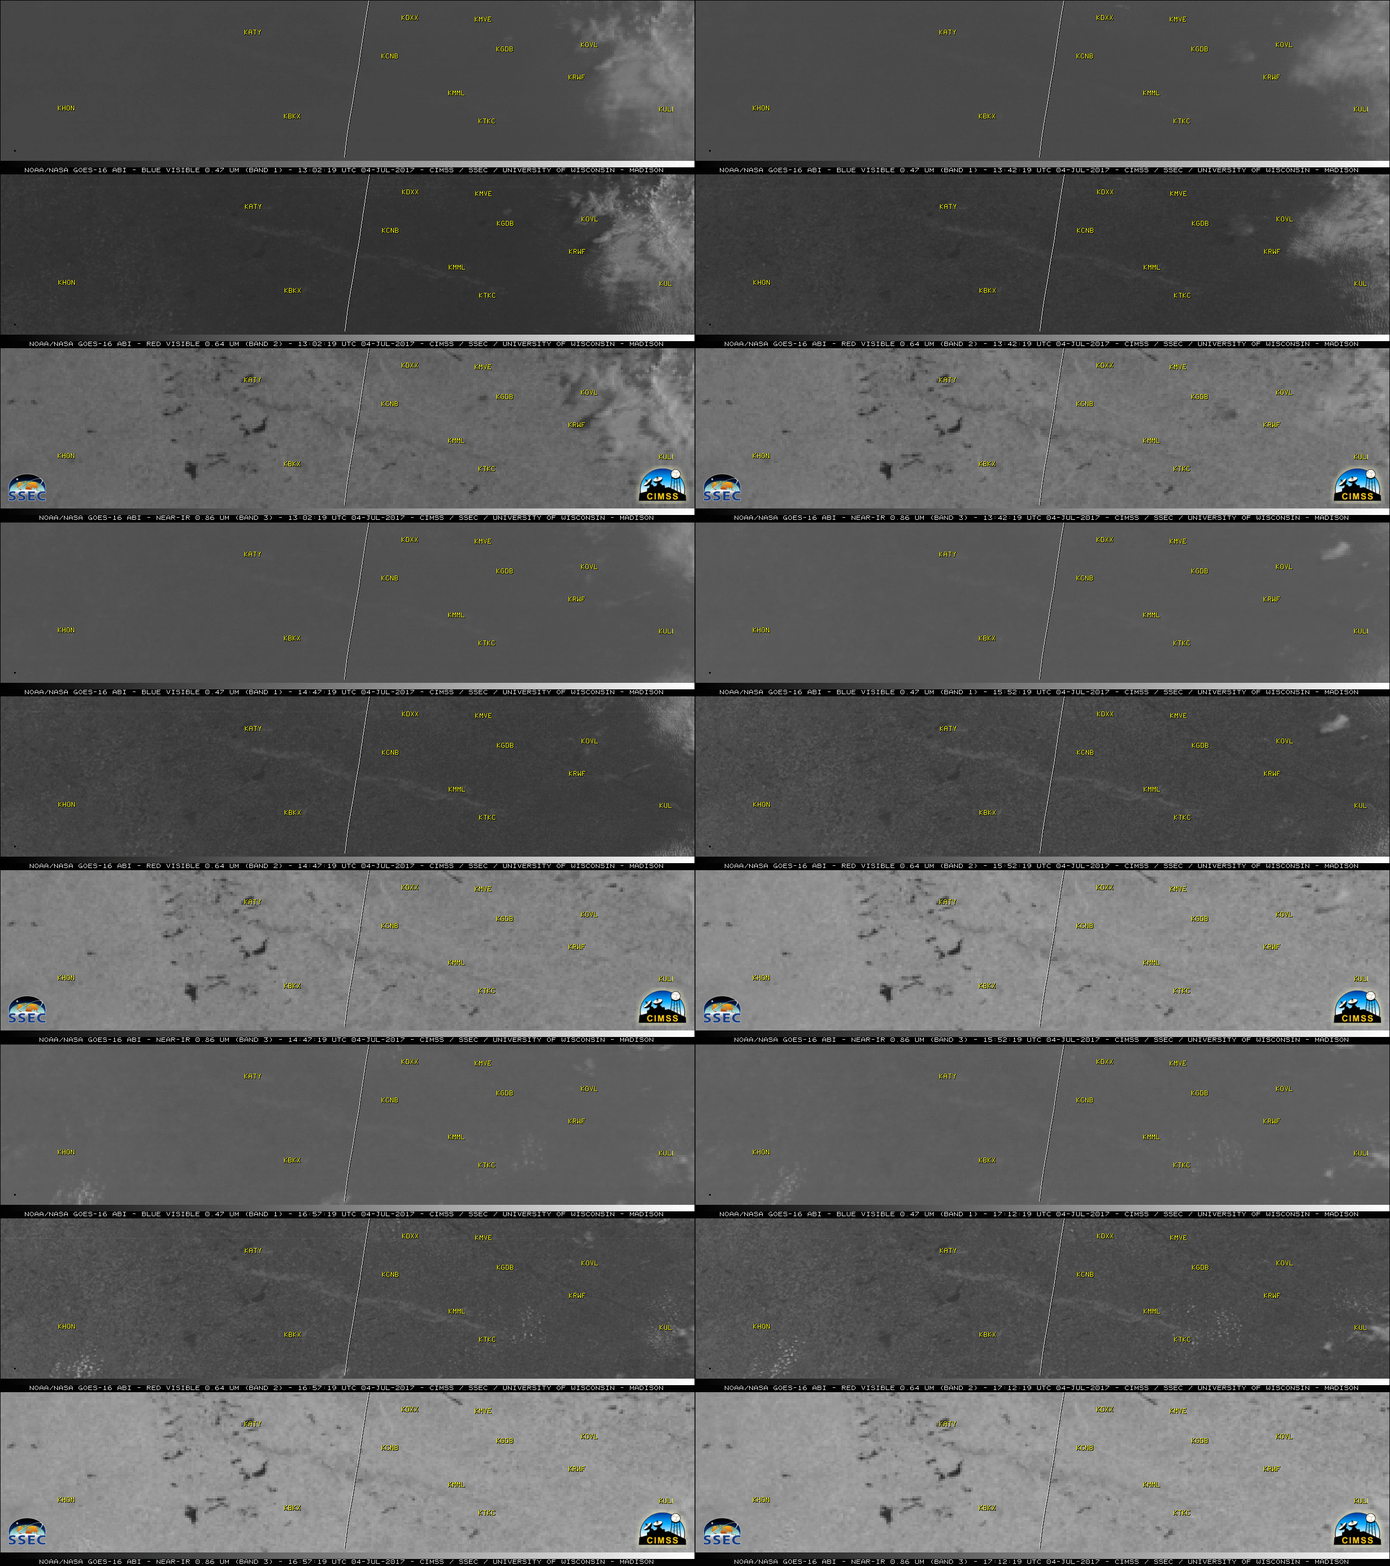
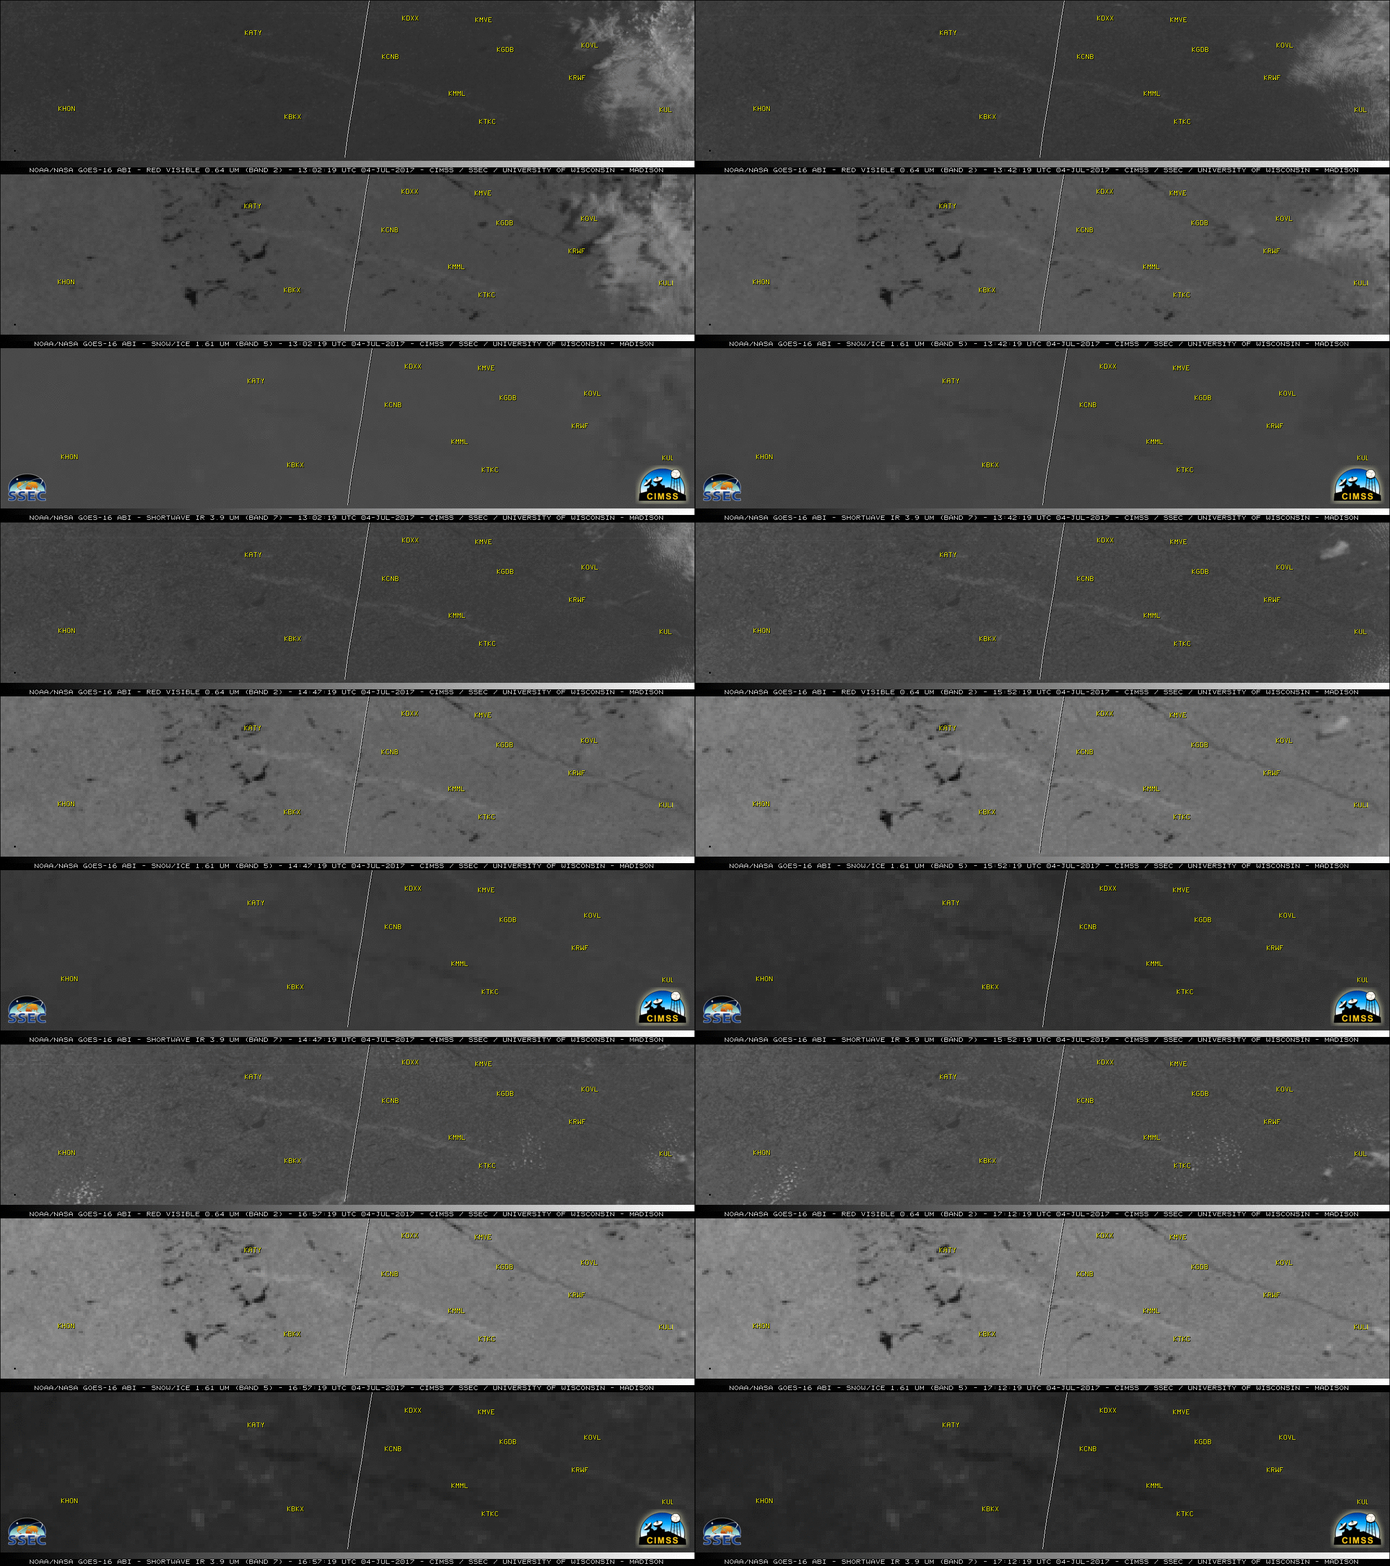
Nearly 2 weeks later, on 04 July, the hail damage swath was still apparent on GOES-16 imagery. In a comparison of “Blue” Visible (0.47 µm), “Red” Visible (0.64 µm) and Near-Infrared “Vegetation” (0.86 µm ) images (below), the northwest-to-southeast oriented hail damage swath was best seen on the 0.64 µm imagery (in part due to its higher spatial resolution, which is 0.5 km at satellite sub-point); healthy vegetation is more reflective at 0.86 µm, so the crop-damaged hail swath appears slightly darker in those images.
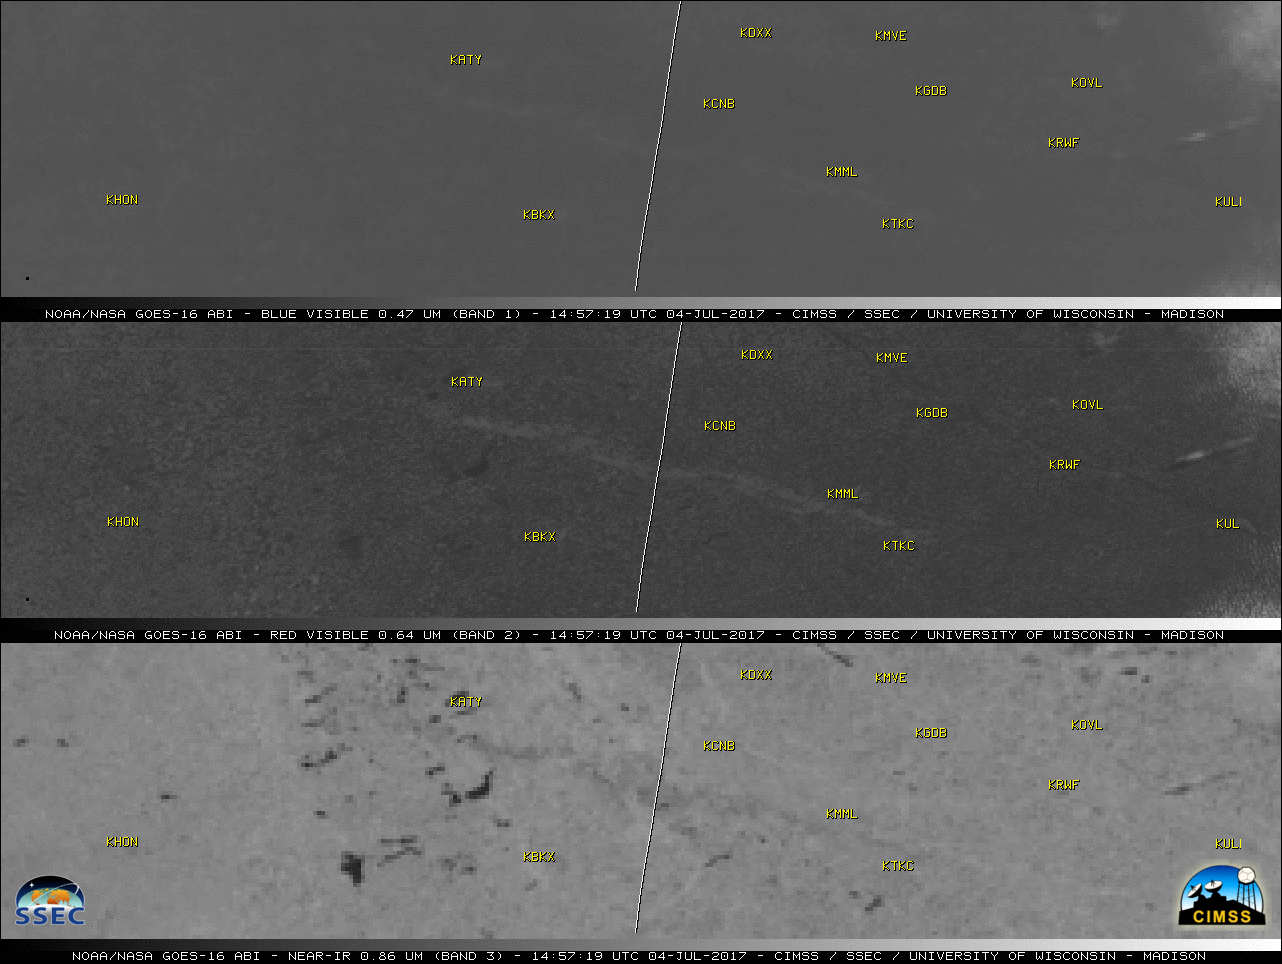
GOES-16 “Blue” Visible (0.47 µm, top), “Red” Visible (0.64 µm, middle) and Near-Infrared “Vegetation” (0.86 µm, bottom) images [click to play animation]
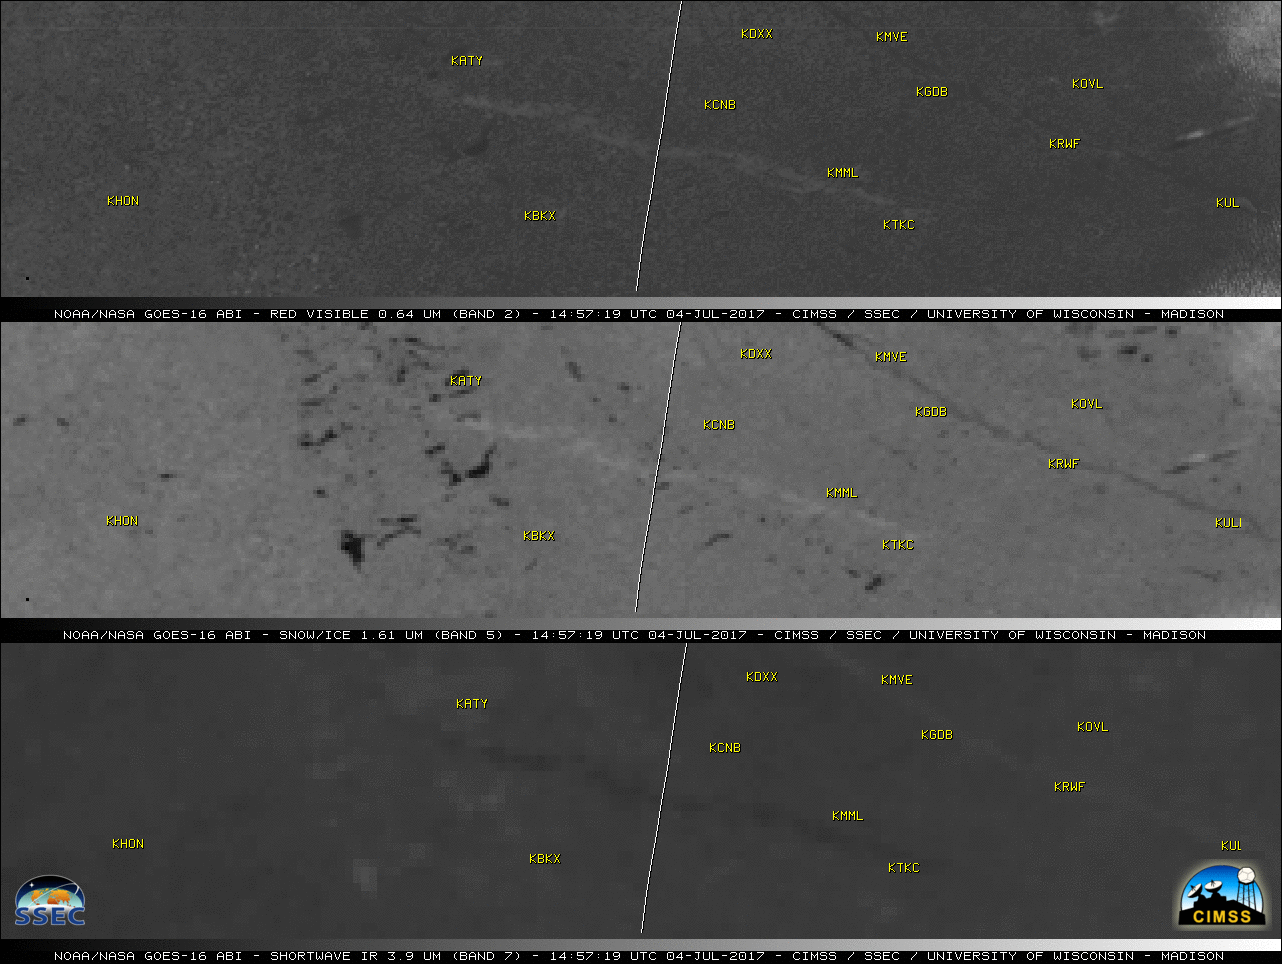
A signature of the hail damage swath was also seen in Near-Infrared “Snow/Ice” (
1.61 µm) and Shortwave Infrared
(3.9 µm) images
(below). The hail damage swath warmed more quickly on the 3.9 µm imagery — exhibiting a darker black appearance with time — compared to the adjacent fields of healthy crops.
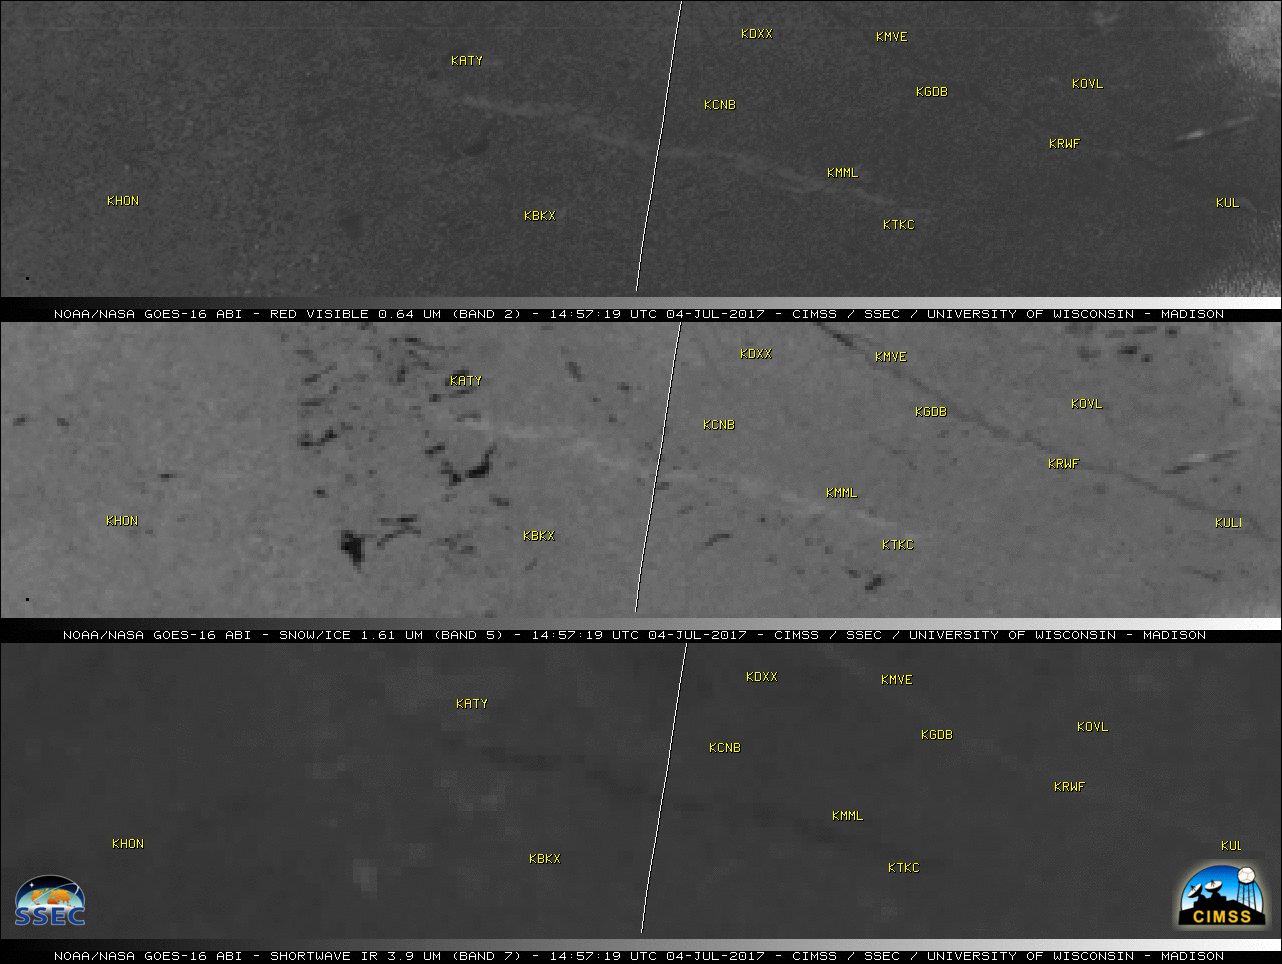
GOES-16 “Red” Visible (0.64 µm, top), Snow/Ice (1.61 µm, middle) and Shortwave Infrared (3.9 µm, bottom) images [click to play animation]
Why was the hail damage swath also seen on the 1.61 µm “Snow/Ice” (Band 5) imagery? A look at the Spectral Response Functions for GOES-16 ABI bands 3, 4, 5 and 6 — plotted with the reflectance of asphalt, dirt, grass and snow
(below) — show that the 1.61 µm Band 5 happens to cover a portion of the radiation spectrum where there is a minor peak in grass relectance
(denoted by the green plot).
![Spectral Response Functions for GOES-16 ABI Bands 3, 4, 5 and 6, along with the reflectance of asphalt, dirt, grass and snow [click to enlarge]](https://cimss.ssec.wisc.edu/satellite-blog/wp-content/uploads/sites/5/2017/07/SRF_grass_B3456.jpeg)
Spectral Response Functions for GOES-16 ABI Bands 3, 4, 5 and 6, along with the reflectance of asphalt, dirt, grass and snow [click to enlarge]
======================================================
![Aqua MODIS Land Surface Temperature product {click to enlarge]](https://cimss.ssec.wisc.edu/satellite-blog/wp-content/uploads/sites/5/2017/07/170704_1738utc_aqua_modis_LandSurfaceTemperature_SD_MN_hail_swath_anim.gif)
Aqua MODIS Land Surface Temperature product {click to enlarge]
Regarding the warmer temperatures seen on GOES-16 Shortwave Infrared images, the 1-km resolution Aqua MODIS Land Surface Temperature product at 1738 UTC (above) revealed a 10º F difference between the warmer hail damage swath (which appeared to be about 100 miles in length) and adjacent fields of undamaged crops. A similar result was noted on 03 July by NWS Aberdeen (below).
A comparison of before (21 June) and after (02 July) Aqua MODIS true-color Red/Green/Blue (RGB) images from the SSEC MODIS Direct Broadcast site (below) clearly shows the hail damage path.
![Aqua MODIS true-color RGB images, before (21 June) and after (02 July) the hail event [click to enlarge]](https://cimss.ssec.wisc.edu/satellite-blog/wp-content/uploads/sites/5/2017/07/170621_170702_aqua_modis_truecolor_SD_MN_hail_swath_before_after_anim.gif)
Aqua MODIS true-color RGB images, before (21 June) and after (02 July) the hail event [click to enlarge]
On 05 July a closer view of the hail scar was seen using a Suomi NPP VIIRS true-color RGB image from
RealEarth (below).
![Suomi NPP VIIRS true-color RGB image [click to enlarge]](https://cimss.ssec.wisc.edu/satellite-blog/wp-content/uploads/sites/5/2017/07/170705_1951utc_suomi_npp_viirs_truecolor_SD_MN_hail_swath_anim.gif)
Suomi NPP VIIRS true-color RGB image [click to enlarge]
Incidentally, on 02 July the
Sentinel-2A satellite provided 10-meter resolution true-color imagery of the hail swath:
===== 07 July Update =====
The hail damage swath was also evident on a 30-meter resolution Landsat-8 false-color RGB image from 07 July:
![Landsat-8 false-color RGB image [click to enlarge]](https://cimss.ssec.wisc.edu/satellite-blog/wp-content/uploads/sites/5/2017/07/170707_1712utc_landsat8_falsecolor_SD_MN_hail_swath_anim.gif)
Landsat-8 false-color RGB image [click to enlarge]
![Landsat-8 false-color RGB image, zoomed in on Castlewood, South Dakota [click to enlarge]](https://cimss.ssec.wisc.edu/satellite-blog/wp-content/uploads/sites/5/2017/07/170707_1712utc_landsat8_falsecolor_hail_swath_Castlewood_SD.jpeg)
Landsat-8 false-color RGB image, zoomed in on Castlewood, South Dakota [click to enlarge]
Other examples of satellite-observed hail damage swaths can be seen
here and
here.
View only this post
Read Less


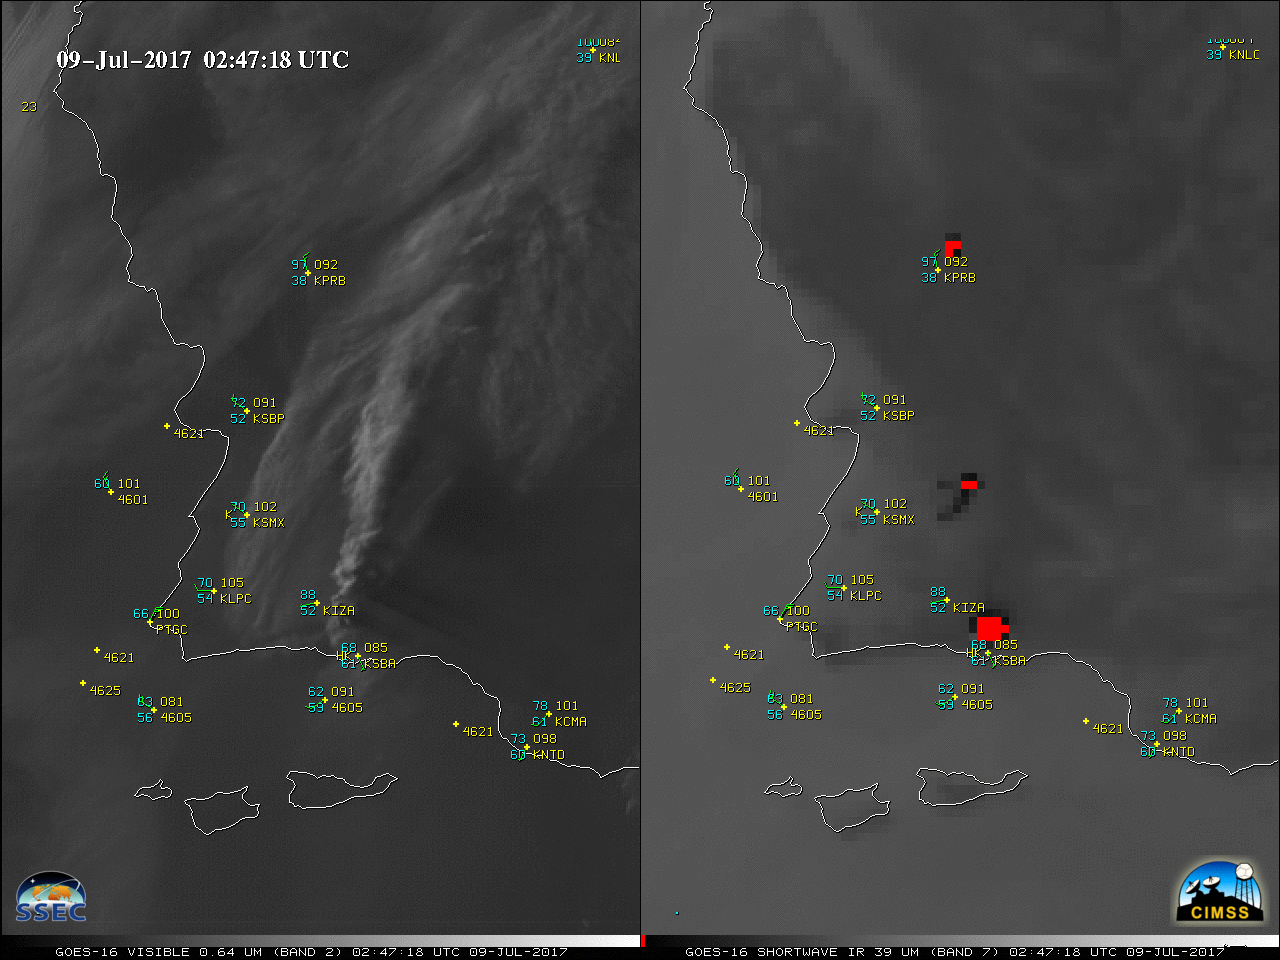
![GOES-16 Visible (0.64 µm) and Shortwave Infrared (3.9 µm) images, with hourly surface plots [click to play MP4 animation]](https://cimss.ssec.wisc.edu/satellite-blog/wp-content/uploads/sites/5/2017/07/958x638_GOES16A_B27_G16_VIS_SWIR_CA_FIRES_08JUL2017_2017190_024718_0002PANELS.GIF)
![GOES-16 Visible (0.64 µm, left), Near-Infrared Cirrus (1.38 µm, center) and Infrared Window (10.3 µm, right) images, with station identifiers plotted in yellow [click to play MP4 animation]](https://cimss.ssec.wisc.edu/satellite-blog/wp-content/uploads/sites/5/2017/07/960x427_AGOES16_B2413_G16_3PANEL_CA_FIRES_VIS_CIRRUS_IR_08JUL2017_2017190_021718_0003PANELS.GIF)
![Suomi NPP VIIRS Day/Night Band (0.7 µm) and Shortwave Infrared (3.74 µm) images [click to enlarge]](https://cimss.ssec.wisc.edu/satellite-blog/wp-content/uploads/sites/5/2017/07/170708_0910utc_suomi_npp_viirs_DayNightBand_ShortwaveInfrared_Alamo_Fire_CA_anim.gif)