GOES-16 data posted on this page are preliminary, non-operational data and are undergoing testingThe strong pressure gradient around a Low Pressure system over Alberta and Saskatchewan caused strong winds across northern Montana on 24 May 2017, and blowing dust was the result, especially in Hill and Blaine Counties. The visible animation, above, from 1707 to 1802 UTC... Read More
GOES-16 Visible Imagery (0.64 µm) from 1707 through 1802 UTC on 24 May 2017 (Click to enlarge)
GOES-16 data posted on this page are preliminary, non-operational data and are undergoing testing
The strong pressure gradient around a Low Pressure system over Alberta and Saskatchewan caused strong winds across northern Montana on 24 May 2017, and blowing dust was the result, especially in Hill and Blaine Counties. The visible animation, above, from 1707 to 1802 UTC on 24 May, shows a faint hazy signature along the border of Canada. The emphasis is on the word ‘faint’ — it is very difficult to pick out the signature unless you know it’s there already (Thanks to MIC Tanja Fransen at WFO Glasgow for alerting us to this event). The ‘Blue’ Visible band animation (below) similarly shows the dust, but it is not distinct in this band either. (*Note* — part of this, of course, is because the default enhancement for visible imagery has been used. If the ‘low light’ enhancement is applied, the dust signature is more apparent. This visible animation from 1502-2122, courtesy Tanja Fransen, more obviously shows the dust).
GOES-16 Visible Imagery (0.47 µm) from 1707 through 1802 UTC on 24 May 2017 (Click to enlarge)
Brightness Temperature Difference products are routinely available in AWIPS. The Split-Window Difference (SWD), below, shows the difference between the ‘Clean Infrared Window’ (10.33 µm) and the ‘Dirty Infrared Window’ (12.3 µm) (‘Clean’ and ‘Dirty’ referring to a little and more, respectively, water vapor absorption) has historically been used to detect dust: dust will absorb 10.33 µm radiation but it will not absorb 12.3 µm radiation, thus the SWD can highlight regions of dust. However, that difference is also influenced by water vapor above the dust, and by the type of dust being lofted.
Split Window Difference (10.33 µm – 12.2 µm) from 1707 to 1802 UTC, 24 May 2017 (Click to enlarge)
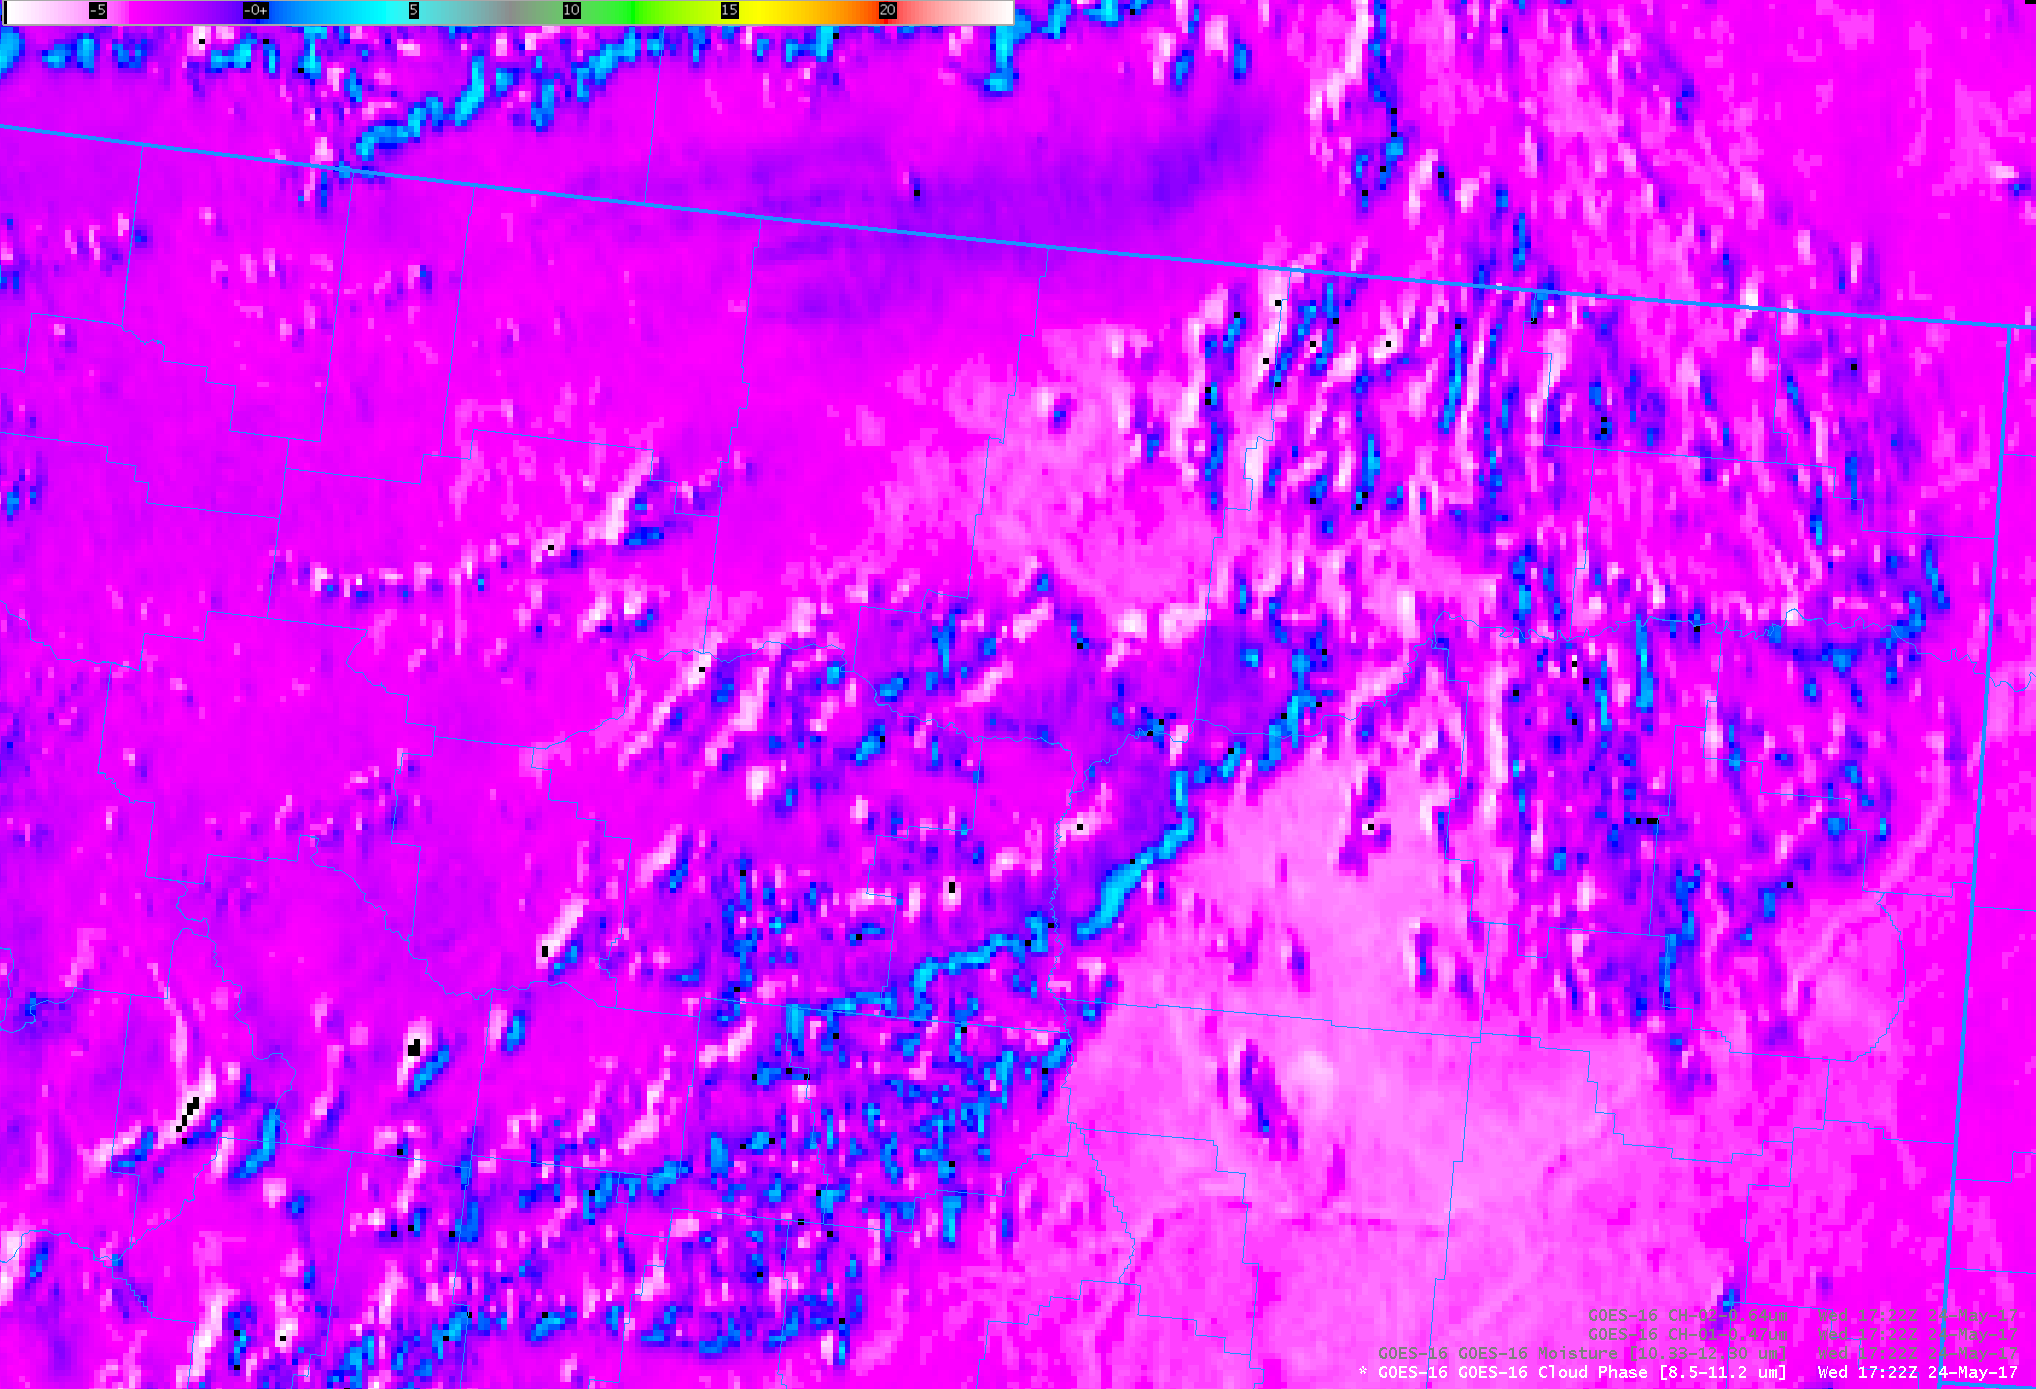
The Cloud Phase Difference (8.5 µm – 11.2 µm) also can highlight regions of dust, and for this case the signal of dust was a bit more distinct.
Cloud Phase Brightness Temperature Difference (8.5 µm – 11.2 µm) from 1707 to 1802 UTC, 24 May 2017 (Click to enlarge)
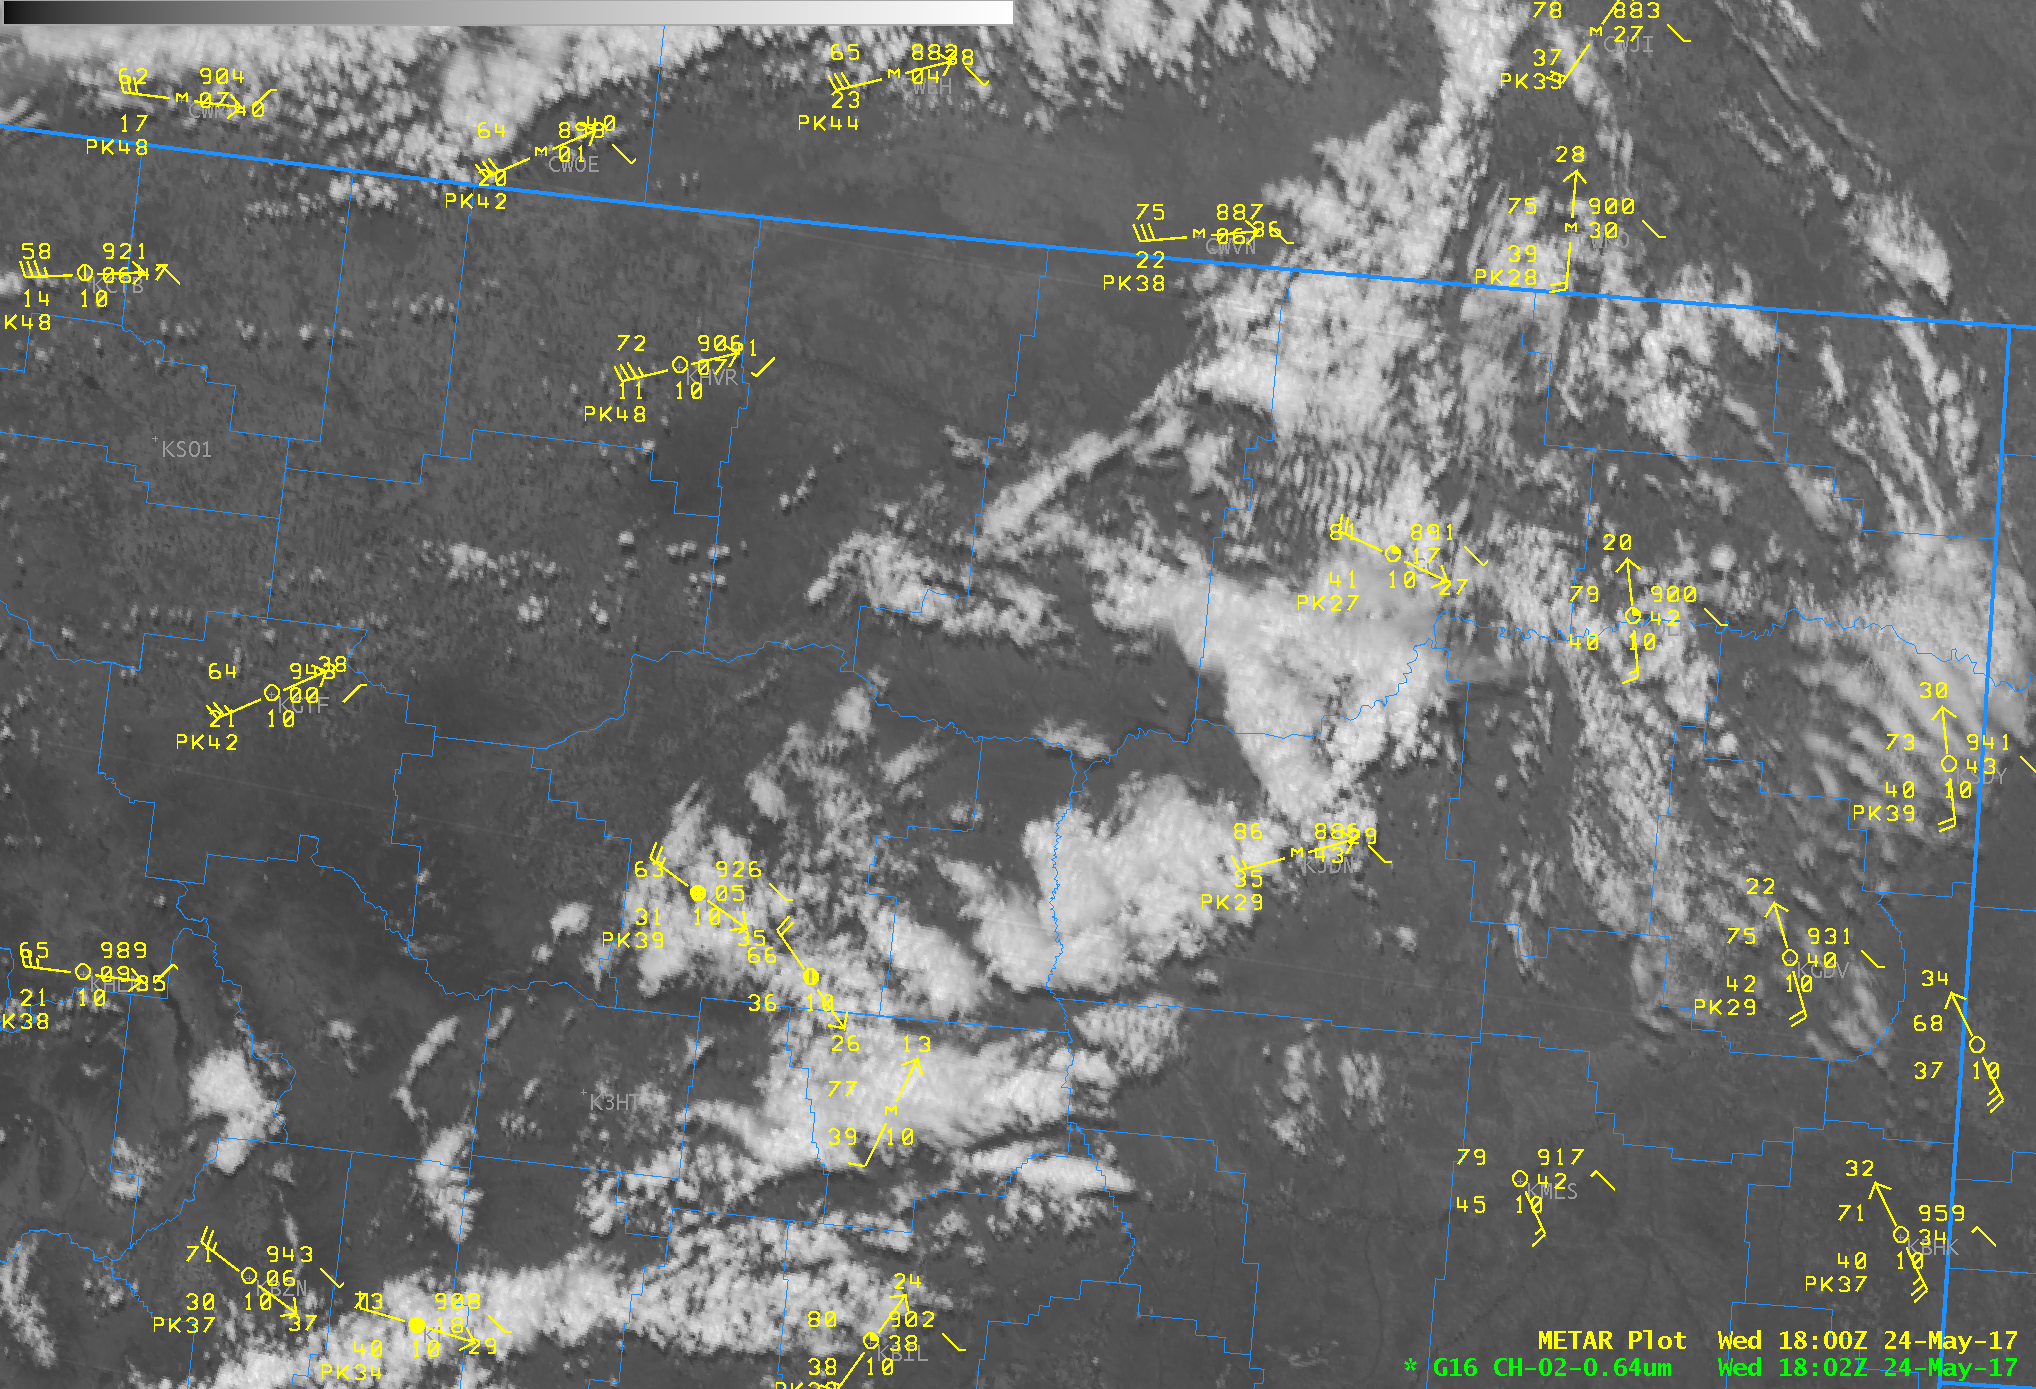
Surface data plotted over the 0.64 µm at 1712 UTC, below, show the strong winds in the region (Here is an image at 1802 UTC). Visibilities in the areas of blowing dust were reported to be near zero.
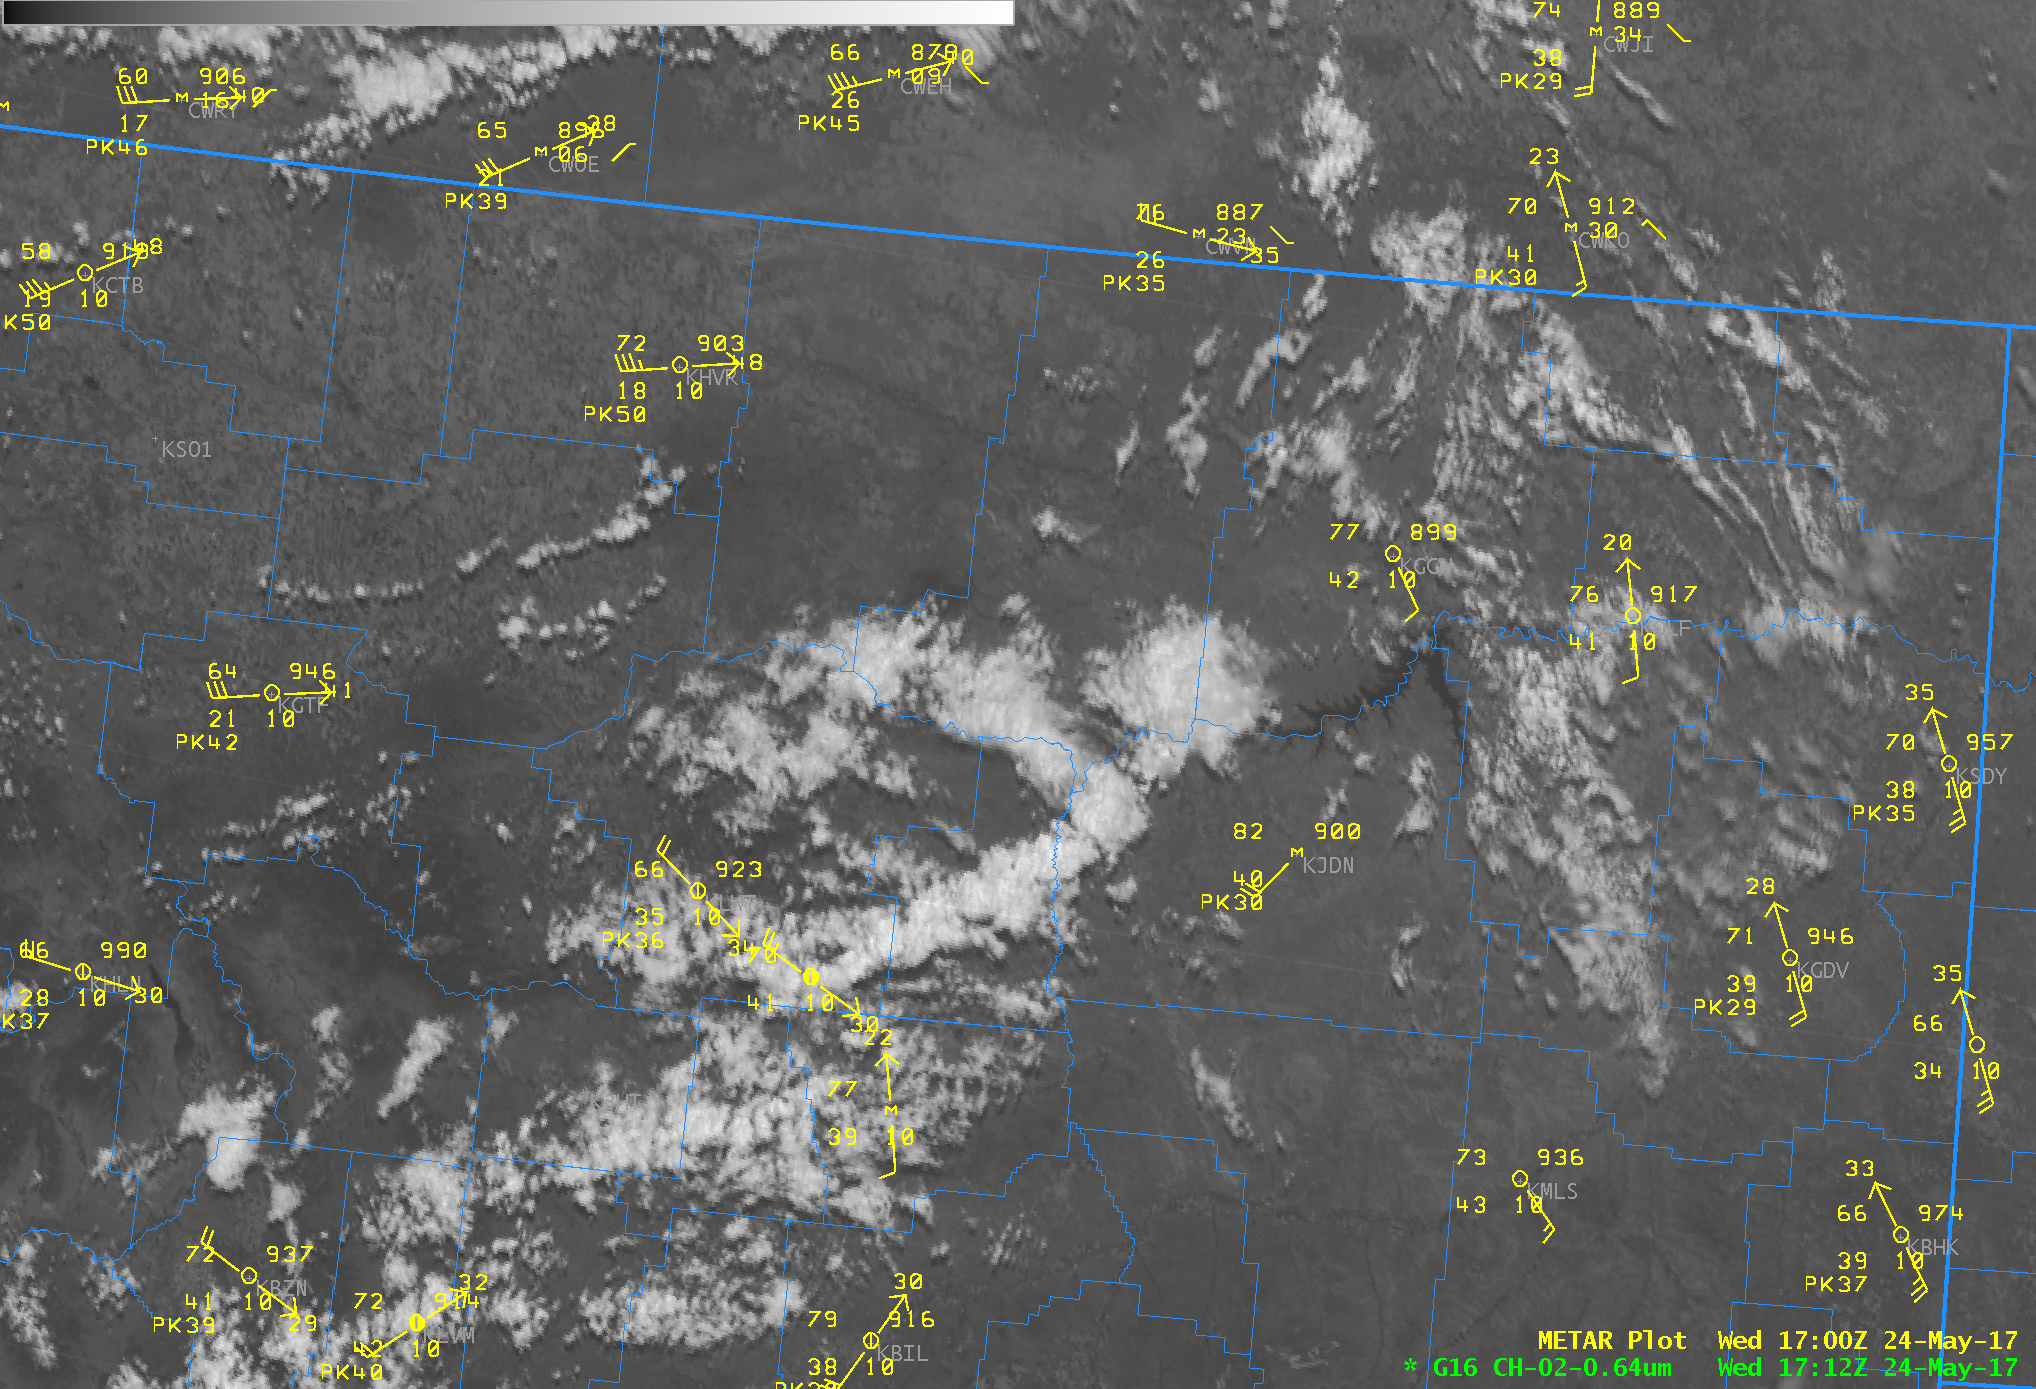
GOES-16 Visible (0.64 µm) at 1712 UTC and 1700 UTC surface observations (Click to enlarge)
A Terra MODIS true-color Red/Green/Blue (RGB) image at 1745 UTC, below, revealed that the source of some of the most dense dust plumes appeared to be uncultivated fields located north and northeast of Havre.
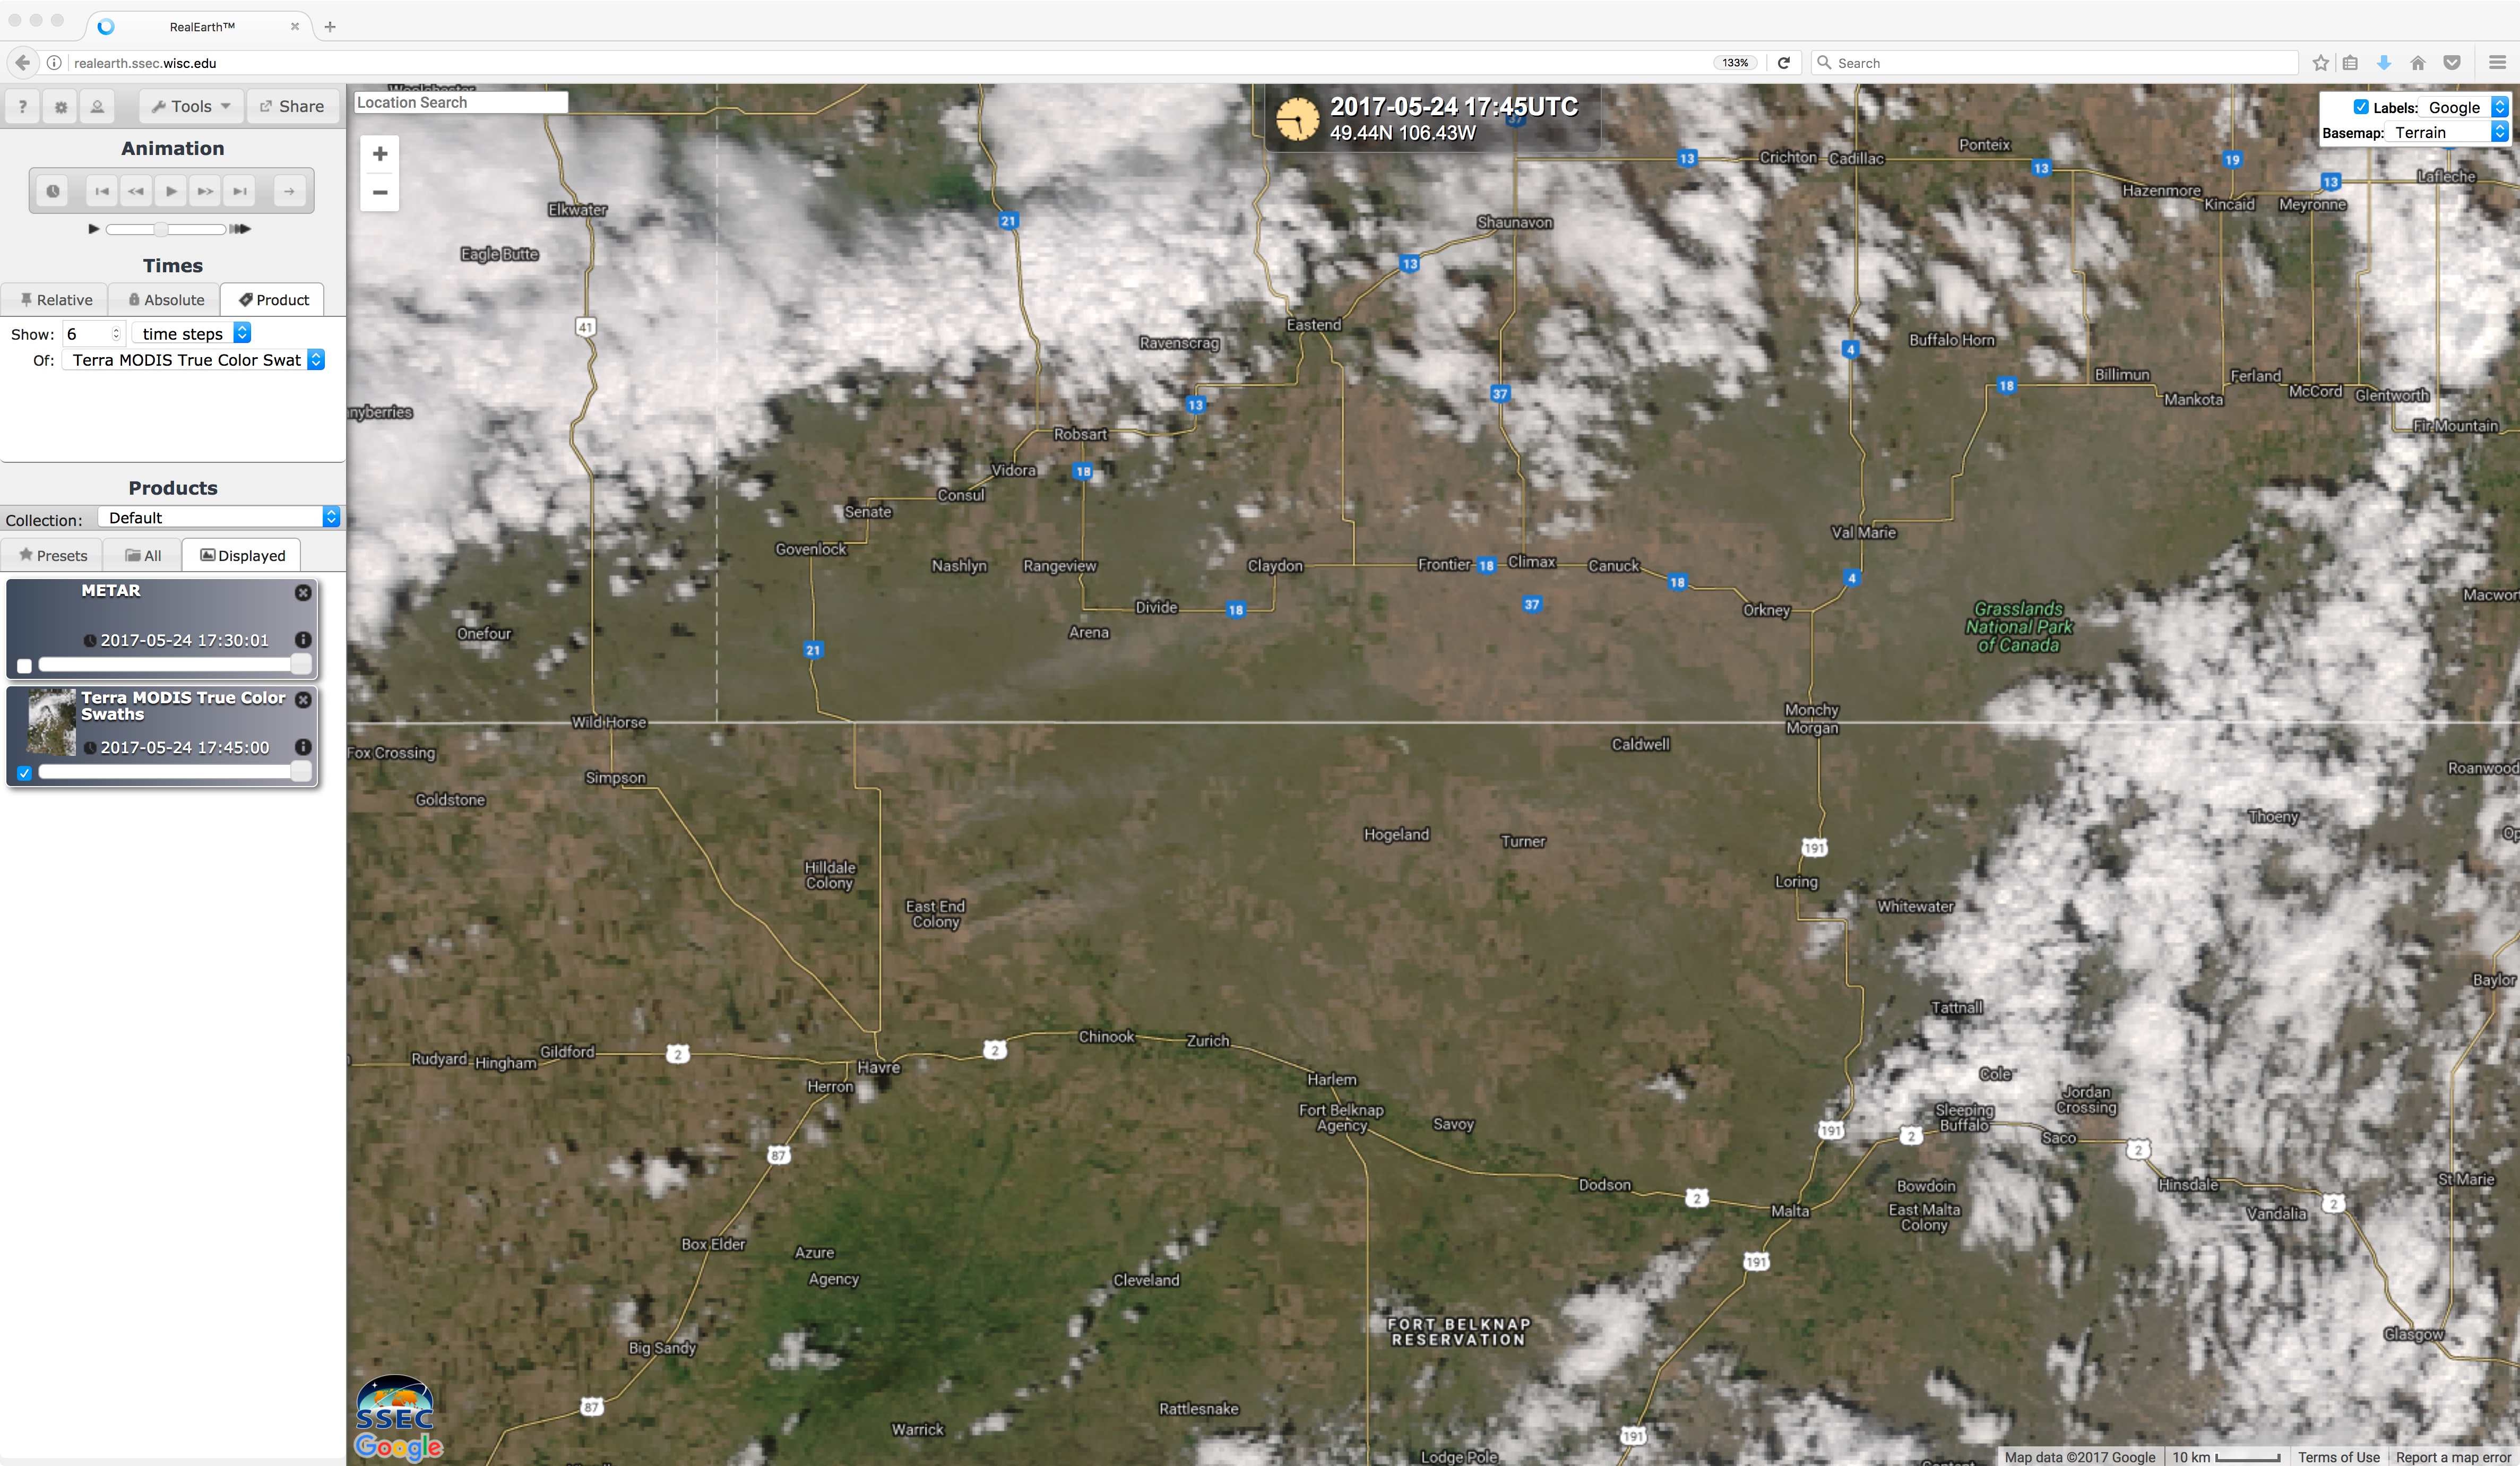
Terra MODIS true-color RGB image (Click to enlarge)
(Added: Stuart Lawrence, south of Rosetown in west-central Saskatchewan, tweeted out this video that showed the dust storm there. He reported winds up to 98 km/hour). Here is another image of the dust in Saskatchewan.
The GOES Aerosol/Smoke Products (GASP) showed a noticeable signal for this dust. Here is a large-scale animation from 1315-2145 UTC, with a closer view from 1015-2345 UTC here)
View only this post
Read Less
![Himawari-8 Visible (0.64 µm, left) and Infrared Window (10.4 µm, right) images, with hourly surface and ship reports plotted in yellow [click to play animation]](https://cimss.ssec.wisc.edu/satellite-blog/wp-content/uploads/sites/5/2017/05/170528_himawari8_visible_infrared_Bogoslof_AK_anim.gif)
![COMS-1 Visible (0.67 µm) images, with surface observations plotted in yellow [click to enlarge]](https://cimss.ssec.wisc.edu/satellite-blog/wp-content/uploads/sites/5/2017/05/170528_2315UTC_COMS1_VISIBLE_BOGOSLOF.GIF)
![Himawari-8 false-color RGB images [click to play animation]](https://cimss.ssec.wisc.edu/satellite-blog/wp-content/uploads/sites/5/2017/05/170528_himawari8_Bogoslof_rgb_1_anim.gif)
![Himawari-8 false-color images [click to play animation]](https://cimss.ssec.wisc.edu/satellite-blog/wp-content/uploads/sites/5/2017/05/170528_himawari8_Bogoslof_rgb_2_anim.gif)
![Himawari-8 Infrared Window (10.4 µm) images and Ash Cloud Height retrievals [click to play animation]](https://cimss.ssec.wisc.edu/satellite-blog/wp-content/uploads/sites/5/2017/05/170528_himawari8_Bogoslof_ash_height_anim.gif)
![GOES-15 Water Vapor (6.5 µm) images, with pilot reports of turbulence [click to play animation]](https://cimss.ssec.wisc.edu/satellite-blog/wp-content/uploads/sites/5/2017/05/170523_goes15_water_vapor_pireps_anim.gif)
![GOES-15 Water Vapor (6.5 µm) images, with contours of satellite wind derived upper-level divergence [click to enlarge]](https://cimss.ssec.wisc.edu/satellite-blog/wp-content/uploads/sites/5/2017/05/170523_goes15_water_vapor_upper_level_divergence_anim.gif)
![GOES-15 sounder Water Vapor (6.5 µm, top; 7.0 µm, middle; 7.5 µm, bottom) images [click to enlarge]](https://cimss.ssec.wisc.edu/satellite-blog/wp-content/uploads/sites/5/2017/05/170523_goes15_sounder_water_vapor_anim.gif)
![GOES-15 sounder Water Vapor band weighting functions [click to enlarge]](https://cimss.ssec.wisc.edu/satellite-blog/wp-content/uploads/sites/5/2017/05/goes15_sounder_water_vapor_weghting_functions_USSA.jpeg)
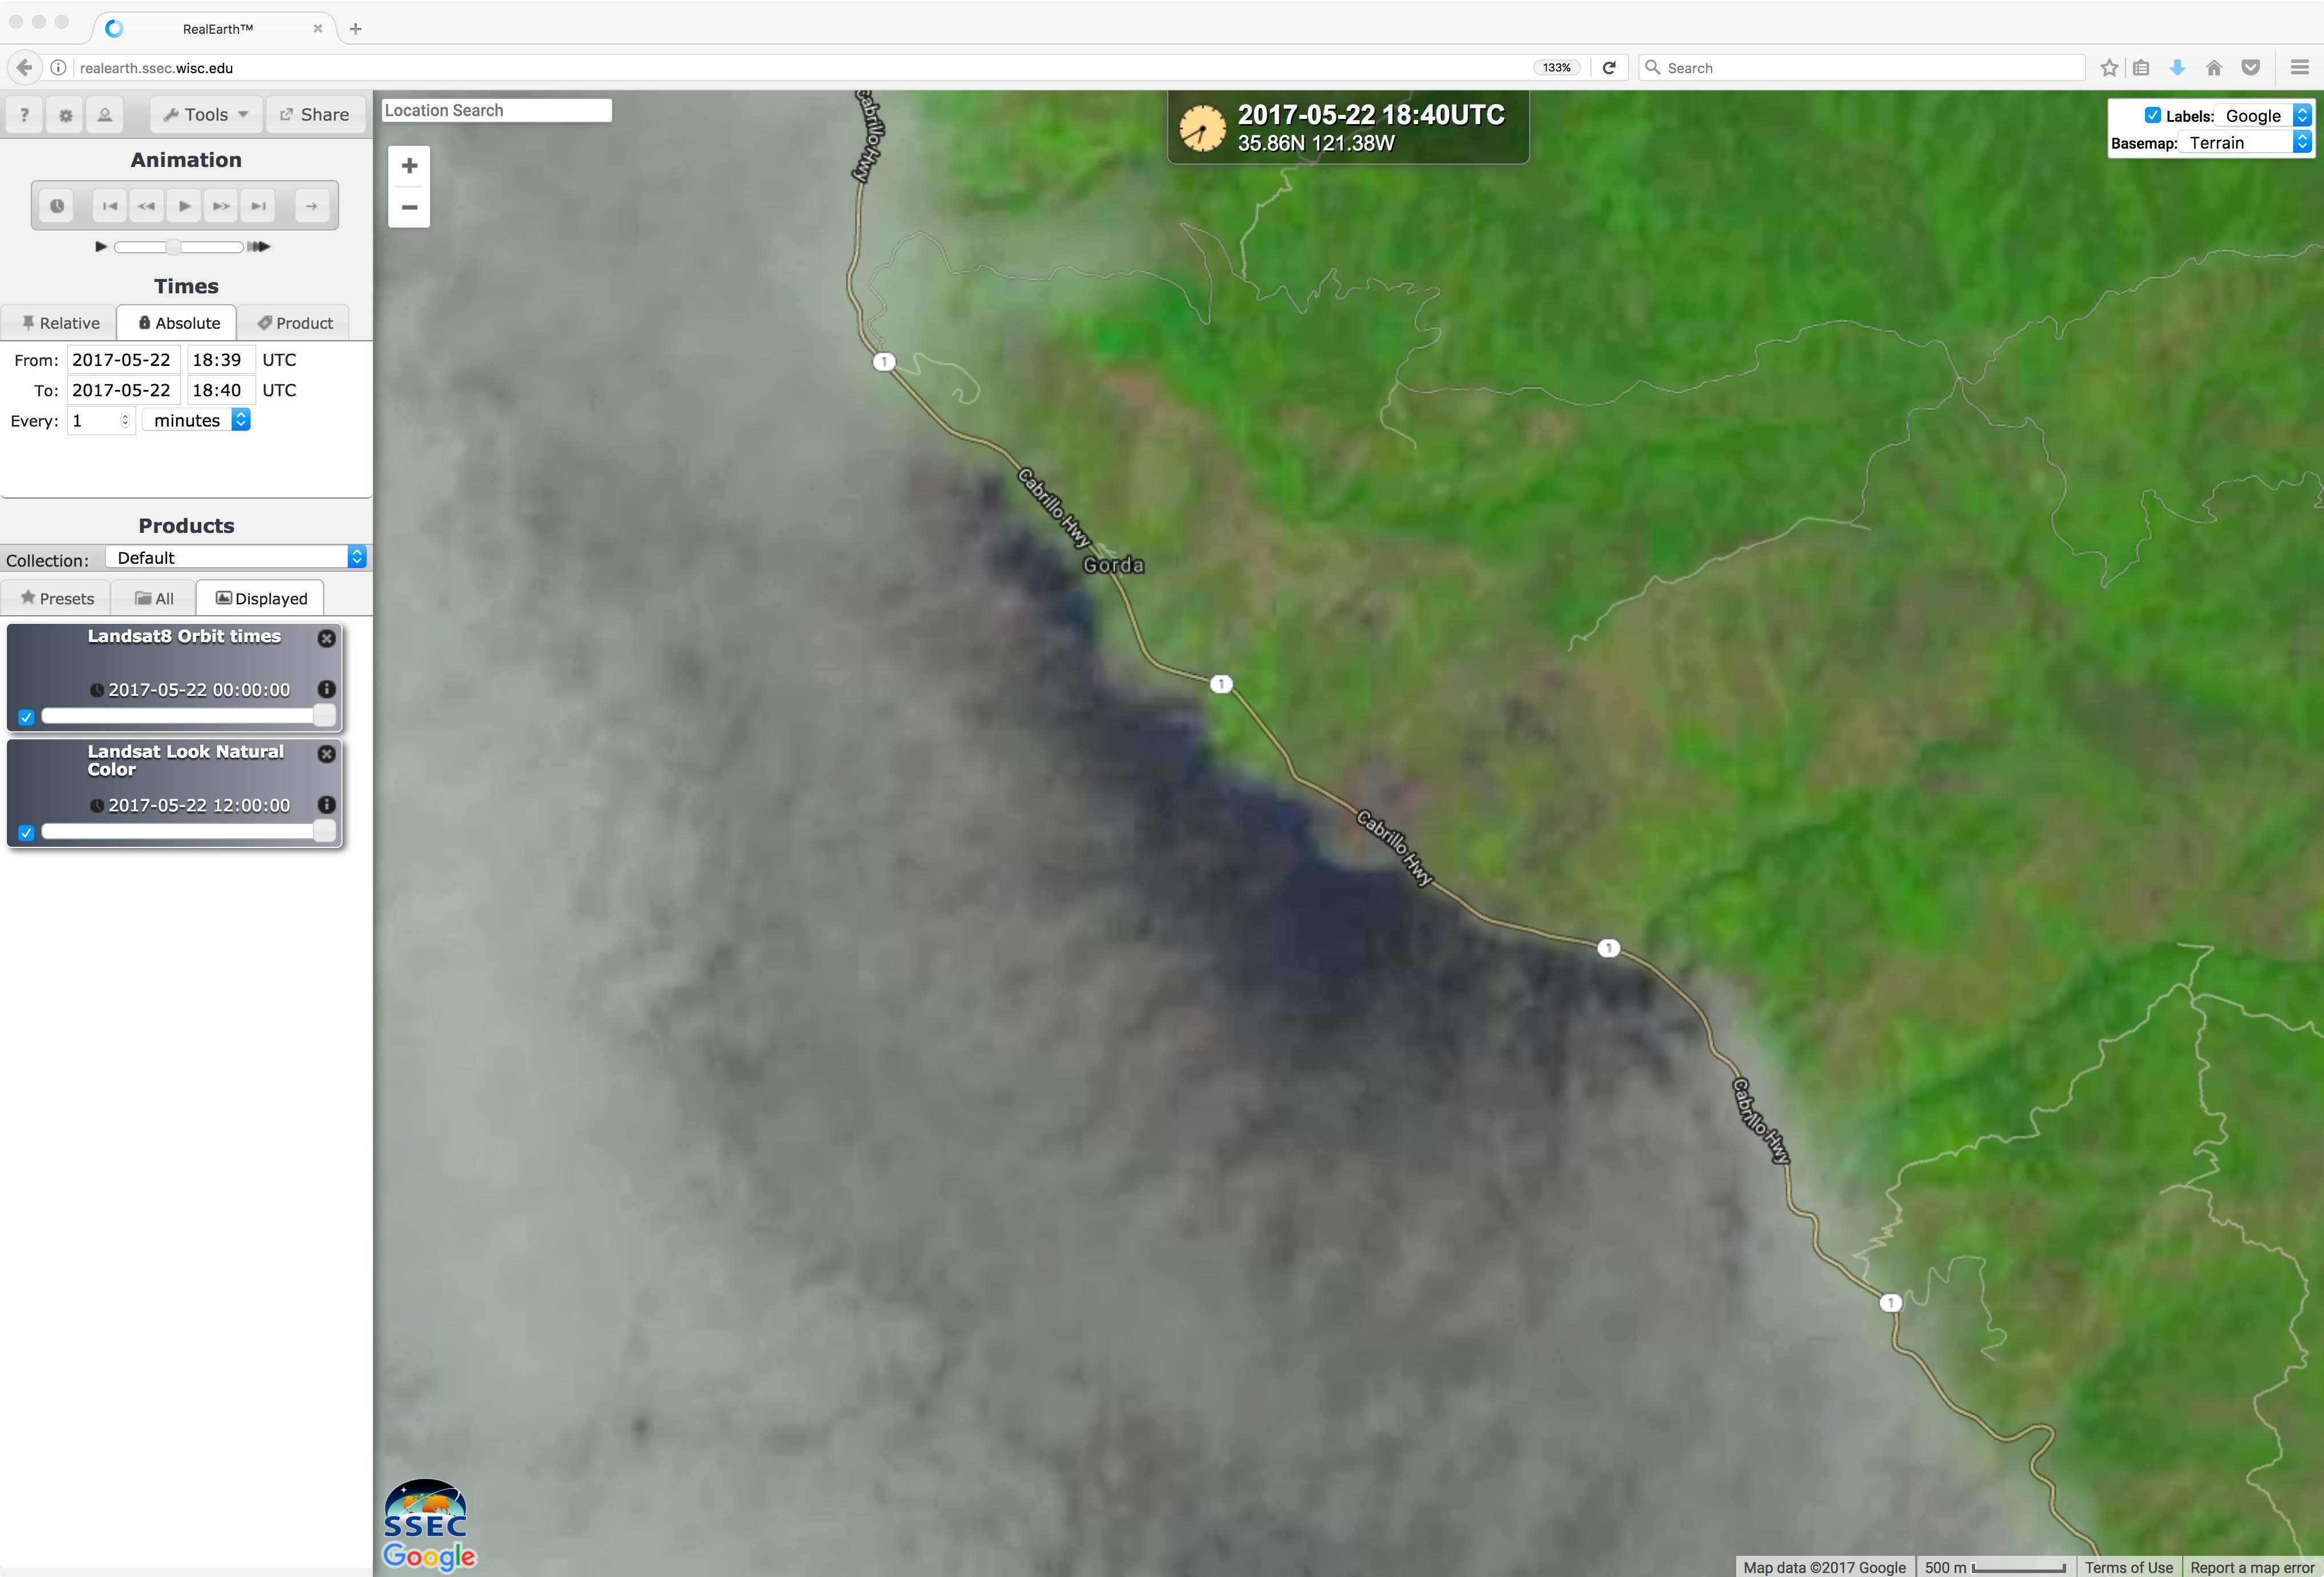
![Landsat-8 false-color images [click to enlarge]](https://cimss.ssec.wisc.edu/satellite-blog/wp-content/uploads/sites/5/2017/05/170522_1840utc_landsat8_falsecolor_Mud_Creek_CA_landslide_anim.gif)
