* The GOES-16 data posted on this page are preliminary, non-operational data and are undergoing testing. *A significant outbreak of severe thunderstorms developed on 16 May 2017, producing damaging winds, large hail and tornadoes from Texas to Wisconsin (SPC storm reports). On the northern end of this outbreak, hail as large as 3.0 inches... Read More
![GOES-16 Visible (0.64 µm, top) and Infrared Window (10.3 µm, bottom) images, with SPC storm reports plotted in cyan [click to play animation]](https://cimss.ssec.wisc.edu/satellite-blog/wp-content/uploads/sites/5/2017/05/G16_VIS_IR_MN_WI_SPC_17MAY2017_480x1280_B213_2017136_223218_0002PANELS.GIF)
GOES-16 Visible (0.64 µm, top) and Infrared Window (10.3 µm, bottom) images, with SPC storm reports plotted in cyan [click to play animation]
A significant outbreak of severe thunderstorms developed on 16 May 2017, producing damaging winds, large hail and tornadoes from Texas to Wisconsin (SPC storm reports). On the northern end of this outbreak, hail as large as 3.0 inches in diameter fell in northwestern Wisconsin, and a long-track tornado resulted in 1 fatality and 25 injuries near Chetek (NWS Twin Cities MN summary). GOES-16 Visible (0.64 µm) and Infrared Window (10.3 µm) images (above) showed the development of the convective systems; surface-to-cloud-top parallax-corrected SPC storm reports are plotted on the images. Overshooting tops and above-anvil cloud plumes were evident on the visible images, with well-defined “enhanced-V” and “cold/warm thermal couplet” storm top signatures seen on the infrared imagery.
A closer view of the GOES-16 Visible and Infrared Window images (below) provided more detail of the supercell storm-top structure. Note that the pronounced infrared enhanced-V signature began to develop near the Minnesota/Wisconsin border just before 2100 UTC, which was about 40 minutes prior to the first Wisconsin hail report of 2.5 inches and the beginning of the long-track tornado. Since the early 1980s (reference), the enhanced-V satellite signature has been recognized as a reliable predictor of supercell thunderstorms having a high potential to produce either damaging winds, large hail or tornadoes; an automated Enhanced-V / Overshooting Top product (reference) will be available using the ABI instrument on the GOES-R series of satellites..
![GOES-16 Visible (0.64 µm, top) and Infrared Window (10.3 µm, bottom) images, with plots of SPC storm reports and hourly surface reports [click to play animation]](https://cimss.ssec.wisc.edu/satellite-blog/wp-content/uploads/sites/5/2017/05/G16_VIS_IR_MN_WI_ZOOM_SPC_17MAY2017_480x1280_B213_2017136_223218_0002PANELS.GIF)
GOES-16 Visible (0.64 µm, top) and Infrared Window (10.3 µm, bottom) images, with plots of SPC storm reports and hourly surface reports [click to play animation]
A comparison of GOES-13
(GOES-East) and GOES-16 Infrared Window images
(below) demonstrated the advantage of improved spatial resolution (2-km at satellite sub-point with GOES-16, vs 4-km with GOES-13) for identifying features such as cold overshooting tops.
![Infrared Window images from GOES-13 (10.7 µm, top) and GOES-16 (10.3 µm, bottom) , with SPC storm reports plotted in cyan [click to play animation]](https://cimss.ssec.wisc.edu/satellite-blog/wp-content/uploads/sites/5/2017/05/G13_G16_IR_MN_WI_SPC_17MAY2017_480x1280_B413_2017136_230700_0002PANELS.GIF)
Infrared Window images from GOES-13 (10.7 µm, top) and GOES-16 (10.3 µm, bottom), with SPC storm reports plotted in cyan [click to play animation]
True-color Red/Green/Blue (RGB) imagery
(below; courtesy of Kaba Bah, CIMSS) offered another view of the storms on a regional scale.
![GOES-16 true-color RGB images [click to play animation]](https://cimss.ssec.wisc.edu/satellite-blog/wp-content/uploads/sites/5/2017/05/170516_2237utc_goes16_truecolor.jpeg)
GOES-16 true-color RGB images [click to play animation]
A time series of the the NOAA/CIMSS ProbTor product and its ingredients, below, showed large values of ProbTor (forced especially, perhaps, by large values of Azimuthal Shear). Storm Reports from SPC show a tornado time near Chetek of 2235 UTC
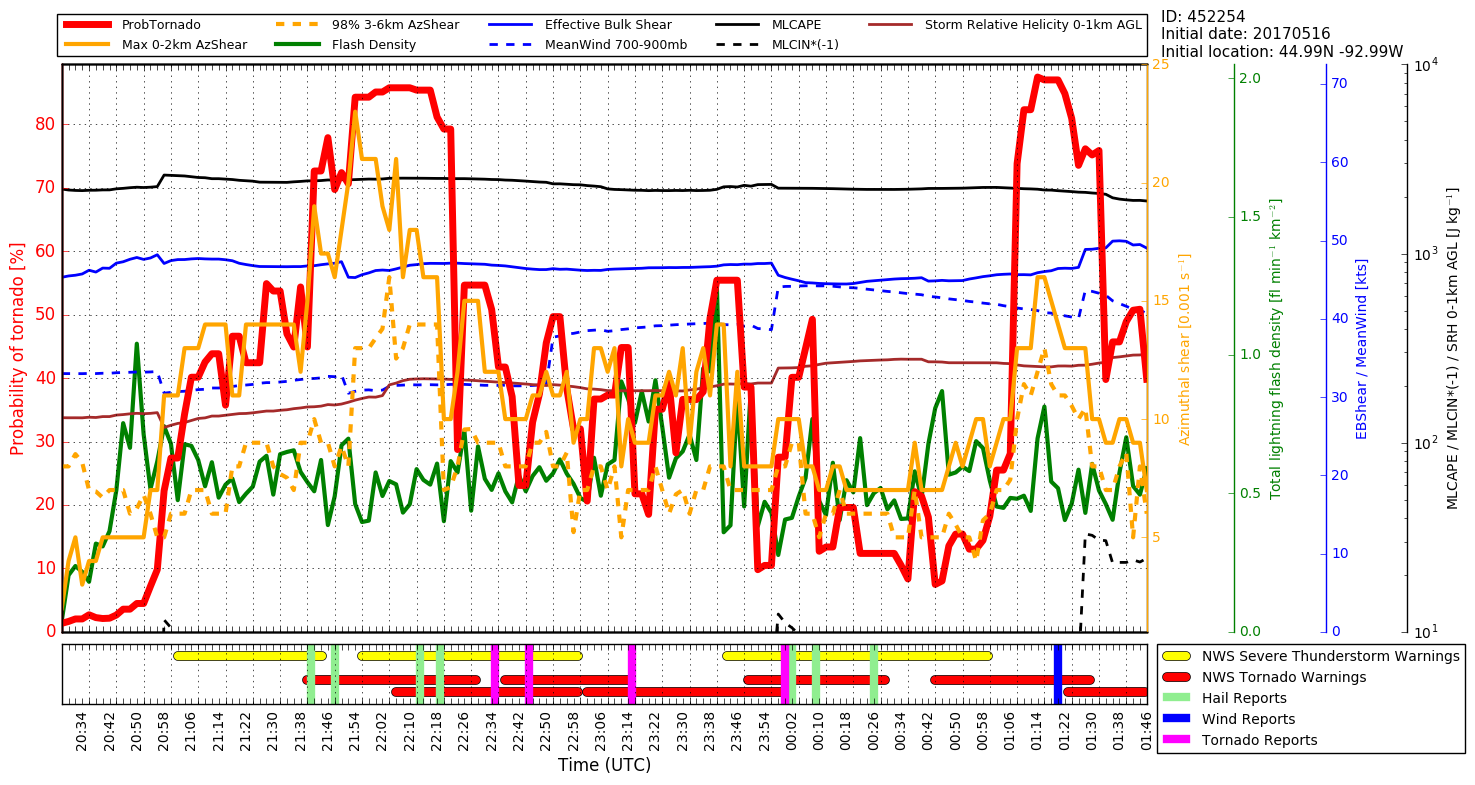
Time Series of NOAA/CIMSS ProbTor (red line) and ProbTor ingredients from 2034 UTC 16 May through 0146 UTC 17 May 2017 (Click to enlarge)
An animation of NOAA/CIMSS ProbSevere, below, from 2100 through 2310 UTC, shows the radar-defined objects, including an annotated one that was associated with the Chetek tornado (for which the time series is displayed above). That object crosses the St. Croix River from Minnesota into Wisconsin at 2100 UTC, subsequently moving over Turtle Lake and Barron, and ending up, at 2310 UTC (the end of the animation) near Ladysmith. It was the sole radar object with a ProbTor that exceeded 20% — with one exception. At 2220 and 2230 UTC the radar object just to the west of the Chetek tornado radar object had ProbTor values of 20% and 26%, respectively. (Click here for an unannotated animation).

NOAA/CIMSS ProbSevere from 2100 through 2310 UTC on 16 May 2017 (Click to enlarge)
View only this post
Read Less
![GOES-16 Visible (0.64 µm) images, with hourly plots of surface reports [click to play animation]](https://cimss.ssec.wisc.edu/satellite-blog/wp-content/uploads/sites/5/2017/05/170520_goes16_visible_WA_fog_anim.gif)
![Suomi NPP VIIRS Visible (0.64 µm) images, with RTMA surface winds plotted in cyan [click to enlarge]](https://cimss.ssec.wisc.edu/satellite-blog/wp-content/uploads/sites/5/2017/05/170520_2054utc_viirs_visible_rtma_surface_winds_WA_strait_fog_stratus_anim.gif)
![Terra MODIS true-color RGB images [click to enlarge]](https://cimss.ssec.wisc.edu/satellite-blog/wp-content/uploads/sites/5/2017/05/170421_170520_modis_truecolor_Fraser_River_BC_sediment_anim.gif)
![GOES-16 Visible (0.64 µm, top) and Infrared Window (10.3 µm, bottom) images, with SPC storm reports plotted in cyan [click to play animation]](https://cimss.ssec.wisc.edu/satellite-blog/wp-content/uploads/sites/5/2017/05/170516_goes16_visible_infrared_spc_storm_reports_MN_WI_anim.gif)
![GOES-16 Visible (0.64 µm, top) and Infrared Window (10.3 µm, bottom) images, with plots of SPC storm reports and hourly surface reports [click to play animation]](https://cimss.ssec.wisc.edu/satellite-blog/wp-content/uploads/sites/5/2017/05/170516_goes16_visible_infrared_spc_storm_reports_MN_WI_zoom_anim.gif)
![Infrared Window images from GOES-13 (10.7 µm, top) and GOES-16 (10.3 µm, bottom) , with SPC storm reports plotted in cyan [click to play animation]](https://cimss.ssec.wisc.edu/satellite-blog/wp-content/uploads/sites/5/2017/05/170516_goes13_goes16_infrared_spc_storm_reports_MN_WI_anim.gif)
![GOES-16 Infrared Window (10.3 µm) images [click to play animation]](https://cimss.ssec.wisc.edu/satellite-blog/wp-content/uploads/sites/5/2017/05/170510_goes16_infrared_TS_Adrian_anim.gif)
![GOES-16 Visible (0.64 µm) images [click to play animation]](https://cimss.ssec.wisc.edu/satellite-blog/wp-content/uploads/sites/5/2017/05/170510_goes17_visible_TS_Adrian_anim.gif)
![GOES-16 Visible (0.64 µm) mesoscale sector images [click to play animation]](https://cimss.ssec.wisc.edu/satellite-blog/wp-content/uploads/sites/5/2017/05/170510_goes16_visible_mesoscale_TS_Adrian_anim.gif)
![GOES-16 Visible (0.64 µm, left) and Infrared Window (10.4 µm, right) images, with surface station identifiers in yellow and SPC reports of hail size in cyan [click to play MP4 animation]](https://cimss.ssec.wisc.edu/satellite-blog/images/2017/05/170508_goes16_mesoscale_visible_infrared_spc_storm_reports_Colorado_hail_storm_anim.gif)
![GOES-16 Visible (0.64 µm, left) and GOES-13 Visible (0.63 µm, right) images, with surface station identifiers in yellow [click to play animation | MP4]](https://cimss.ssec.wisc.edu/satellite-blog/wp-content/uploads/sites/5/2017/05/170508_goes16_goes13_visible_Colorado_hail_storm_anim.gif)
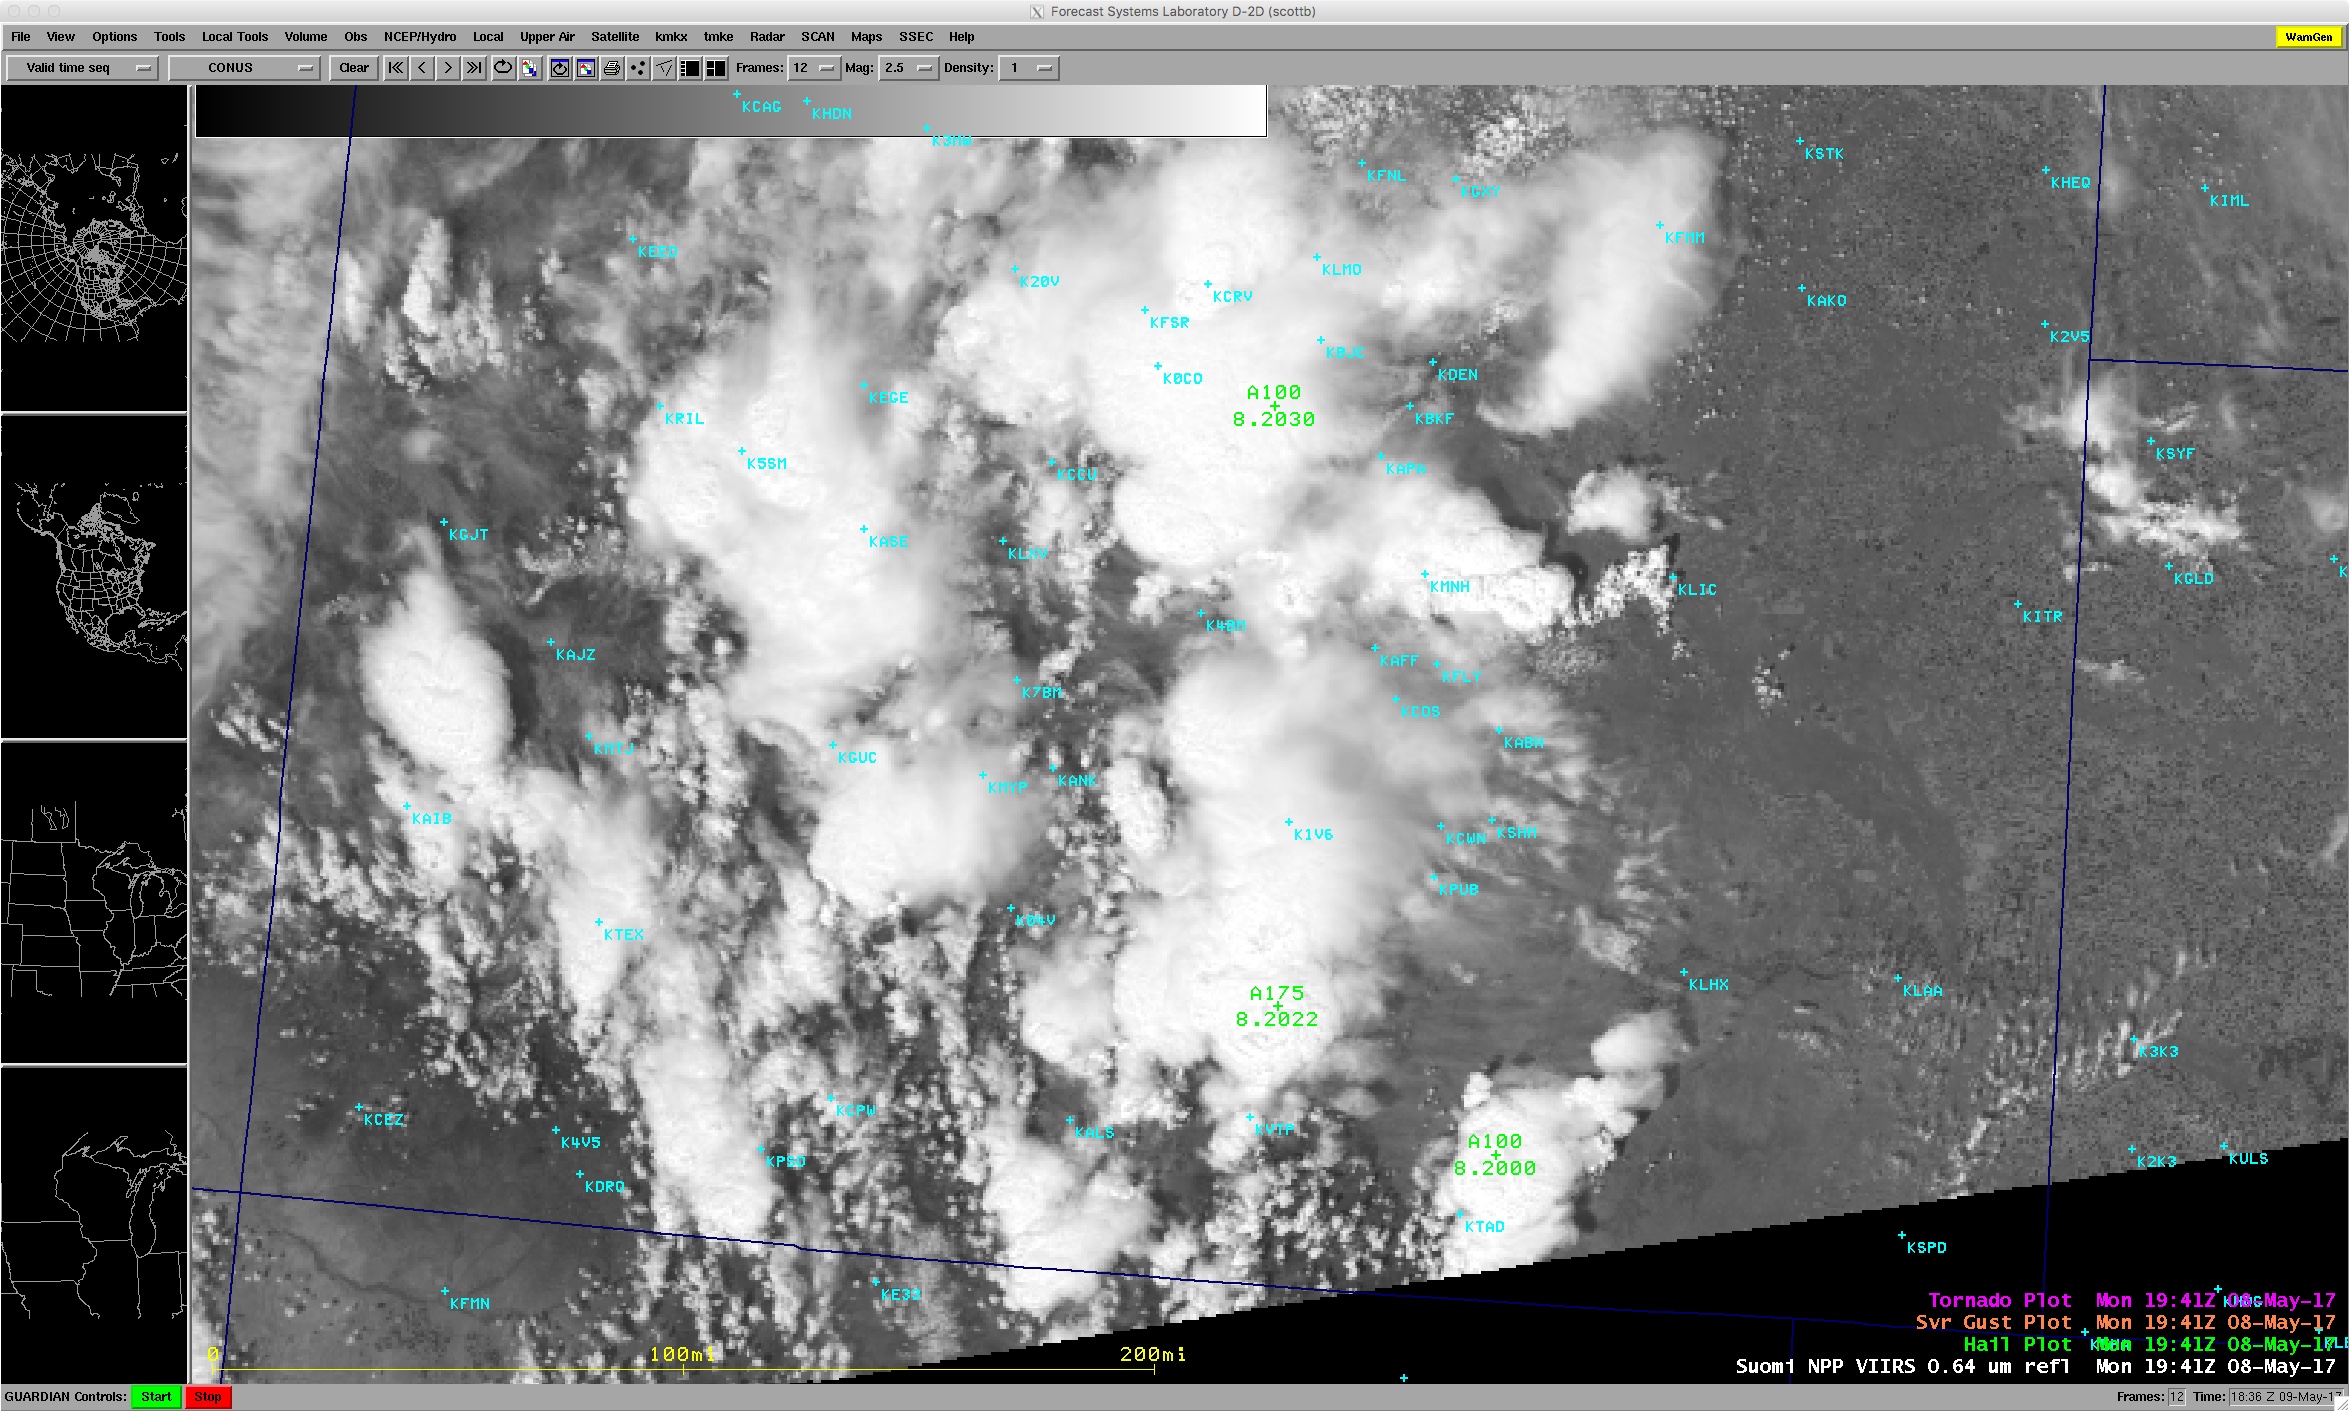
![Suomi NPP VIIRS Visible (0.64 µm) and Infrared Window (11.45 µm) images [click to enlarge]](https://cimss.ssec.wisc.edu/satellite-blog/wp-content/uploads/sites/5/2017/05/170508_1937utc_viirs_visible_infrared_Colorado_anim.gif)

/na2017_05_08_128_npp.gif)